ISSN: 1992-8645 www.jatit.org E-ISSN: 1817-3195
EVALUATION OF SIGNAL PREPROCESSING METHODS
FOR THE DETECTION OF ENDOMETRIAL CACER BY
USING NEAR INFRARED SPECTROSCOPY
Huanshuang Niu, Zhuoyong Zhang*, Yuhong Xiang, Liting Zhao, Fan Yang
Department of Chemistry, Capital Normal University, Beijing 100048, China E-mail: [email protected]
ABSTRACT
Several signal preprocessing methods used to correct near-infrared (NIR) spectra of different endometrial tissue sections have been evaluated in this paper. The real tissues sections of normal, hyperplasia, and malignant samples were used. To extract useful information and to remove the interference and background, some preprocessing methods have been compared. Particularly, spectra of the tissues section samples were assembled together to construct a 2D data matrix, so that the 2D wavelet packet transform (WPT) could be used for feature extraction. Partial least squares-discriminant analysis (PLS-DA) was used to distinguish the samples from different classes of disease states and was validated through bootstrapped Latin partition. The results of PLS-DA demonstrate that 2D WPT was the best preprocessing method among those investigated. With the decomposition level of 2 WPT, the accuracies of classification were 98 ± 2%, 99 ± 2%, and 98 ± 3%, for normal, hyperplasia, and malignant classes, respectively. The results demonstrate that NIR spectroscopy combined with 2D WPT preprocessing and proper classification methods could be a rapid, efficient, and novel means of diagnosing endometrial cancer in early stage.
Keywords: Near-infrared Spectroscopy; Endometrial Cancer; Preprocessing Method; Bootstrapped Latin Partition; Partial Least Squares Discriminant Analysis; WaveletPpacketTtransform
1.INTRODUCTION
Early diagnosis and screening of endometrial cancer are crucial for the effective treatment and reducing the mortality rate, therefore, efficient early diagnostic and screening methods are highly demanded. Current diagnostic methods of endometrial cancer include magnetic resonance imaging (MRI), serum CA125, endovaginal ultrasonography, hysteroscopy, and endometrial biopsy. MRI plays an important role in staging and planning of therapy for endometrial cancer. Several groups of researchers [1-3] have reported applications of MRI to diagnose and evaluate the stage of endometrial cancer. The staging accuracy of MRI for endometrial cancer can reach from 83% to 92% [4]. MRI has been used in routine preoperative examination, even though some researchers reported that the MRI has a high sensitivity in diagnosis of endometrial carcinoma, but lack of specificity [5, 6]. MRI is expensive and not suitable for fast screening endometrial carcinoma in large scale. A method for cheap and fast screening endometrial carcinoma is needed. CA-125 is used mainly for the diagnosis of primary
and recurrent ovarian cancer. A declining or rising CA-125 level is a useful indicator of disease and has been widely used in the detection of endometrial cancer. Endovaginal ultrasonography is often used to evaluate the thickness of endometrium. The sensitivity and specificity of this method can reach 93.5% and 99.4%, respectively [7, 8]. Compared with the methods mentioned above, hysteroscopy combined with directed endometrial biopsy or dilation and curettage (D&C) is a more standard diagnostic approach. However, biopsy as a diagnostic routine of endometrial cancer has some limitations. For example, it is difficult to distinguish between the endometrial cancer and atypical endometrial hyperplasia by biopsy [9]. Hysteroscopy is considered to be an invasive diagnostic procedure [10]. To overcome the limitations of above methods, a novel and more efficient diagnostic procedure, particularly, a fast screening method is greatly needed.
ISSN: 1992-8645 www.jatit.org E-ISSN: 1817-3195
deoxyhemoglobin, total hemoglobin, tissue hemoglobin oxygen saturation, and bulk water based on wavelength-dependent absorption were used for diagnosing cancer. For example, absorptions at various wavelength positions have been used for diagnoses of breast cancer [11-15], cervix cancer [16], prostate cancer [17]. In recent years, more work using whole spectrum have been reported. For example, reflection spectra were collected between 700 nm and 1000 nm coupled to a detachable fiber optic reflectance bundle for prostate cancer diagnosis [18], spectra between 400 nm - 900 nm were used to measure the microvascular oxygenation of histologically normal endobronchial mucosa and of neoplastic lesions [19], different ranges of spectra were compared in diagnosis of pancreas cancer [20], and diagnosis of colorectal cancer in resected human tissue specimen from hierachical cluster analysis based on spectral scans from 12,000 to 4000 cm-1 was reported [21].
The NIR spectra are complex and hard to interpret. Therefore, the key to the diagnosis of cancer based by NIRS is to extract important and latent information from the NIR spectra of the samples. Prior to classification model establishment, NIR spectra should be preprocessed, so that unrelated signals can be excluded and useful information can be enhanced. Some preprocessing methods, such as multiplicative scatter correction (MSC), standard normal variate (SNV), Savitzky-Golay (S-G) filtering, detrend correction (DC), wavelet transform (WT) and wavelet packet transform (WPT), and orthogonal signal correction (OSC) have been used separately or in combination to improve the signal-to-noise ratio and eliminate background variations. Relatively few reports on the diagnosis of early stage cancer using chemometric methods based on NIR spectroscopic data [21, 22] have been published. Also, 2D data processing and modeling have been focused recently [23, 24]. Our group has been focusing on diagnosis of early stage endometrial cancer using NIR spectroscopy combined with chemometrics in recent years [25-30].
The aims of this work is to investigate the feasibility of 2D wavelet packet transform (WPT) as a preprocessing method for the NIR spectra for endometrial cancer diagnosis. Partial least squares discriminant analysis (PLS-DA) was used to differentiate the NIR data of three types of endometrial tissues. The results demonstrated that three distinct groups can be discriminated after using the 2D WPT with accuracies of 98 ± 2%, 99 ± 2%, and 98 ± 3%, respectively.
2. THEORETICALBASIS
Data preprocessing is an important procedure for feature extraction in NIR spectroscopy because NIR spectra are characteristically have broad bands and baseline fluctuations that are caused by instrumental conditions or particle sizes of the sample. Noise and unwanted effects can often be removed by some mathematical transformations such as derivative calculation with polynomial fitting. Various spectral preprocessing methods have been widely used in NIR spectroscopy. In this work, MSC, SNV, S-G derivative, DC, and WPT were used. A comparative study of MSC, SNV, S-G derivative, and DC and their combinations was given in [30]. Therefore, description of above mentioned methods were not given here.
The wavelet packet transform (WPT) can be considered as a generalization of the wavelet transform (WT), which was introduced and developed by Coifman, et al. [31]. Compared with the WT, the WPT offers more flexibility for analytical signal representation and can be used for signal compression, feature extraction, and denoising [32].
Investigation of using 2D WPT for compression of NIR spectra based on time-series measurement has been reported [33]. The method used in this work was based on the 2D WPT scheme proposed by Trygg, et al. [34]. The 2D data matrix was constructed combining the NIR spectra into rows of a data matrix so that each row was a sample and each column was a measured wavelength. The 2D wavelet compression was applied to reduce the data matrix of spectra.
The 2D wavelet compression scheme consists of two major steps. The first step applies wavelet compression to each row. In the second step the columns are compressed by applying the wavelet transform.
The algorithm of WPT is similar to that of WT. The WPT performs a complete wavelet decomposition into smooth and detail parts. Instead of the more common pyramid algorithm that decomposes only the smooth parts into detail and smooth subsets, both the smooth and detail parts are each composed at every level so that a tree is furnished.
ISSN: 1992-8645 www.jatit.org E-ISSN: 1817-3195
enhanced by derivative transformations such as the case for NIRS [34].
The WPT algorithms are given in the following equations [35].
In the following equations, j represents the level of decomposition, p is an index of the component order, N represents the length of the decomposed signal p1,
j m
w− . The 2p j
w , and w2jp1
+ are the
approximation signal and detail signal of
1 p j
w− .
Assume that ( )φ x is a scaling function of a given multi-resolution signal decomposition and ψ( )x is the corresponding wavelet function associated with a scaling filter
{
, 2, 1,0,1, 2,}
k
H= h k=− − , and a
wavelet filter
{
, 2, 1,0,1, 2,}
k
G= g k= − − . In the wavelet
packet transform, each decomposed signal
w
pj at apart can be calculated from the signal corresponding to its abovementioned part as:
∑
1 = 1 2 2 = N m p m j k m p kj h w
w , , (1)
2 1
, 2 1,
1
N
p p
j k m k j m
m
w
+g
w
=
=
∑
(2)Thus,
w
2jp andw
2jp−1 are, respectively, theapproximation signal and detail signal of
w
jp1 fromone-step fast wavelet transform.
At the reconstruction stage each part can be constructed from its subparts by the inverse fast wavelet transform as:
m n N m N m p m j m k p m j p k
j w h w g
w 2
1
= =1
1 + 2 1 + 2 2 1 +
2 =
∑
+∑
, ,
,
(3)
The two-dimensional wavelet packet transform (2D-WPT) uses four filters in the decomposition process, therefore Vj+1 generates four frequency
bands, containing a scale space Vj and three wavelet
subspaces H1 J W −, 1
J J
W− , and 1 D J
W −. The 2D-WPT can
be defined by the one-dimensional wavelet packet transform. At first, all rows of spectral data are pretreated by one-dimensional wavelet packet transform, and subsequently all columns of the spectral data are pretreated. The result is equivalent to that the raw spectral data preprocessed by a two-dimensional wavelet packet transform because of the orthogonality of the wavelet filters.
Different from the binary tree structure of the one-dimensional wavelet packet transform, a quadtree structure is obtained from the two-dimensional wavelet packet transform, which is composed of separable wavelet packet spaces. This method is called the square transform.
In two-dimensional wavelet packet decomposition, a quadtree derived from two-scale two-dimensional wavelet packet decomposition. Every node represents one decomposition step of the two-dimensional wavelet packet transform. There are three significant steps in wavelet packet transform. The first step is to select the best wavelet basis. The best basis can be defined as the basis giving the minimum entropy or maximum information of the signal energy distribution. A simple method of selecting a basis from the full WPT is using the best-basis algorithm. This method was developed by Coifman et al [33]. In this paper, the Daubechies wavelet with 8 vanishing moments was selected. These wavelets have some beneficial characteristics including orthogonality, compact support, losslessness, biorthogonality, etc.
The second step is the selection of wavelet coefficients according to the energy values of different frequency bands [36]. The procedures of this step are as follows:
(a). The raw signal is split into frequency bands, and the energy of each frequency band is calculated.
(b). According to the energy value Ei,j of each
frequency band, the wavelet coefficient ci,j is
selected. For equation (4), i and j represent the compression level and jth frequency band, respectively. Ei,j is given by
2 0 E
∑
= = j ijij c (4)
(c). The relative energy value (RE) is introduced. RE is given by
∑
= = 0 E E j ij (5) E ERE= i0 (6)
which E is the total energy in the decomposition level j. To extract the feature of the spectra, the largest ci0 value corresponding to Ei0 should be
chosen. The third step is the selection of the optimal decomposition level of WPT, which is a key factor in the de-noising performance. After the selection of the wavelet coefficients ci0, these wavelet
ISSN: 1992-8645 www.jatit.org E-ISSN: 1817-3195
discriminant analysis (PLS-DA) to classify the spectra into one of the three types of endometrial tissue sections. The decomposition level is selected by maximizing the accuracy of the PLS-DA results. The novelty of this work is to present a new application of 2D WPT as a preprocessing method for NIR spectra in diagnosis of endometrial carcinoma.
Latin-partition method has been frequently used in dividing training and testing data sets. The whole data set is randomly partitioned into npart equally-sized groups. One group is left out for validation and the others are used for model building. It is not until each group is used once for prediction and (npart-1) times for training that the validation becomes crossed and all the objects have been used once and only once for prediction. This process was repeated for 20 times, so that the Latin-partitions would be randomized among the different evaluations. This bootstrapping will construct multiple Latin-partitions. These partitions will lead to an unbiased evaluation because the random sampling assures that the spectra in the training and prediction sets will be independent. The observed variation characterizes model stability and data consistency within the collection. If the data set is a representative sample then the variation characterizes the inherent variation of the method [37].
Partial least squares discriminant analysis (PLS-DA) is a discriminant analysis method based on partial least-squares regression. It has been widely used in developing multivariate classification models based on spectroscopic measurements. Smart PLS-DA (sPLS-DA) was used to classify the three types of endometrial tissue samples based on the preprocessed NIR data. It is an approach that automatically selects the optimal number of latent variables based on the average minimal prediction obtained from an internal bootstrap Latin partition (BLP) of the calibration set. sPLS-DA classification accuracies were used for evaluating and comparing the spectral preprocessing methods.
3.EXPERIMENTAL
3.1 Samples
A total of 154 endometrial tissue sections from 77 patients were provided by the Beijing Obstetrics and Gynecology Hospital, Affiliated to the Capital Medical University. All together there were 36 normal, 60 hyperplasia, and 58 malignant samples. The tissue sections were prepared as follows. First, endometrial tissue sections were dissected and fixed
in a 4% formaldehyde buffered solution, rinsed, and embedded in paraffin wax. Each sample was sliced and dehydrated on a glass plate. After the sample slices were dried, they were mounted on the plate, for measurement. The thickness of each paraffin section was 4 µm approximately.
3.2 Instrumentation and spectral data acquisition
NIR spectra of these 154 endometrial tissue sections were collected by using a Nicolet 6700 Extended Fourier Transform Near Infrared (FT-NIR) spectrometer (Thermo Electron, U.S.A.) with an integrating sphere diffuse reflectance system, an InGaAs detector, and an Omnic 7.3 spectrum collection system. In this study, the reflectance mode was used and the samples were placed on an integrating sphere and directly measured by the NIR spectrometer. The sample arangement for NIR measurement was given in [30]. The spectra were measured at room temperature with air as the standard reflectance material for the spectral background measurements. Each spectrum was collected as an average of 64 scans for each sample. The range of spectral measurement was from 10,000 to 4,000 cm-1 with a resolution of 4.0 cm-1 with a data interval of 1.928 cm-1, resulting in 3111 resolution elements (i.e., spectral variables). NIR spectra were collected at five different spots for each sample, and the mean spectrum was used as the spectrum of the tissue section.
After the 2D-WPT denoising step, the data set was divided into calibration and prediction sets using the Latin partition method. To validate the procedure, the Latin partitions were bootstrapped 20 times. The prediction data was pooled for the 4 partitions and averaged heracross the 20 bootstraps. The average prediction results are reported with 95% confidence intervals. The computation was performed with MATLAB Toolbox.
4. RESULTSANDDISCUSSION
4.1 Spectral investigation
ISSN: 1992-8645 www.jatit.org E-ISSN: 1817-3195
manifest themselves in the spectra. NIR spectra differ from some other spectra such as UV-Vis and MIR spectra, NIR spectra contain redundant information which may interfer the useful information. It is necessary to select the appropriate preprocessing method to exclude redundancy and to extract useful information from the NIR spectra.
Figure1. Original spectra of endometrial tissues
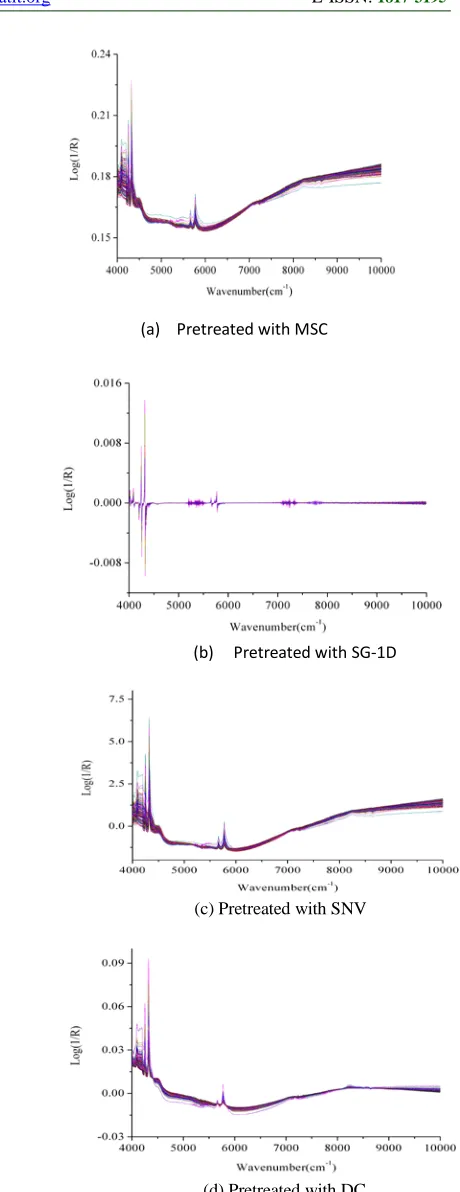
Various spectral preprocessing methods are available for extracting useful information, removing the noise and improving the model stability and predictability. These methods can be used separately or in combination. In this work, MSC, SG-1D, SNV, DC, and 1D and 2D WPT were used. To eliminate unrelated information and enhance the difference among samples from different classes, several preprocessing methods have been used and the processed spectra are given in Figure 2 (a)-(d), respectively. MSC was used to correct the scatter light influence caused by differences in the tissue size and thickness. The spectra pretreated by MSC are represented in Figure 2 (a). Calculation of derivatives is a commonly used method to eliminate a sloping background and baseline drift. The derivative NIR spectra of the samples treated by using the SG-1D method are given in Figure 2 (b). It can be seen from the figure that the background and signal shift have been effectively corrected. The SNV corrected spectra are presented in Figure 2 (c). This method is commonly applied to correcting for scatter effects due to the differences of particle size between samples. The DC corrected spectra are represented in Figure 2 (d). It models the background as a straight line and subtracts it from each spectrum. In some cases, these methods are used in combination to achieve best performance.
(a) Pretreated with MSC
(b) Pretreated with SG-1D
(c) Pretreated with SNV
[image:5.612.298.528.83.679.2](d) Pretreated with DC
Figure 2. NIR Spectra Of Endometrial Tissue Samples Obtained From Different Preprocessing
ISSN: 1992-8645 www.jatit.org E-ISSN: 1817-3195
4.2 Partial least squares discriminant analysis
(PLS-DA)
For the PLS-DA classification, 154 samples were randomly split into two data sets using Latin partitions. Each subset was used once for prediction and once for calibration. Twenty bootstrapped Latin partitions (BLP) were conducted for the data set and the prediction errors were pooled for the two partitions and then averaged across the twenty bootstrap evaluations.
For sPLS-DA, the number of latent variables was chosen that furnished the lowest average prediction error. This result was obtained from 2 Latin partitions and 10 bootstraps of the calibration data set that occur internal to the sPLS-DA function. Because the sPLS-DA occurs inside the outer BLP evaluation, the internal bootstrap was conducted 40 times (i.e., 2 Latin partitions for 20 bootstraps) for each PLS model that was built. BLP was used because this method can produce better statistacal results and more suitable for evaluating classification models.
1) Classification accuracies by using PLS-DA with different preprocessing methods
The purpose of this work is to investigate the effectiveness of different preprocessing methods. Various wavelet compression methods are also preprocessing approaches, however, in this section only some commonly used preprocessing methods are discussed and the wavelet packet transform will be addressed in the following sections.
Sensitivity and specificity are statistical measures of the performance of a binary classification test, also known in statistics as classification function. Sensitivity measures the proportion of actual positives which are correctly identified as such. Specificity measures the proportion of negatives which are correctly identified. In practical result presentation, sensitivity relates to the test's ability to identify positive results, and specificity relates to the ability of the test to identify negative results. In this work, acurracy was used to demonstarte classification results because we are coping with a three-class problem, i.e. identification of normal, hyperplasia, and malignant samples.
Classification results from sPLS-DA using different preprocessed spectra are given in TABLE I. Accuracy is given as the ratio of TS/ET, where TS and ET are the numbers of the true samples and total samples of each class, respectively. The total accuracy is given by the ratio of (TN+TH+TM)/T,
where TN, TH, and TM are the numbers of correctly predicted samples from normal, hyperplaisa, and malignant tissue samples, respectively. T is the total number of samples from the three classes. It can be seen from TABLE I that the accuracies of classification using different spectral preprocessing methods are quite different. The highest accuracy was achieved by using the SG-1D algorithm as the preprocessing method. The total accuracy of three classes by using SG-1D could reach as high as 94±5%. The lowest accuracy was achieved with the data preprocessed by using MSC, which was 84±8%.
TABLE I. The Results Of PLS-DA Obtained From Different Preprocessing Methods
Preprocessing methods
Accuracy of normal
samples (%)
Accuracy of hyperplasia samples (%)
Accuracy of malignant samples (%)
Total accuracy of samples
(%)
No-preprocessing 86±10 94±3 92±4 91±6
MSC 84±8 82±10 87±6 84±8
SG-1D 91±7 95±3 95±5 94±5
SNV 86±7 86±7 89±5 87±6
DC 87±8 86±7 90±5 86±7
2) The classification accuracies of PLS-DA with data preprocessed with 1D wavelet packet transform
Classification results of PLS-DA obtained from spectra pretreated by using 1D wavelet packet transform are given in TABLE II. A matrix of wavelet coefficients ci0 was determined based on
the energy of each frequency band and it was inversely transformed into the denoised spectral matrix. From TABLE II, it can be seen that the classification results of PLS-DA corresponding to different ci0 coefficients are different. The highest
accuracies were obtained corresponding to c10, for
which the accuracies were 90±5%, 87±6%, and 91±4%, for normal, hyperplasia, and malignant classes, respectively. The lowest accuracies were obtained corresponding to c30. This result
demonstrates that an optimal decomposition level is needed for optimal data compression and feature extraction.
3) Classification accuracies of PLS-DA with data preprocessed with 2D wavelet packet transform
ISSN: 1992-8645 www.jatit.org E-ISSN: 1817-3195
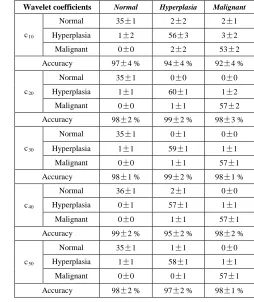
section 3.3. From TABLE III it can be seen that all the accuracies were over 90%. The highest accuracies were corresponding to c20, which were
98 ±2%, 99 ± 2%, and 98 ± 3%, for normal, hyperplasia, and malignant classes, respectively. The lowest accuracies were 97 ± 4%, 94 ± 4%, and 92 ± 4%, for the normal, hyperplasia, and malignant classes, respectively, corresponding to c10. The
[image:7.612.85.542.324.665.2]best results were obtained at a decomposition level of 2. This level of accuracy can satisfy most practical applications. By comparing the results between the 1D wavelet packet transform (TABLE II) and 2D wavelet packet transform (TABLE III), it can be concluded that the 2D wavelet packet transform as a preprocessing method gave better results.
TABLE II. The Results Of PLS-DA Obtained From 1D Wavelet Packet Transform
Wavelet
coefficients Normal Hyperplasia Malignant
c10
Normal 32±2 3±1 2±1
Hyperplasia 2±2 52±3 4±3
Malignant 2±2 5±3 53±3
Accuracy 90±5
% 87+6 % 91±5 %
c20
Normal 32±2 5±1 4±1
Hyperplasia 3±1 48±3 10±4
Malignant 1±1 7±3 44±4
Accuracy 89±5
% 80±5 % 77±6 %
c30
Normal 25±3 6±1 4±2
Hyperplasia 10±3 41±4 13±2
Malignant 2±1 13±3 40±3
Accuracy 68±7
% 68±7 % 70±5%
c40
Normal 26±3 7±2 3±2
Hyperplasia 8±2 38±2 13±3
Malignant 1±2 14±3 42±3
Accuracy 73±8
% 64±4 % 72±5 %
c50
Normal 26±2 6±2 3±2
Hyperplasia 9±2 39±2 12±2
Malignant 1±1 14±3 43±3
Accuracy 71±6
% 65±4 % 74±5 %
5.CONCLUSION
In summary, a novel diagnosis application of 154 endometrial tissue specimens by near infrared spectroscopy combined with chemometric methods is presented by using sPLS-DA classifiers based on
preprocessed spectra with different methods. The classification results demonstrate that 2D wavelet packet transform, as a preprocessing method, was more effective in spectral data compression and extracting useful features. Based on the results of PLS-DA classification, it can also be concluded that the selection of appropriate preprocessing methods and decomposition levels are crucial for data analysis of NIR spectra. Different from 1D wavelet packet transform, the 2D wavelet packet transform can generate a quadtree with more than two forks in the process of decomposition, so the data compression is more effective. The results suggest that 2D wavelet packet transform is feasible as a data preprocess method for the development of a diagnostic approach of early stage endometrial cancer based on the NIR spectra of endometrial tissues.
TABLE III. The Results Of PLS-DA Obtained From 2D Wavelet Packet Transform
Wavelet coefficients Normal Hyperplasia Malignant
c10
Normal 35±1 2±2 2±1
Hyperplasia 1±2 56±3 3±2
Malignant 0±0 2±2 53±2
Accuracy 97±4 % 94±4 % 92±4 %
c20
Normal 35±1 0±0 0±0
Hyperplasia 1±1 60±1 1±2
Malignant 0±0 1±1 57±2
Accuracy 98±2 % 99±2 % 98±3 %
c30
Normal 35±1 0±1 0±0
Hyperplasia 1±1 59±1 1±1
Malignant 0±0 1±1 57±1
Accuracy 98±1 % 99±2 % 98±1 %
c40
Normal 36±1 2±1 0±0
Hyperplasia 0±1 57±1 1±1
Malignant 0±0 1±1 57±1
Accuracy 99±2 % 95±2 % 98±2 %
c50
Normal 35±1 1±1 0±0
Hyperplasia 1±1 58±1 1±1
Malignant 0±0 0±1 57±1
Accuracy 98±2 % 97±2 % 98±1 %
ACKNOWLEDGMENTS
[image:7.612.284.538.331.633.2]ISSN: 1992-8645 www.jatit.org E-ISSN: 1817-3195
Harrington of Ohio University is thanked for helpful comments and criticisms.
REFERENCES
[1] J. R. Xu and S. X. Yang, “Application of magnetic resonance imaging to diagnosis of endometrial cancer and staging,” Chin. Comput. Med. Imag., vol. 3, 1997, pp.105-107.
[2] Y. L. Li, J. L. Xu and J. L. Zhang, “Application of MRI to diagnosis of stageⅠor
Ⅱ of endometrial cancer and evaluation of value of this method,” He Nan J. Surg., vol. 13, 2007, pp. 73-74.
[3] K. Kinkel, R. Forstner, F. M. Danza, L. Oleaga, T. M. Cunha, and A. Bergman, “Staging of endometrial cancer with MRI: Guidelines of the European Society of Urogenital Imaging,” Eur.Radiol., vol. 19, 2009, pp. 1565-1574.
[4] H. H. Lien, V. Blomlie, C. Trope, J. Kaern, and V. M. abeler, “Cancer of the endometrium: value of MR imaging in determining depth of invasion into the myometrium,” Am. J. Roentgenol., vol. 157, 1991, pp. 1221-1223.
[5] A. G. Rockall, R. Meroni, S. A. Sohaib, K. Reynolds, F. Alexander-sefre, J. H. Shepherd, and I. Jacobs, “Evaluation of endometrial carcinoma on magnetic resonance imaging,” Int. J. Gynecol. Cancer., vol. 17, 2007, pp. 188-196.
[6] R. D. Bao, A. R. Wu, H. Ouyang, X. Z. Su, and J. H. Sun, “Magnetic resonance imaging in the diagnosis and staging of endomentrial carcinoma,” Chin. J. Obstet. Gynecol., vol. 30, 1995, pp. 215-217.
[7] S. Granberg, M. Wikland, B. Karlsson, A. Norstrom, and L. G. Friberg, “Endometrial thickness as measured by endovaginal ultrasonography for identifying endometrial abnormality,” Am. J. Obstet. Gynecol., vol. 164, 1991, pp. 47-52.
[8] N. Makris, N. Skartados, K. Kalmantis, G. Mantzaris, A. Papadimitriou, and A. Antsaklis, “Evaluation of abnormal uterine bleeding by transvaginal 3-D hysterosonography and diagnostic hysteroscopy,” Eur. J. Gynecol. Oncol., vol. 28, 2007, pp. 39-42.
[9] T. P. Canavan and N. R. Doshi, “Endometrial cancer,” Am. Fam. Physician., vol. 59, 1999, pp. 3069-3077.
[10]F. A. Haemila, D. Youssef, M. Hassan, A. Soliman, and M. Mossad, “A prospective comparative study of 3-D ultrasonography and hysteroscopy in detecting uterine lesions in premenopausal bleeding,” Middle. East. Fertil. Soc. J., vol. 10, 2005, pp. 238-243.
[11]S. Nioka and B. Chance, “NIR spectroscopic detection of breast cancer,” Technol. Cancer. Res. Trea., vol. 4, 2005, pp. 497-512.
[12]N. Shah, A. Cerussi, C. Eker, J. Espinoza, J. Butler, and J. Fishkin, “Noninvasive functional optical spectroscopy of human breast tissue,” P. Natl. Acad. Sci. USA, vol. 98, 2001, pp. 4420-4425.
[13]S. Prince and S. Malarvizhi, “Monte Carlo simulation of NIR diffuse reflectance in the normal and diseased human breast tissues,” Biofactors., vol. 30, 2007, pp. 255-263.
[14]S. H. Chung, A. E. Cerussi, C. Klifa, H. M. Baek, O. Birgul, and G. Gulsen, “In vivo water state measurements in breast cancer using broadband diffuse optical spectroscopy,” Phys. Med. Biol., vol. 53, 2008, pp. 6713-6727.
[15]C. H. Schmitz, D. P. Klemer, R. Hardin, M. S. Katz, Y. Pei, and H. L. Graber, “Design and implementation of dynamic near-infrared optical tomographic imaging instrumentation for simultaneous dual-breast measurements,” Appl. Optics., vol. 44, 2005,pp. 2140-215.
[16]R. Hornung, T. H. Pham, K. A. Keefe, M. W. Berns, Y. Tadir and B. J. Tromberg, “Quantitative near-infrared spectroscopy of cervical dysplasia in vivo,” Hum.Reprod, vol. 14, 1999, pp. 2908-2916.
[17]J. H. Ali, W. B. Wang, M. Zevallos, and R. R. Alfano, “Near infrared spectroscopy and imaging to probe differences in water content in normal and cancer human prostate tissues,” Technol. Cancer. Res. Treat., vol.3, 2004, pp.491-497.
[18]S. Asgari, H. J. Röhrborn, T. Engelhorn, and D. Stolke, “Intra-operative characterization of gliomas by near-infrared spectroscopy: possible association with prognosis,” Acta. Neurochir., vol.145, 2003, pp. 453-460.
ISSN: 1992-8645 www.jatit.org E-ISSN: 1817-3195
[20]V. R. Kondepati, J. Zimmermann, M. Keese, J. Sturm, B. C. Manegold, and J. Backhaus, “Near-infrared fiber optic spectroscopy as a novel diagnostic tool for the detection of pancreatic cancer,” J. Biomed. Opt., vol. 10, 2005, pp. 054016(1-6).
[21]V. R. Kondepati, M. Keese, R. Mueller, B. C. Manegole, and J. Backhaus, “Application of near-infrared spectroscopy for the diagnosis of colorectal cancer in resected human tissue specimens,” Vib. Spectrosc., vol. 44, 2007, pp. 236-242.
[22]V. R. Kondepati, T. Oszinda, H. M. Heise, K. Luig, R. Mueller, and O. Schroeder, “CH-overtone regions as diagnostic markers for near-infrared spectroscopic diagnosis of primary cancers in human pancreas and colorectal tissue,” Anal. Bioanal. Chem., vol. 387, 2007, pp.1633-1641.
[23]Z. Liu, L. Li, “A 3D Model Retrieval Algorithm Based on BP-bagging”, J. Theor. Appl. Infor. Tech., Vol. 46. No. 1, 2012, pp 098 – 102.
[24]F. Hu, Z.Q. Wang, “3D Complex Curved Surface Reconstruction of Discrete Point Cloud based on Surfels”, J. Theor. Appl. Infor. Tech., Vol. 46. No. 2, 2012, pp 0883 - 0888
[25]K. Xu, Y. H. Xiang, Y. M. Dai, and Z. Y. Zhang, “Near infrared spectroscopy combined with principal component analysis applied to diagnosis of endometrial carcinoma,” Chem. J. Chinese. U., vol. 30, 2009, pp. 1543-1547.
[26]L. T. Zhao, Y. H. Xiang, Y. M. Dai, and Z. Y. Zhang, “Study of near infrared spectral preprocessing and wavelength selection methods for endometrial cancer tissue,” Spectrosc. and Spect. Anal., vol. 30, 2010, pp. 901-905l.
[27]Y. H. Xiang, K. Xu, Z. Y. Zhang, Y. M. Dai, and P. B. Harrington, “Near infrared spectroscopic applications for diagnosis of endometrial carcinoma,” J. Biomed. Opt., vol. 15, 2010, pp. 067002.
[28]J. J. Zhang, Z. Y. Zhang, Y. H. Xiang, Y. M. Dai, and P. B. Harrington PB, “An emphatic orthogonal signal correction-support vector machine method for the classification of tissue sections of endometrialcarcinoma by near infrared spectroscopy,” Talanta, vol. 83, 2011, pp. 1401-1409.
[29]N. Qi, Z. Y. Zhang, Y. H. Xiang, and P. B. Harrington, “Locally linear embedding method
for dimensionality reduction of tissue sections of endometrial carcinoma by near infrared spectroscopy,” Anal. Chim. Acta., vol. 724, 2012, pp. 12-19.
[30]F. Yang, J. Tian, Y. H. Xiang, Z. Y. Zhang, and P. B. Harrington, “Near infrared spectroscopy combined with least squares support vector machines and fuzzy rule-building expert system applied to diagnosis of endometrial carcinoma,” Cancer. Epidemiol., vol. 36, 2012, pp. 317-323,.
[31]R. R. Coifman, Y. Meyer, S. R. Quake, and M. V. Wickerhauser, “Signal processing and compression with wavelet packets,” J. Astrophys. Astron., vol. 442, 1994, pp.363-379.
[32]V. R. Kondepati, M. Keese, R. Mueller, and J. Backhaus, “Near-infrared spectroscopic detection of human colon diverticulitis: A pilot study,” Vib. Spectrosc., vol. 44, 2007, pp. 56-61.
[33]R. R. Coifman and M. V. Wickerhauser, “Entropy-based algorithms for best basis selection,” IEEE Trans. Inform. Theory., vol. 38, 1992, pp. 713-718.
[34]J. Trygg, N. Kettaneh-Wold, and L. Wallbacks, “2D wavelet analysis and compression of on-line induystrial process data,” J. Chemom., vol. 15, 2001, pp. 299-319.
[35]F. Chou, Y. Liang, J. Gao, and X. Shao, Chemometrics: From Basic to Wavelet Transform. 1st ed.. Hoboken: Wiley-Interscience, 2004.
[36]Y. Yin, H. Yu, and H. Zhang, “A feature extraction method based on wavelet packet analysis for discrimination of Chinese vinegars using a gas sensors array,” Sens. Actuators.B, vol. 134, 2008, pp. 1005-1009.