ORIGINAL RESEARCH ARTICLE
COMPARATIVE ANALYSIS BETWEEN THE LABOR PRODUCTIVITY INDEXES IN A
HORIZONTAL HOUSING COMPLEX AND THE INDEXES OF THE PRICE
COMPOSITION TABLE FOR BUDGETS (TCPO)
1
Caroline Oliveira Simonassi,
2Lorena Lima Curcino de Eça,
3Débora Valim Sinay Neves
and
4Nilton Meira Correia Neto
1
Specialist in Management of Engineering Works - UNIGRAD (Faculty Guanambi), Vitória da Conquista,
BA, Brazil
2
Specializing in Engineering Management - UNIGRAD (Guanambi Faculty), Vitória da Conquista, BA, Brazil
3Professor of the Independent Faculty of the Northeast - FAINOR / BA
4
Specialist in Management of Engineering Works - UNIGRAD (Guanambi Faculty),
Vitória da Conquista, BA, Brazil
ARTICLE INFO ABSTRACT
The objective of this study was to analyze labor productivity indexes obtained in a Horizontal Housing Complex, in Vitória da Conquista - Bahia, to establish a comparison between the real labor productivity indexes and the productivity indexes of the Price Composition Table for Budgets - TCPO. It was used a quantitative approach, whose services analyzed were: structural masonry; internal coating; internal paving; outer coating; and external paving. Data collection was done through documentary analysis and bibliographic research. In order to measure productivity, the Unit Ratio of Production - RUP was used periodically. Data analysis was carried out with the theoretical support of the Exploratory Data Analysis - AED and Descriptive Statistics, whose presentation of the analyzed data was done through tables and graphs. From the collected data and the analyzes, the study reached its objectives with the re
ach of the answers to the guiding question of this research. In this context, it was evidenced that despite the differences between the TCPO indexes and the actual indexes of the enterprise, this variation did not represent a delay in the service execution period. In addition, a database was created with labor productivity indexes, serving as a basis for future planning and budgeting in the southwestern region of Bahia.
Copyright © 2018,Caroline Oliveira Simonassiet al. This is an open access article distributed under the Creative Commons Attribution License, which permits
unrestricted use, distribution, and reproduction in any medium, provided the original work is properly cited.
INTRODUCTION
Civil Construction is characterized by the transformation of inputs into outputs, where inputs are transformed into products. In this context, productivity can be understood, according to Mattos (2010, p.77), as the rate of production of a given service by a person or equipment within a specified time interval.
*Corresponding author:Caroline Oliveira Simonassi,
1
Specialist in Management of Engineering Works - UNIGRAD (Faculty Guanambi), Vitória da Conquista, BA, Brazil
Thus, the measurement of productivity becomes important since, from the analysis of these indicators, the actions will be directed to the processes whose performances are below their possible capacity. Several reasons justify the choice of labor productivity as an object of study. Souza and Agopyan (1996, p.1) emphasize the fact that Civil Construction has its rhythm dictated by the production capacity of labor, since labor is the resource where the greatest losses are verified and because it is difficult to control. In addition, productivity measurement enables the creation of a database for feedback of budgets and planning. The services chosen to be analyzed were: structural masonry; internal coating; internal paving; outer coating; and
ISSN: 2230-9926
International Journal of Development Research
Vol. 08, Issue, 05, pp.20268-20275, May,2018
Article History:
Received 24th February, 2018 Received in revised form 20th March, 2018 Accepted 27th April, 2018 Published online 28th May, 2018
Key Words:
Productivity indexes. Labor. Planning. TCPO.
Citation: Caroline Oliveira Simonassi, Lorena Lima Curcino de Eça, Débora Valim Sinay Neves and Nilton Meira Correia Neto, 2018.
“Comparative analysis between the labor productivity indexes in a horizontal housing complex and the indexes of the price composition table for budgets (TCPO)”, International Journal of Development Research, 8, (05), 20268-20275.
external paving. Data collection was done through documentary analysis and bibliographic research. In order to measure productivity, the Unit Ratio of Production - RUP was used periodically. Data analysis was carried out with the theoretical support of the Exploratory Data Analysis - AED and Descriptive Statistics, whose presentation of the analyzed data was done through tables and graphs. It was established as a general objective of the research, to generate and analyze labor productivity indexes obtained in a Horizontal Housing Complex, in Vitória da Conquista - Bahia, in order to establish a comparison between the indexes of productivity of the real labor force study and labor productivity indexes of the Price Composition Table for Budgets - TCP. As specific objectives, the research aimed to: identify if there are differences between the indexes of productivity of the real workforce of the enterprise and the rates of TCPO; measure these differences; discuss the possible consequences of these differences for the accomplishment of the work in relation to the planned schedules; and, finally, to set up a database to serve as a facilitator for future planning and budgets in Vitória da Conquista.
Production Planning and Control
Civil Construction is, in fact, one of the most productive branches of the country. This sector has undergone significant changes in recent years. In the face of increasing demands on quality standards and high competitiveness, construction companies have found that investing in process management and control is imperative, since, according to Mattos (2010, p.21), in the absence of good planning and control, the ventures suffer low in their main indicators: the term, the cost, the profit, the return on the investment and the cash flow. For Ackoff (1976, p.1), planning can be considered as a set of effective means to achieve a desired future. Planning should be monitored through control procedures. According to Avila and Jungles (2006, p. 213), "the objective of the control is to recognize the mistakes and deviations committed, allowing to record the experience gained, so as to expedite any corrective action and avoid the recurrence of errors or inadequate administrative procedures" . For the measurement of tasks and services it is necessary the presence of numbers. These numbers serve to quantify what is being done based on a given unit of measure. At its most basic principle, performance indicators transform activities and services into numbers that can be quantified, on a measurement basis, for future management and comparison of management. According to
Fernandes (2004, p.4), [...] measuring is a necessity for
administration, producing indicators is a necessity for administration and using indicators is to measure what you want to manage. Therefore, measuring is producing information using indicators, and making use of indicators is manage based on information. When you start a work, the ideal is to know exactly how long the jobs will last and, therefore, when they will end. Therefore, it is important to plan in detail the services that will be implemented in all phases of the project. The end product of the planning is the timeline. The timeline is an important management tool because it visually expresses the schedule of the activities that will be carried out during construction.
Productivity and the Process of Transformation
Productivity permeates the various areas of knowledge related to the understanding of productive activities and their impacts
on society. For Souza (2006, p.21), with regard to production, productivity would be associated, from a very basic point of view, with the comparison of the result obtained with the demanded effort. For Araujo (1997, p.140), one of the ways to achieve these goals is by reducing the internal inefficiencies of processes. According to Mattos (2010, p.77), productivity is defined as the rate of production of a person, team or equipment, that is, the quantity of work units produced in a specified time interval. That is, for this author, "the higher the productivity, the more units of the product are made in a certain space of time".
Labor Productivity Indexes
The productivity of the workforce and its control are extremely important factors for Civil Construction. The definition of productivity is linked to the study of the quantity of work, in a unit of time, to realize a certain volume of service. According to Souza (2006, p.24), "labor productivity from the physical point of view could be defined as efficiency in transforming workers' effort into construction products."Mattos (2006, p. 71) states that the measurement of labor productivity is an empirical system, which depends on several factors, such as experience and supervision, which means that productivity has to be constantly measured. Several factors can influence labor productivity, so these factors should be known to the planner and manager. According to Dantas (2011, p.22), "the value of productivity depends on a number of factors, including service detailing, learning effect, mobilization, demobilization, construction site organization, ergonomics, appropriate equipment and tools, temperature, etc. " For Mattos (2010, p.76) the main factors influencing labor productivity are the degree of team experience, the degree of service knowledge and logistical support. Therefore, in order to predict the productivity of labor, the use of previous experiences is extremely relevant, but care should be taken to inform the record of such information. For builders, it is interesting to set up a database with productivity indexes based on the actual experience of the works carried out by the company.
Unitary Ratio of Production - RUP
Considering the relevance of productivity indicators, a unit of measurement should be standardized for them. The RUP is a meter of the amount of men and hours spent to perform a certain amount of service. Considering the relation of Men x hour and the quantity of service performed, it is verified that the index of productivity is better when the relation between the consumption and the results grows. As a result, the higher the RUP, the lower the productivity of whatever service. Figure 1 shows the formula for the RUP calculation.
Figure 1. Formula to calculate the Unitary Ratio of Production - RUP
= ℎ
Hh = Men spend hours
QS = Amount of service performed Source: SINAPI.
available for the execution of the service is considered. Lack of tools, material or planning failure are not overlooked in the process. For the measurement of productivity, based on the RUP, all the available service time is computed, and not only, the productive time of the employee. In order to measure the quantity of service, it is defined the adoption of the actual quantity executed, any gaps or possible "voids" during the execution of the service being disregarded. The units of measure can vary according to the type of service, being able to be quantified the length, volume, area, according to the interest of the analysis. Considering the manager's interest, or of a certain type of planning, the RUP can be analyzed based on different units of time. Based on the different periods of time associated with the RUP's entrances and exits, the daily, cumulative, cyclical or periodic RUP can be cited. The daily RUP is the index that daily analyzes the productivity of the workforce, being considered the Men x hour used and the output of the product, or quantity of related service. The cumulative RUP is analyzed considering the accumulation of the quantities of Men x hour and service from the beginning of the execution until the date of the verification. In this case, the production data are computed as a whole, considering the best and worst days of productivity. The cyclical OR is usually adopted as a way of analyzing the service, when it has well defined execution cycles, which facilitates the consideration of standardized services. When a certain period is used to verify the activities performed, the RUP used is the periodic RUP. Another type of RUP, this time unrelated to time, is the potential OR. The potential OR, for Dantas (2011, p.9), indicates a productivity potentially achievable provided that, while maintaining a certain content of work, there are no problems regarding the management of the same. According to Souza (2006, p.39), the RUPpot mathematically is calculated as the median value of the RUPd lower than the RUPcum value at the end of the study period.
Investigative Trajectory
To carry out the research, a research with a quantitative approach was developed, with emphasis on the case study. Quantitative research was chosen because, according to Richardson (2012, p. 70), "the intention to guarantee the accuracy of the results" was chosen. The case study has been widely used in Engineering since it is a methodological approach to research that allows the researcher to build his own paths. According to Gil (2008, p.57), the case study is characterized by the deep and exhaustive study of an object, so as to allow its ample and detailed knowledge. Thus, the choice of the case study was due to the need to observe the reality of the problem, in the most profound and detailed way possible, emphasizing the analysis of the object under study specifically in the context in which it is inserted. The research was carried out in a Horizontal Housing Set, in Vitória da Conquista, Bahia. The project is financed by the Minha Casa Minha Vida - PMCMV Program and is intended for families who have income between two and six minimum wages. Inscribed in a total land area of 43,760.30 m², there are 44 buildings built, as well as infrastructure and equipment. Each building has four floors, each floor consisting of four apartments, totaling 704 apartments. According to Paliari (1999, p.256), if data collection is not performed correctly, there is a risk of compromising the entire analysis of the results. Taking into account that the main objective of the data collection was to obtain the OR, and associating these aspects with the objectives outlined for this methodology, a series of resources
were defined, such as: spreadsheets, collection procedures and photographic records for obtaining the required information. The first stage of data collection consisted of planning the collection and involved, among other activities, preliminary contact with the work under study, involvement of the workforce, understanding and quantification of the services to be analyzed. The second stage consisted in the data collection itself. The bibliographical research was also used to obtain the information necessary for the development of the research, carried out by consulting the labor productivity indexes of the book TCPO, 13th edition, 2010. Data analysis is essential in any research. This stage, according to Teixeira (2003: 191), refers to the "process of forming meaning beyond data" and this formation is consolidated, limiting and interpreting data previously collected. In this context, the data analysis was carried out with the theoretical support of AED, proposed by Guimarães (2008), and Descriptive Statistics, presented by Reis (2008). The primary data collected were subjected to a verification using the AED. According to Guimarães (2008, p.25), "the techniques of exploratory data analysis contribute to increase the effectiveness of statistical analysis, easily and quickly." The AED was used in order to precede a critical review to suppress extraneous values and possible errors. For this, the data were initially coded and tabulated. According to Reis (2008, page 18), after collecting and critiquing the data, it is convenient to organize them in a practical and rational way to enable a better understanding of the phenomenon studied. The presentation of the data was done through tables, tables and graphs, since, according to Reis (2008, page 23), "the success in the use of statistical data depends to a great extent on the way in which they are presented and can be used ". Finally, it is necessary to interpret the results found. Therefore, the development of the investigative trajectory in a judicious way, becomes essential condition for the success and legitimacy of the later phase of analysis and discussion of the data.
DATA ANALYSIS AND DISCUSSION
Productivity Indexes of the Studied Enterprise
This section presents a brief conceptualization of the services analyzed, photos to illustrate the important details of the services developed, as well as all the calculations made to obtain the RUP. The daily workday was nine hours. As a result of these calculations, the amount of hours a man spent for the execution of a certain amount of service was obtained. The
calculations of productivity indexes are considered
individually, separating officers and servants.
[image:3.595.309.561.615.765.2]Source: Research (2016).
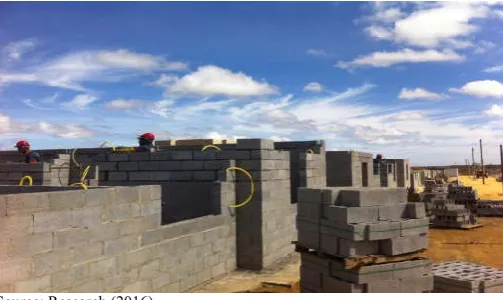
Marking of the First Spire and Lift of Masonry
The marking of the first row is of great importance for the execution of a masonry with good quality, as it will be the reference for the elevation of all masonry. After the marking is completed, and with the starters and electric inlays checked, the construction of the lifting masonry is started. Below, in Figure 2, the execution of the structural masonry erection with concrete blocks in the study under study is presented. Follows calculations of the ORs of masons and servants for the execution of the service of marking of first row and raising of masonry, according to established standards.
=6 54 ℎ
444,51 ² = 0,73 ℎ/ ²
=3 54 ℎ
444,51 ² = 0,36 ℎ/ ²
Mbossing
The plaster is the regularization mortar used for the uniformization of the surface, correcting the irregularities, protrusions and alignment. In the project where the case study was carried out, an internal stencil with a 1: 3 trace and a 20 mm thickness was used. Figure 3 shows the execution of the plumbing in the bathroom of one of the apartments of the project under study.
[image:4.595.326.544.54.315.2]Source: Research (2016)
Figure 3. Execution of Emboço in the Venture in Study
Follow RUP calculations of masons and servants to perform the framing service.
=1 18 ℎ
52,64 ² = 0,34 ℎ/ ²
=0,5 18 ℎ
52,64 ² = 0,17 ℎ/ ²
Smooth plaster
In the study under study, the procedure for coating with gypsum paste was uncoated and occurred on the walls and ceilings of dry areas, and on the kitchen ceiling (wet area). Figure 4 shows the execution of the smooth plaster coating inside the apartment in the study under study.
Source: Research (2016).
Figure 4. Execution of the Coating in Smooth Plaster in the Venture in Study
Follows calculations of the ORs of masons and servants for the execution of the service of smooth plaster.
=2 18 ℎ
156,79 ² = 0,23 ℎ/ ²
=0,2 18 ℎ
156,79 ² = 0,023 ℎ/ ²
Ceramic coating
The ceramic coating has among its advantages the resistance, the facility to sanitize and aesthetics pleasant. Prior to the beginning of the service execution in the project, the tonality and pagination of the coating settlement were defined in order to avoid loss of the ceramic material. Figure 5 presents the ceramic wall cladding in the study studied.
Source: Research (2016).
[image:4.595.58.269.389.592.2] [image:4.595.343.524.551.774.2]Follows RUP calculations of masons and servants to perform the ceramic coating service.
=1 22,5 ℎ
52,64 ² = 0,43 ℎ/ ²
=0,5 22,5 ℎ
52,64 ² = 0,21 ℎ/ ²
Underlayment
The subfloor layer has the function of regularizing the base. For the subfloor, a mortar composed of water, cement and coarse sand was used. Figure 6, below, shows the subfloor slab in the room of one of the apartments of the project under study.
[image:5.595.40.285.252.411.2]Source: Research (2016).
Figure 6. Underlayment Sarrafeamentoin the Venture in Study
Follows calculations of the ORs of masons and servants for the execution of the subfloor service.
=1 9 ℎ
48 ² = 0,19 ℎ/ ²
=0,5 9 ℎ
48 ² = 0,09 ℎ/ ²
[image:5.595.307.558.270.549.2]Paving Ceramics
Figure 7 below shows the execution of the ceramic flooring in one of the apartments of the project under study.
Source: Research (2016).
Figure 7. Laying of Ceramic Floor in the study in study
Follows RUP calculations of masons and servants for the execution of the ceramic paving service.
=1 22,5 ℎ
50,99 ² = 0,44 ℎ/ ²
=0,5 22,5 ℎ
50,99 ² = 0,22 ℎ/ ²
Single Mass
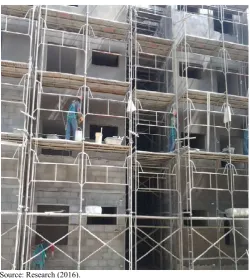
The technique used in the project under study is the conventional single mass for the facade, and this one is characterized by the execution of two stages, the slab and plaster. Figure 8 below shows the execution of the single mass on the facade of one of the buildings of the project under study.
Source: Research (2016).
Figure 8. Execution of the Single Facade Mass in the study under study
Follows RUP calculations of masons and servants to perform the single mass service on the facade.
=15 22,5 ℎ
904 ² = 0,37 ℎ/ ²
=8 22,5 ℎ
904 ² = 0,20 ℎ/ ²
External Paving
[image:5.595.36.284.593.782.2]Source: Research (2016).
Figure 9. Execution of the Interlocking Paving in the Enterprise under Study
Follows calculations of the ORs of masons and servants for the execution of the external paving service.
=15 180 ℎ
12.000 ² = 0,22 ℎ/ ²
=15 180 ℎ
12.000 ² = 0,22 ℎ/ ²
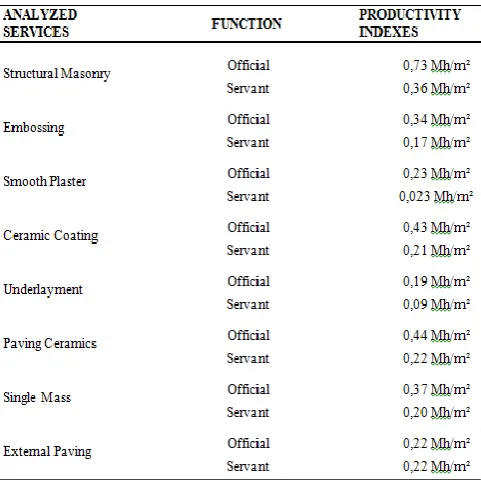
In accordance with the proposed data analysis technique, using AED as a base, with the objective of identifying extraneous values and filtering the data to avoid possible errors in interpretation, the productivity indexes of the study studied were coded and tabulated. Table 1 shows all productivity indexes calculated in the study studied, in order to facilitate the visualization of these indexes.
Table 1. Productivity Indexes for Officials and Employees Obtained in the Enterprise in Study
Source: Research (2016).
Indexes of the studied enterprise x TCPO indexes
[image:6.595.317.554.276.432.2]In order to analyze the data itself, we first present the table comparing labor productivity indexes of the enterprise studied and labor productivity indexes obtained from the PINI book, TCPO, 13th Edition, February 2010. Then, a paragraph was written about each service comparing the values of the productivity indexes of the case study and the TCPO. Following, for a better visualization of the differences between these indexes and, also, to facilitate the understanding of the analysis of these data, column charts were developed. Table 2 below shows the comparison between the RUP of the services selected for officers and servant between the case study and the TCPO. In Table 2, the unit considered for all services is Hh / m².
Table 2. Comparison between the Unitary Ratio of Production of Selected Services for Officers and Servants between the Case
Study and TCPO
Source: Research (2016).
[image:6.595.44.285.552.792.2]of service. For the servant function, the calculated index was 0.023 Hh / m². In TCPO, it was 0.10 Hh / m². It should be taken into account that the proportion of servants for the cus- tomers in TCPO was 1: 4. Already, in the study studied, it was 1:10, and these were used only for cleaning the apartments. For the ceramic coating service, the index obtained through the calculations was 0.43 Hh / m² for the official. The TCPO has, for the same service and function, a value of 0.40Hh / m². For the first time, it is observed a higher productivity of the official presented by the TCPO in comparison with the officer of the study studied, even if this is a minimum difference of 0.03 hours for each square meter. For the servants, the TCPO reveals the index of 0.20 Hh / m². In the work studied, the value obtained was 0.21 Hh / m². It should be noted that, in the work where the research was carried out, the grouting service of the ceramics was not included in the calculation, since this is a service that is in charge of other professionals. In TCPO, this service was included in the calculations.
In the study studied, the official spent 0.19 hours to perform one square meter of underlayment, while in TCPO the officer needed 0.25 hours to perform the same amount of the same service. Thus, it is concluded that the productivity of the first officer quoted was higher. For the person in charge of the work studied, the value was 0.09 Hh / m². In the TCPO, 0.25 Hh / m². That is, the servant productivity in the case study was higher than the productivity considered by TCPO. It should be remembered that in the TCPO the professionals were considered in the ratio of 1: 1, while in the study studied a servant was used for two officers. The productivity index obtained for ceramic paving in the work studied for the official function was 0.44 Hh / m². In TCPO, the index obtained was exactly the same, 0.44 Hh / m². For the servant function, the obtained index was also the same for both the study studied and TCPO. The value obtained was 0.22 Hh / m². The only difference is that it was considered the mortar preparation service for calculating the productivity presented by TCPO. This activity was not included in calculations of labor productivity for the enterprise studied.
Source: Research (2016).
Graph 1. Comparison of the OR of Officials between the Case Study and TCPO
The productivity index obtained for the single mass in the work studied was 0.37 Hh / m² for the official function. In TCPO, the value presented for this same service was 0.5 Hh / m². It is observed, therefore, a higher productivity of the officer in the study studied. The value obtained for the servant was 0.2 Hh / m². In TCPO, this value was 0.5 Hh / m².
Source: Research (2016).
Graph 2. Comparison of the OR of Servants between the Case Study and the TCPO
Therefore, the servant productivity was also higher in the case study compared to the productivity presented by TCPO. For the external paving service the value obtained for the official's productivity was 0.22 Hh / m². In TCPO this value was 0.23 Hh / m². For the servants, the calculated value was 0.22 Hh / m², since, in the work of the case study, servants and officials were used in the proportion of 1: 1. The value presented by TCPO for the servants was 0.46 Hh / m², considering one servant for every two masons. Below, Graphs 1 and 2 with the comparison of the ORs between the Case Study and the TCPO, for officers and servants, respectively.
Considering the presented data and the established discussions, the differences between the productivity indexes of TCPO's workforce and the indexes generated in the case study become evident. These changes led to changes in relation to the schedules for each stage. However, the inequality between labor productivity indexes for the services analyzed did not represent a delay in relation to the pre-established schedule, since the productivity indexes of the studied enterprise were, in the majority, better than the indexes presented by TCPO. It should be emphasized that although the differences between the indexes used for the composition of the schedule do not represent a delay in the implementation period of the enterprise, this fact should not be understood as an advantageous situation, since the main objective in controlling the productivity indexes of workforce is to generate timelines and schedules that are as close as possible to the real.
FINAL REFLECTIONS
have negative consequences in the fulfillment of the schedules, because, in most services, the actual productivity indexes of the enterprise studied were lower than the labor productivity indexes presented by the TCPO. This means that both the officers and the servants of the enterprise studied were able to carry out the activities with a higher productivity than those presented by TCPO.In addition, a database was created with labor productivity indexes. The database created provides an advantage for the construction companies of Vitória da Conquista – Bahia, since these companies now have the labor productivity indexes adequated to the peculiarities of the southwestern region of Bahia.In conclusion, this study introduces new possibilities and stimulate researchers in the subjectivesrefered to productivity in Civil Construction.
REFERENCES
How to prepare works budgets: budgeting tips, case studies, examples. São Paulo: PINI Publishing House, 2006. ACKOFF, R. L. Business Planning. Rio de Janeiro: Technical
and Scientific Books, 1976.
ARAUJO, A. L. M. Indicators of Quality and Productivity As an Instrument for Decision Support in the Vehicle Expedition Process. Belo Horizonte, Vol. 7, No. 02, 1997. AVILA, A. V.; JUNGLES, A. E. Management in Civil
Construction. Chapecó: Argos, 2006.
DANTAS, J. D. F. Manpower Productivity - Case Study: methods and times in the Civil Construction industry in the sub-sector of buildings in the city of João Pessoa-PB. 2011. f. Monograph presented to the Department of Civil and Environmental Engineering of the Federal University of Paraíba to obtain the title of Civil Engineer.
FERNANDES, D. R. A Contribution on the Construction of Indicators and their Importance for Business Management. Revista da FAE, Curitiba, v.7, n.1, 2004. Available at: http://www.fae.edu/publicacoes/pdf/revista_da_fae/fae_v7
_n1/rev_fae_v7_n1_01_dejair.pdf> Accessed on:
September, 2015.
GIL, A. C. Methods and Techniques of Social Research. 6. ed. São Paulo: Atlas, 2008.
GUIMARÃES, P. R. B. StatisticalQuantitativeMethods. 1. ed. Curitiba: IESDE Brasil S.A., 2008.
MATTOS, A. D. Planning and Control of Works. São Paulo: PINI Publishing House, 2010.
PALIARI, J. C. Methodology for the Collection and Analysis of Information on Consumption and Loss of Materials and Components at Construction Site Construction Sites. São Paulo, 1999. Dissertation submitted to the Polytechnic School of the University of São Paulo to obtain a Master's degree in Engineering.
REIS, E. Descriptive Statistics. 7. ed. London: Oxford University Press.
RICHARDSON, R. J. Social Research: methods and techniques. Collaborators: PERES, J.A. S. et al. - 3. ed. - 14. reimpr. - São Paulo: Atlas, 2012.
SOUZA, U. E. L .; AGOPYAN, V. Methodology for the Study of the Productivity of the Manpower in the Service of Forms for the Structure of Concrete Armed. São Paulo: EPUSP, 1996.
SOUZA, U. E. L. How to Increase the Efficiency of the Workforce: manual of productivity management in Construction. São Paulo: PINI Publishing House, 2006. TEIXEIRA, E. B. Data Analysis in Scientific Research:
importance and challenges in organizational studies. Publisher: Unijuí, n.2, 2003.