Purser, Harry and Thomas, Michael S.C. and Snoxall, Sarah and Mareschal,
Denis and Karmiloff-Smith, Annette (2011) Definitions versus categorization:
assessing the development of lexico-semantic knowledge in Williams
syndrome. International Journal of Language and Communication Disorders
46 (3), pp. 361-373. ISSN 1368-2822.
Downloaded from:
Usage Guidelines:
Please refer to usage guidelines at or alternatively
Definitions versus categorisation: Assessing the development of lexico-semantic knowledge in Williams syndrome
Harry R. M. Purser1, Michael S. C. Thomas1, Sarah Snoxall2, Denis Mareschal2 & Annette Karmiloff-Smith1
1
Developmental Neurocognition Lab, Birkbeck, University of London, UK
2
Centre for Brain and Cognitive Development, School of Psychology, Birkbeck College, London, UK
Running head: Lexical knowledge in WS
Word count: 6,000
Address for correspondence:
Dr. Harry Purser
Developmental Neurocognition Lab School of Psychology
Birkbeck College Malet Street
London WC1E 7HX, UK Email: [email protected]
Web: http://www.psyc.bbk.ac.uk/research/DNL/ Tel.: +44 (0)20 7631 6386
Abstract
Williams syndrome (WS) is associated with relatively strong language abilities despite mild
to moderate intellectual disability, particularly when language is indexed by vocabulary. The
aim of the study was twofold: (1) to investigate whether reported lexical anomalies in WS
can be explained with reference to anomalous semantic development; (2) to assess whether
receptive vocabulary skills in WS, a relative strength, are underpinned by commensurate
semantic knowledge. The development of lexical-semantic knowledge was investigated in 45
typically developing (TD) individuals (CA range: 5-10, MA range: 5-13) and 15 individuals
with WS (CA range: 12-50, MA range: 4-17), by means of (a) a categorisation task and (b) a
definitions task, which was expected to make additional metacognitive demands. At younger
ages, the performance level of TD individuals and individuals with WS did not differ on the
definitions task. However, the WS group’s ability to define words fell away from the level
predicted by the TD group at older ages, as more sophisticated definitions were expected. The
results of the categorisation task indicated that individuals with WS had less lexical-semantic
knowledge than expected given their level of receptive vocabulary, although from this lower
level, the knowledge then developed at a similar rate to that found in typical development.
We conclude first that conventional vocabulary measures may overestimate lexical-semantic
knowledge in WS, and second concerns about the metacognitive demands of the definitions
task when used with atypical populations may be well founded (cf. Benelli et al., 1988).
Abbreviations: Williams syndrome (WS), typically developing (TD), chronological age (CA),
Introduction
The uneven cognitive profiles presented by various developmental disorders are often used to
investigate different aspects of cognition and to inform theories of cognitive development.
Williams syndrome (WS) is a rare neurodevelopmental disorder, with a prevalence estimated
to be about 1 in 20,000 (Morris, Dempsey, Leonard, Dilts & Blackburn, 1988), resulting from
a microdeletion of more than 25 genes from one copy of chromosome 7 (Ewart et al., 1993,
see Donnai & Karmiloff-Smith, 2000). The disorder is characterised by an uneven cognitive
profile: despite particular difficulties with visuospatial and numerical cognition, language
abilities appear less impaired in individuals with WS (Ansari, Donlan, Thomas, Ewing, Peen
& Karmiloff-Smith, 2003; Donnai & Karmiloff-Smith, 2000; Farran & Jarrold, 2003;
Howlin, Davies & Udwin, 1998). Moreover, some researchers have claimed that language is
‘selectively preserved’ in WS (e.g. Bellugi et al., 1990; Bellugi, Lichtenberger, Jones, Lai &
St. George, 2000), and have used the apparent disparity between language and other areas of
cognitive ability as evidence that language develops independently (as a module) from those
other cognitive abilities (e.g. Anderson, 1998; Bellugi, Marks, Birhle & Sabo, 1988; Rossen,
Bihrle, Klima, Bellugi, & Jones, 1996). Although such claims would clearly be of great
theoretical importance if correct, their validity has been questioned by other researchers.
In a theoretical objection, Thomas and colleagues (Thomas, Dockrell, Messer, Parmigiani,
Ansari & Karmiloff-Smith, 2006) pointed out that the logic of such claims is based on the
assumption that deficits in the current state of a cognitive system directly reflect the
conditions of the initial state, ignoring the role of development in determining the current
state (see Thomas, Purser & Richardson, in press, for discussion). An empirical objection to
claims of a language advantage in WS was made by Brock (2007), who reviewed existing
pragmatics, or syntax are better than predicted by nonverbal measures. An alternative (and
perhaps more conservative) view, then, is that the cognitive profile associated with WS
reflects the outcome of atypical development, with multiple interacting constraints, that has
stronger effects on some cognitive abilities and weaker effects on others (Karmiloff-Smith,
1998). Nevertheless, although delayed, language development in WS shows many similarities
to typical language development, albeit with some noted exceptions in early precursors
(Thomas, 2008; Thomas & Karmiloff-Smith, 2005).
Although younger children with WS have receptive vocabularies in line with their verbal
mental age (Thal, Bates, & Bellugi, 1989; Volterra, Caselli, Capirci, Tonucci, & Vicari,
2003), this area of language appears to be a relative strength for older children and adults
with the disorder (e.g. Brock, Jarrold, Farran, Laws, & Riby, 2007; Rossen et al., 1996).
Indeed, one notable feature of vocabulary in WS is the reported prevalence of rare or
low-frequency words in discourse (Bellugi, Wang, & Jernigan, 1994; Udwin & Dennis, 1995).
These unusual choices of words can contain unnecessary, or even inappropriate, contextual
details (Rossen et al., 1996), leading the speech of individuals with WS to be described as
displaying ‘cocktail party syndrome’, referring to the tendency to talk at length with only
superficial understanding (Bellugi, Birhle, Neville, Jernigan, & Doherty, 1992).
This phenomenon has led to the suggestion that the lexicon is atypical in WS. For example,
Rossen et al. (1996) investigated how individuals with WS interpret homonyms, such as
‘bank’. It was found that the 10- to 18-year-old participants with WS interpreted homonyms
with the secondary meaning (‘river’) as often as the first meaning (‘place that stores money’)
and more often than both individuals with Down syndrome (DS), matched on both mental
age (MA) and chronological age (CA), and typically-developing 10-year-olds. Rossen and
failing to integrate contextual information in the lexicon. Temple, Almazan, and Sherwood
(2002) have also argued for an atypical lexicon in WS, drawing evidence from a word-picture
matching task adapted from the British Picture Vocabulary Scale (BPVS: Dunn, Dunn,
Whetton, & Burley, 1997), but involving fine-grained semantically-related distractors.
Compared to a typically developing control group matched on MA, their participants with
WS performed poorly, leading Temple and colleagues to conclude that individuals with WS
have difficulties storing or activating semantic information in the lexicon.
However, many studies have cast doubt on suggestions of atypical lexical structure in WS. In
verbal short-term memory tasks, individuals with WS have demonstrated similar semantic
effects to control groups matched on receptive vocabulary and digit span, with superior recall
for concrete over abstract words (Laing, Grant, Thomas, Parmigiani, Ewing, &
Karmiloff-Smith, 2005). Moreover, Tyler and colleagues (Tyler, Karmiloff-Karmiloff-Smith, Voice, Stevens,
Grant, Udwin, Davies, & Howlin, 1997) found normal sensitivity to semantic priming in a
WS group: responses were quicker to words preceded by either a functionally-related word or
a category-related word than when preceded by an unrelated word. Furthermore, Bellugi and
colleagues found no differences between a WS group and an age- and IQ-matched group with
DS on a word definition task (Bellugi et al., 1990).
Thomas and colleagues investigated possible atypical dynamics in lexical access in WS
(Thomas et al., 2006), using a speeded picture-naming task in which frequency and semantic
category were manipulated as implicit variables. Although the participants with WS were
slower and less accurate than a control group matched on receptive vocabulary, the frequency
and semantic category effects shown by the participants with WS were found to be in line
with controls, indicating normal encoding of frequency in the WS lexicon and a similar
Further evidence has been gained from semantic fluency tasks. Despite Bellugi and
colleagues’ widely-cited finding that a WS group produced more atypical responses in a
semantic fluency task than a DS group when the semantic category was animals (Bellugi et
al., 1990), the authors did not present any statistical analyses of the typicality of response.
Subsequent investigations of semantic fluency in WS have largely failed to find group
differences in typicality or frequency of verbal output (e.g. Jarrold, Hartley, Phillips, &
Baddeley, 2000; Johnson & Carey, 1998; but see Temple et al., 2002). However, the
possibility remains that metacognitive demands in such tasks, such as retrieval strategies and
evaluation of task completion, might cloud our view of the underlying structure of the WS
lexicon; individuals with WS might reveal an atypical lexicon in spontaneous speech despite
not doing so in semantic fluency tasks.
Recently, Stojanovik and Ewijk (2008) pointed out that evidence from spontaneous speech is
also problematic because conversational context is unconstrained. Some people with WS
have been reported to hold specialised interests (Udwin, Howlin, & Davies, 1996),
presumably with attendant specialist vocabulary that may emerge in constrained spontaneous
speech (i.e., speech directed at topics of interest). Therefore, Stojanovik and Ewijk (2008)
measured vocabulary diversity in a topic-constrained spontaneous speech task, with a WS
group and control groups matched on receptive language and CA. The WS group produced
neither more varied words nor more atypical words than the control groups, but, in fact,
produced fewer of the lowest frequency words than controls.
There are hints from existing developmental studies indicating that lexical-semantic
knowledge may be acquired atypically in WS. Stevens and Karmiloff-Smith (1997) argued
that, when learning new words, children with WS were subject to the fast mapping and
Mervis and Bertrand (1997) found that children with WS learn words less referentially than
typically-developing children, and that the stage of rapid vocabulary growth is less connected
to semantic categorisation ability than it is in typical development. While Temple and
colleagues (Temple et al., 2002) argue that such studies provide evidence that individuals
with WS have an atypical lexical structure from the start of development, this need not be the
case. For example, it is possible that atypical early learning processes have an impact on the
type of lexical-semantic information encoded, with the lexicon structured normally. The
former view attributes the use of unusual words in WS to a lexicon with atypical dynamics,
the latter as a consequence of atypical learning processes.
Overall, our ability to assess the developing structure of the WS lexicon has been
compromised by concerns about the limitations of the tasks used to assess it. Tyler and
colleagues (Tyler et al., 1997) suggest that the lexical-semantic tasks that are difficult for
participants with WS are often off-line tests that involve confounding task-demands. For
example, while performance on semantic fluency tests might reflect the organisation of
semantic information, it also requires retrieval strategies, which make metacognitive
demands. In addition, although asking participants to define words yields information about
semantic representations without requiring the participant to retrieve a name, it requires not
only knowledge of the word’s meaning, but also an understanding of what a “definition” is
and how it is normally given; specifically, that it is a test of knowledge of the salient and
diagnostic features of a category, to be listed in descending order of salience and
diagnosticity. Poor performance on a definitions task, then, may arise from lexical-semantic
problems but also from metacognitive demands (Benelli, Arcuri, & Marchesini, 1988). Thus,
colleagues’ study (Bellugi et al., 1988) may have done so for metacognitive reasons, rather
than for lexical-semantic ones.
The aim of the current study was to investigate whether there might be less information in the
WS lexicon than suggested by vocabulary level. This is important for two reasons. First, it is
important so that caregivers or teachers can interact with people with WS at a level
appropriate to their intellectual ability, rather than the ability superficially suggested by their
vocabulary. Second, it is important in order that theorists may accurately interpret what the
presence of advanced vocabulary per se means for the developmental dissociation of
cognitive abilities. Two paradigms were used to assess knowledge of the same semantic
domain, with both participants with WS and typically developing controls. The first
examined lexical-semantic processes with a definitions test; the second was a categorisation
task in which participants were asked to sort objects into semantic categories. While the
definitions task was expected to suffer from metacognitive confounds, the categorisation task
was expected to minimise such confounding demands. However, it was necessary to conduct
the definitions test in order to ascertain whether or not metacognitive concerns about the test
were justified. If there were a convergence of performance on the two tests, it would suggest
that the definitions task represents a valid measure of lexical-semantic knowledge.
Both paradigms focused on the same knowledge domain, animals, to facilitate cross-task
comparison. Clearly, it is important to test with a domain in which individuals with WS are
well versed, otherwise poor performance could be attributed to poor knowledge. Focusing on
the domain of animals should maximise the chances of success at the tasks for the
participants with WS, because it has been shown that individuals with WS as young as 10
have unimpaired basic knowledge in this area compared to verbal MA matched controls
Because WS is a developmental disorder, the data were analysed within a developmental
framework. A developmental trajectories approach was adopted (Thomas, Annaz, Ansari,
Scerif, Jarrold & Karmiloff-Smith, 2009). Functions of task performance and age are
constructed, which allow developmental change to be compared across typically- and
atypically-developing groups. Although longitudinal methods would ideally be used to
investigate developmental change, a first approximation of developmental trajectories can
derive from cross-sectional studies; these initial trajectories may subsequently be validated by
longitudinal investigations. One benefit of employing trajectories that link performance on a
task to a mental age measure is that they can be used to examine whether that performance is
in line with the developmental state of other measures of cognitive ability, thereby assessing
developmental relations within the atypical cognitive system. Although it is to be expected
that people with WS will not perform at a CA-appropriate level, it may be that verbal
mental-age normalises performance, which would show that typical developmental relations exist in
the language systems of individuals with WS.
Method
Participants
There were two groups: 45 typically developing (TD) individuals and 15 individuals with a
clinical diagnosis of Williams syndrome (WS) confirmed by the fluorescence in situ
hybridisation (FISH) test. In a preliminary test session, the WS group was assessed on the
British Picture Vocabulary Scale II (BPVS; Dunn, Dunn, Whetton, & Burley, 1997), a
measure of receptive vocabulary. The WS group had a mean chronological age of 21;5 years
(range = 12;0-44;11) and a mean vocabulary mental age of 9;7 years (range = 4;1-17;0). The
vocabulary age for 3 older participants was at ceiling (17;0). Taking into account this ceiling
standardised vocabulary test indicated a disparity between chronological and vocabulary age
of 5 years and 11 months (t(14) = 5.521, p<.001). Receptive vocabulary was therefore clearly
delayed in this group. The TD group had a mean chronological age of 7;6 years (range =
5;1-10;1) and a mean vocabulary mental age of 8;1 years (range = 5;1-13;1). Each participant
consented to take part on the day of testing.
Materials
Definitions test
Using the Oxford Psycholinguistic Database (Wilson, 1988), 21 animals were selected for the
participants to define, varying in frequency. A mixture of basic and superordinate category
levels were selected. The animals chosen were bird, fish, cat, lion, bee, elephant, ant,
tortoise, spider, dolphin, kangaroo, crab, penguin, dinosaur, bat, beetle, whale, mammal,
carnivore, reptile and marsupial.
Categorisations Test
There were 20 categorisation questions in total. There were two rationales behind the choice
of probe and animal grouping:
1. To investigate participants’ responses to probes for properties not deducible from the
available perceptual features
2. To examine the effect of perceptually similar distractors on these probes
Table 1 lists the categorisation questions.
Toy animals were used as stimuli (see Appendix 1 for the stimulus toys used for each
categorisation question). These were kept covered during the definitions test so that
participants could not base their definitions on the visual features of the toys.
Procedure
The definitions test was administered before the categorisation test.
Definitions test
Participants were asked, ‘What’s an x? Or can you tell me what an x is?’ If necessary,
participants were also asked, ‘if you had to make another child understand what an x is, who
did not know what it was, what would you say to help him?’ After the initial response,
participants were prompted twice further for each animal with the phrase ‘Is there anything
else you can tell me about x?’ The animals to be defined were presented in the same order for
all participants. The superordinate definitions, such as ‘mammal’, ‘reptile or ‘marsupial’,
were requested after the basic animal definitions, in order to avoid them priming participants’
responses.
The dependent measures were the number of correct features, and the number of salient and
diagnostic features, given for each animal. Salient and diagnostic features were defined as
those that allowed animals to be distinguished from each other or appear central to common
definitions. This definition is necessarily subjective, because relevance of particular features
for a particular goal (in this case, defining animals) is a matter of degree (Sperber & Wilson,
1987; Wilson & Sperber, 2004). To illustrate our use of these terms, an example of a feature
that is both salient and diagnostic is stripes for a zebra. The fact that a zebra has four legs is
salient but clearly not diagnostic. The fact that a frog breathes through its skin while
salient for our sample). In contrast, thematically or episodically related information would not
be considered either salient or diagnostic (e.g. “I saw one on TV last night”, “It’s my
brother’s favourite animal”).
Categorisations test
Participants were asked to group the animals according to the question asked. As a practice
trial, a group of animals was placed on the table and the participants were asked to sort out
which animals might be found in the circus. They were laid out in an order that did not
correspond to the category question. As the animals were put out, the experimenter also
named them. The category questions were administered in the same order for each
participant. The dependent measure was the number of animals correctly placed within the
probed category on each trial.
Results
Each of the following analyses is a repeated-measures ANCOVA with group as the
between-subjects factor. The ANCOVA model included interaction terms between the verbal mental
age (VMA) covariate and the between-subjects factor, to explore whether performance
developed at a different rate in each group with respect to vocabulary ability (Thomas et al.,
2009). The data were analysed with respect to VMA, rather than chronological age (CA), for
two reasons. First, many studies have already established that lexico-semantic knowledge is
not at CA-appropriate level in WS (e.g. Clahsen et al., 2004; Temple et al., 2002). Our
participants with WS similarly demonstrated a delay in their receptive vocabulary ability
compared to CA of around 6 years. Second, the key aim of the study is to investigate
with vocabulary. It should be noted that three of the participants with WS were at ceiling
(17;0 years) on the BPVS.
Definitions task
Correct features
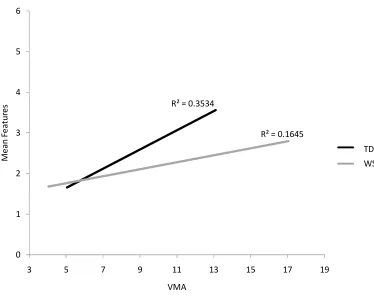
There was a reliable positive relationship between VMA and the number of correct features
given, F(1,56) = 21.775, p < .001, ηp2 = .280, but no significant main effect of group, F(1,56)
= 0.449, p = .505, ηp2 = .008. There was, however, a reliable interaction of group and VMA,
F(1,56) = 4.753, p < .05, ηp2 = .078 (see Figure 1). Analysing the groups separately revealed
that the number of correct features given reliably increased with VMA for the TD group,
F(1,43) = 23.497, p < .001, ηp2 = .353, but not the WS group, F(1,13) = 2.559, p = .134, ηp2 =
.164. At younger VMA, the TD and WS groups performed similarly, but there was evidence
of divergence with faster development in the TD group thereafter. Overall, at higher
vocabulary levels, definitions provided by individuals with WS were poorer than those of the
TD controls.
======== insert Figure 1 about here =========
Salient and diagnostic features
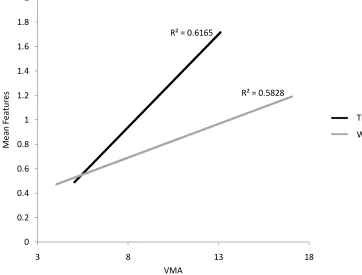
The number of salient and diagnostic features reliably increased with VMA, F(1,56) =
78.982, p < .001, ηp2 = .585, but there was no significant main effect of group, F(1,56) =
1.050, p = .310, ηp2 = .018. However, performance improved with VMA faster in the TD
group than in the WS group, F(1,56) = 17.232, p < .001, ηp2 = .235 (see Figure 2). Again, at
lower vocabulary abilities the performance of the groups overlapped but the trajectories then
======== insert Figure 2 about here =========
Analysis of Errors
An error was defined as an incorrect feature offered for a given animal, and did not include
omissions or irrelevant comments. The TD group’s mean number of errors for each trial was
0.34 (SD = 0.21), the WS group’s was 0.38 (SD = 0.21). Although the number of errors
reliably decreased with increasing VMA, F(1,56) = 6.456, p < .05, ηp2 = .103, there was no
significant main effect of group, F(1,56) < 0.001, p = .997, ηp2 < .001, nor interaction of
group and VMA, F(1,56) = 0.794, p = .377, ηp2 = .014. There was no fixed number of
responses in this task, so the errors would not be expected to mirror the correct responses.
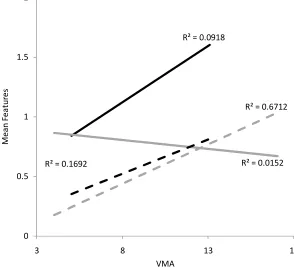
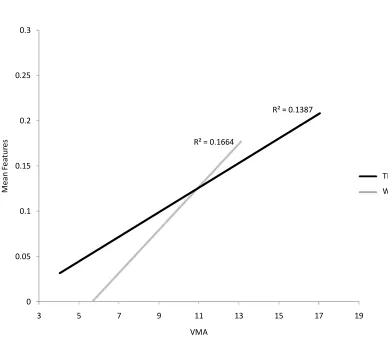
Feature analysis
The type of features produced was examined in more detail. Perceptual features were defined
as those that could be known by recalling a mental image of a given animal (e.g., has a beak,
has big ears); abstract features were those that could not be known from imagery of the
animal alone (e.g., is poisonous, lives underground).
Overall, more perceptual features were given than abstract ones, F(1,58) = 17.247, p < .001,
ηp2 = .229. Although there was no reliable interaction of VMA and feature type for the TD
group, F(1,43) = 0.476, p = .494, ηp2 = .011, there was for the WS group, F(1,13) = 6.935, p <
.05, ηp2 = .348 (see Figure 3). While the WS group produced more abstract features with
increasing VMA, F(1,13) = 26.535, p < .001, ηp2 = .671, there was no significant change in
the number of perceptual features, F(1,13) = 0.200, p = .662, ηp2 = .015. The overall
absence of relevant perceptual detail rather than the properties of the animal (e.g., how it
behaves, where it lives).
======== insert Figure 3 about here =========
Definitions task summary
Performance on the definitions task developed more slowly with VMA for the WS group than
the TD group, measured by both the number of correct features and the number of salient and
diagnostic features. However, this performance difference was not associated with any
developmental group difference in errors. This implies that less semantic information is being
acquired by the WS group, despite increasing vocabulary, or at least that less semantic
information was elicited by this particular task.
Categorisation task
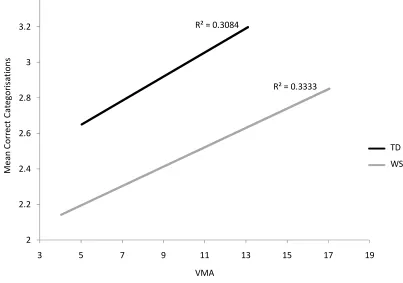
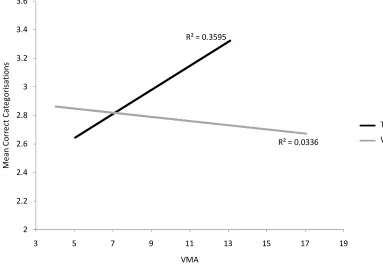
Correct categorisations
Performance on this measure improved reliably with VMA, F(1,56) = 26.255, p < .001, ηp2 =
.319, and the TD group scored significantly better than the WS group, F(1,56) = 10.800, p <
.01, ηp2 = .162. However, there was no reliable interaction of VMA and group, F(1,56) =
0.311, p = .579, ηp2 = .006 (see Figure 4). The TD group performed better than the WS group
at all VMA levels, but both groups developed at the same rate, with no divergence of the
trajectories.
======== insert Figure 4 about here =========
Incorrect categorisations
Incorrect categorisations were defined as inclusion errors, i.e. animals incorrectly placed
each trial was 0.61 (SD = 0.29), the WS group’s was 0.73 (SD = 0.42). The WS group made
more of these errors than the TD group, F(1,56) = 5.460, p < .05, ηp2 = .089, and there was a
significant interaction of group and VMA, F(1,56) = 16.419, p < .001, ηp2 = .227. While there
was no reliable trend with VMA for such errors in the WS group, F(1,13) = 0.507, p = .489,
ηp2 = .038, the TD group showed a decrease in such errors with increasing VMA, F(1,43) =
33.074, p < .001, ηp2 = .435. Therefore, the TD group tended to miscategorise less with
increasing VMA, while the WS group retained the same level of errors across the VMA
range.
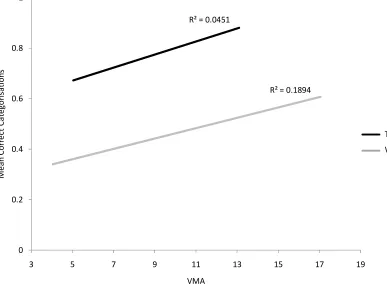
Perceptual distractors
It was not possible to perform a meaningful feature analysis (as in the definitions task
analysis), because no perceptual features were probed, as such. This is because perceptual
information was readily available in the animal toys themselves. Instead, abstract features
were probed, such as “Which live in a nest?” (See Appendix 1 for probes). However, it was
still possible to investigate performance on trials that involved perceptual distractors (e.g.
“Which are birds?”, where the response set was eagle, swan, penguin, dragonfly [with
wings], sea lion, horse, bat [also with wings]). The TD group performed significantly better
than the WS group on such trials, F(1,56) = 4.399, p < .05, ηp2 = .073, and there was a reliable
interaction of group and VMA, F(1,56) = 15.017, p < .001, ηp2 = .211: while the TD group’s
performance improved reliably with increasing VMA, F(1,43) = 24.137, p < .001, ηp2 = .360,
the WS group’s did not, F(1,13) = 0.451, p = .513, ηp2 = .034 (see Figure 5).
======== insert Figure 5 about here =========
For their level of receptive vocabulary, the TD group was better able to correctly categorise
animals than the WS group. In addition, the WS group tended to make more errors than the
TD group. The groups’ ability to categorise correctly developed at a similar rate. However, as
measured by performance on trials that involved perceptual distractors, abstract knowledge
developed more slowly in the WS group than predicted by receptive vocabulary.
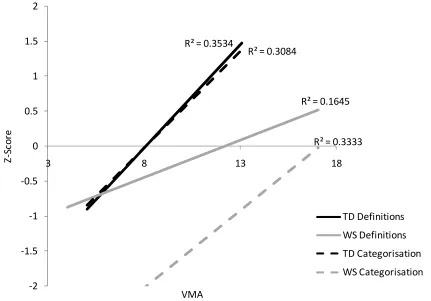
Cross-task comparison
In order to compare the performance of the WS group across tasks, it was necessary to make
the measures used in each task comparable. One way to achieve this is to standardise the WS
group’s performance on the range of variability of the TD group (see Jarrold & Brock, 2004;
Thomas, Annaz, Ansari, Scerif, Jarrold & Karmiloff-Smith, 2009). This standardisation
generates Z-scores for each participant with WS, showing how far away performance is from
that predicted by VMA, if the participant had been on the TD trajectory.
In order to directly compare performance on the definitions task with that on the
categorisation task, participants’ mean scores for each task were converted into Z-scores.
Each participant’s performance was standardised with respect to the distribution of scores for
the typically developing children in each task. Figure 6 shows cross-task trajectories based on
these Z-scores. Simple effects of task were independent of the covariate of VMA, because
the covariate is a between-subjects factor, whereas task is a repeated-measures factor (see the
following link for discussion of the use of repeated measures in ANCOVA:
http://www.psyc.bbk.ac.uk/research/DNL/stats/Repeated_Measures_ANCOVA.html).
Therefore, these results are reported from an analysis that excludes the covariate (Degrees of
freedom therefore differ between simple task effects and group effects or interactions). The
TD group showed very similar relationships between each task and VMA, F(1,43) = 0.054, p
mean Z-score for each task is zero by definition). The WS group’s performance on the
categorisation task was reliably worse than that their performance on the definitions task,
F(1,14) = 13.109, p < .01, ηp2 = .484, though there was no significant difference in the
gradients of the trajectories, F(1,13) = 1.386, p = .260, ηp2 = .096. Figure 6 also captures the
divergence of the WS trajectory from the TD trajectory with increasing VMA, while the
category trajectory runs parallel.
======== insert Figure 6 about here =========
As a final comparison between the definitions and categorisation tasks, performance with
‘elephant’ was examined in each, using the features probed in the categorisation task: ‘where
it lives’, ‘what it eats’, ‘source of ivory’, ‘is a mammal’, and ‘lives for a long time’.
‘Elephant’ was chosen for this analysis because it had the highest number of features probed
in the categorisation task that also appeared in the definitions task. Figure 7 demonstrates
that the features related to elephants that were probed in the categorisation task were more
often successfully responded to in this task than they were produced in the definitions task,
F(1,58) = 200.192, p < .001, ηp2 = .775. While there was no reliable group difference in how
often these features were produced in the definitions task, F(1,58) = 1.697, p = .198, ηp2 =
.028, the TD group successfully categorised the elephant on the basis of these features
significantly more often than the WS group did, F(1,58) = 18.253, p < .001, ηp2 = .239 (see
Figures 7a and 7b).
======== insert Figures 7a and 7b about here =========
The aim of the study was to investigate the relationship between lexico-semantic knowledge
and vocabulary in WS compared to a TD control group. Two tasks were used to measure
lexico-semantic knowledge: a definitions task, which was expected to make additional
metacognitive demands, and a categorisation task, which was considered a purer test of
lexico-semantic knowledge. The results indicated that the WS group’s performance on the
definitions task began at a level commensurate with VMA, but diverged from that of the
typically developing group. The WS group’s performance on the categorisation task
developed at a similar rate to that of the typically developing participants, but was markedly
poorer on average than predicted by VMA. This surprising pattern of results indicates that
individuals with WS have less lexico-semantic knowledge than expected given their level of
receptive vocabulary, although this knowledge appears to develop in step with vocabulary at
this lower level. These results also suggest that metacognitive concerns about the definitions
task may be well-founded, a point to which we return below.
The WS group’s disparity of lexico-semantic knowledge and receptive vocabulary may be
due, at least in part, to poorly-delineated semantic categories: the WS group made more
categorisation errors than the TD group, with the effects of VMA accounted for. Moreover,
while the TD group made fewer such errors with increasing VMA, presumably reflecting
increasingly well-defined category boundaries, no such trend was evident for the WS group.
These results are in line with a previous finding that individuals with WS acquire additional
lexico-semantic information throughout development, without accompanying conceptual
change. Johnson and Carey (1998) suggested that cocktail party syndrome in WS results from
adequate ‘enrichment’ learning processes in the absence of analytic and metacognitive skills.
Udwin and Yule (1990) had found that about a third of a sample of 43 children with WS met
lacks communicative content, along with frequent use of conversational fillers and
stereotypical social phrases. Johnson and Carey predicted a dissociation between general
knowledge of animals (e.g., number of legs, what it eats, where it lives) and core
folk-biological concepts (e.g., the determinants of species identity, the notion that humans are one
animal of many). They tested intuitive biological knowledge in WS and two TD groups, one
matched on VMA and the other a non-matched group of 6-year-olds. The WS group
performed similarly to the VMA-matched group on a test battery for biological general
knowledge, but performed significantly worse on a test battery for folk-biological concepts
thought to be acquired between the ages of six and twelve, and at a similar level to the
6-year-olds. The authors concluded that the WS group had not acquired folk-biological
concepts appropriate for VMA, even though the requisite general knowledge was probably in
place1.
A recent study of comprehension of non-literal similarity provides a parallel with Johnson
and Carey’s results. Thomas et al. (submitted) administered a simple picture-based
categorisation task to individuals with WS and children between 5 and 11. The results
indicated that the individuals with WS understood both perceptual similarity across category
boundaries (e.g., an orange is perceptually similar to the Sun) and also functional similarity
across category boundaries (e.g., an oven and the Sun both heat things up). However, in
contrast to the TD group, the WS group did not develop a preference for functional similarity
over perceptual similarity in comparison judgements, consistent with the notion that
individuals with WS do not develop a conceptual structure that flexibly utilises functional
relations, despite showing clear evidence that functional relations themselves have been
encoded. This is consistent with Johnson and Carey’s finding that the WS group
categories but not evidence of functionally-organised categories which would be necessary to
make similarity judgements. Taken together with the results of the current study, it seems
reasonable to suggest that individuals with WS have poorer organisation of knowledge than
predicted by the amount of knowledge they have accrued.
One puzzling aspect of our results is that in the definitions task, while both groups gave more
abstract features with increasing VMA, and the TD group also produced more perceptual
features, the WS group demonstrated no such increase in production of perceptual features.
This appears to be because the youngest participants were particularly unlikely to produce
abstract features, rather than because the older children were particularly likely to do so. In
the categorisation task, the WS group performed more poorly than the TD group on
categorisations that involved perceptual distractors (e.g. “Which are birds?” with dragonfly
and bat among the distractors). Furthermore, while the TD group’s performance on such trials
improved with VMA, the WS group showed no mental-age-related trend. This suggests that
the participants with WS found perceptual features particularly salient, which may go some
way to explaining why abstract features were offered less often by younger participants with
WS in the definitions task.
In order to further compare performance across tasks, additional analyses were conducted,
focusing on one of the animals probed in the study, elephant, on a feature-by-feature basis.
The features of ‘elephant’ probed in the categorisation tasks were ‘where it lives’, ‘what it
eats’, ‘source of ivory’, ‘is a mammal’, and ‘lives for a long time’; these same features were
produced by participants in the definitions task. These salient and diagnostic features were
very rarely offered in the definitions task, despite the fact that such knowledge was often
demonstrated in the categorisation task. This pattern of results reflects the relative
In order to perform well on a definitions task, the participant must list features in descending
order of salience and diagnosticity. However, the participant must also understand that this is
what is required for task success. It is not clear that younger typically developing children or
individuals with developmental disorders will understand this, or would even be helped by
careful explanation, given the metacognitive nature of understanding and monitoring task
success. While there was no group difference in how often these features were produced in
the definitions task, the TD group successfully categorised the elephant on the basis of these
features more often than the WS group did. This pattern of results repeats the message from
the main analyses: the participants with WS demonstrated lexico-semantic knowledge that
was poorer than predicted by receptive vocabulary, but developed at a similar rate to that
observed in typical development.
Another, more tentative, way of comparing performance across tasks is to contrast the salient
and diagnostic features given in the definitions task with correct categorisations, given that
categorisations were always made on the basis of salient and diagnostic features. Although, at
lower vocabulary abilities, the performance of the groups was similar, the performance of the
TD group developed more quickly than that of the WS group. In contrast, the WS group were
stably poorer than the TD group across the entire developmental trajectory in the
categorisation task. Whether comparing the categorisation task to the definitions task in terms
of total correct features or salient and diagnostic ones, different patterns of performance were
seen across the two tasks, indicating that the tasks were measuring different abilities,
consistent with the suggestion that asking participants to produce definitions assesses
metacognitive skills in addition to lexico-semantic knowledge (cf. Benelli et al., 1988).
Finally, the findings of the current study are in line with those of Temple and colleagues
performed worse at a version of the BPVS with more semantic distractors than typically
developing controls matched on MA. Temple and colleagues suggested that the standard
version of the BPVS may overestimate lexico-semantic knowledge in WS because, through
its forced choice design (i.e., which one of four pictures goes with the named word),
decisions can be made without possessing full knowledge of the word meaning. The results
of the current study support this conclusion. In the absence of some ‘gold standard’ measure
of language ability, it is not possible to definitively state whether lexico-semantic knowledge
is worse than other areas of language in WS. It is possible that lexico-semantics only appears
to be out of step with vocabulary in WS because the BPVS is a poor measure of vocabulary
for some populations of individuals with learning difficulties. As with many standardised
tests, the BPVS is far from ‘pure’, but involves many non-central task demands, such as
holding the task aim in mind, inhibiting responding on the basis of simply liking a picture,
and the ability to generalise from tokens to types. The possible limitations of the BPVS for
atypical populations point to the same conclusion as the current data. Assertions of
exceptional lexical knowledge in Williams syndrome should be treated with caution.
Acknowledgements
This research was supported by European Commission grant NEST-029088(ANALOGY),
References
Anderson, M. (1998). Mental retardation general intelligence and modularity. Learning and
individual differences, 10, 159-178.
Ansari, D., Donlan, C., Thomas, M. S. C., Ewing, S. A., Peen, T., & Karmiloff-Smith, A.
(2003). What makes counting count? Verbal and visuo-spatial contributions to typical
and atypical number development. Journal of Experimental Child Psychology, 85,
50-62.
Bellugi, U., Bihrle, A., Jernigan, T., Trauner, D., & Doherty, S. (1990). Neuropsychological,
neurological, and neuroanatomical profile of Williams syndrome. American Journal of
Medical Genetics Supplement, 6, 115–125.
Bellugi, U., Bihrle, A., Neville, H., Jernigan, T., & Doherty, S. (1992). Language,
cognition, and brain organization in a neurodevelopmental disorder. In M. Gunnar &
C. Nelson (Eds.), Developmental Behavioral Neuroscience (pp. 201-232). Hillsdale,
NJ: Lawrence Erlbaum Associates.
Bellugi, U., Lichtenberger, L., Jones, W., Lai, Z., & St. George, M. (2000). The
neurocognitive profile of Williams syndrome: A complex pattern of strengths and
weaknesses. Journal of Cognitive Neuroscience, 12:S, 7-29.
Bellugi, U., Marks, S., Bihrle, A., & Sabo, H. (1988). Dissociation between language and
cognitive function in Williams Syndrome. In D. Bishop & K. Mogford (Eds.),
Language development in exceptional circumstances. Edinburgh, U.K.: Churchill
Livingstone.
Bellugi, U., Wang, P. P., & Jernigan, T. L. (1994). Williams syndrome: An unusual
neuropsychological profile. In S. Broman & J. Grafman (Eds.), Atypical cognitive
deficits in developmental disorders: Implications for brain function. Hillsdale, NJ:
Benelli, B., Arcuri, L., & Marchesini, G. (1988) Cognitive and linguistic factors in
the development of word definitions. Journal of Child Language, 15, 619-635.
Brock, J. (2007). Language abilities in Williams syndrome: a critical review. Development
and Psychopathology, 19, 97-127.
Brock, J., Jarrold, C., Farran, E. K., Laws, G., & Riby, D. (2007). Do children with Williams
syndrome have really good vocabulary knowledge? Methods for comparing cognitive
and linguistic abilities in developmental disorders. Clinical Linguistics & Phonetics, 21,
673-688.
Clahsen, H., Ring, M. & Temple, C. (2004). Lexical and morphological skills in
English-speaking children with Williams Syndrome. In S. Bartke & J. Siegmueller (Eds.),
Williams Syndrome across Languages (pp.221-244). Benjamins: Amsterdam.
Donnai, D., & Karmiloff-Smith, A. (2000). Williams syndrome: From genotype through to
the cognitive phenotype. American Journal of Medical Genetics, 97, 164-171.
Dunn, L. M., Dunn, L. M., Whetton, C., & Burley, J. (1997). British Picture Vocabulary
Scale II. Windsor, U.K.: NFER-Nelson.
Ewart, A. K., Morris, C. A., Atkinson, D., Jin, W., Sternes. K., Spallone. P., Stock, A. D.,
Leppert, M., & Keating, M. T. (1993). Hemizygosity at the elastin locus in an
developmental disorder, Williams Syndrome. Nature Genetics, 5, 11-16.
Farran, E. K., & Jarrold, C. (2003). Visuo-spatial cognition in Williams syndrome:
Reviewing and accounting for strengths and weaknesses in performance.
Howlin, P., Davies, M., & Udwin, O. (1998). Cognitive functioning in adults with Williams
syndrome. Journal of Child Psychology and Psychiatry, 39, 183-189.
Jarrold, C., & Brock, J. (2004). To match or not to match? Methodological issues in
autism-related research. Journal of Autism and Developmental Disorders, 34, 81-86.
Jarrold, C., Hartley, S. J., Phillips, C., & Baddeley, A. D. (2000) Word fluency in Williams
syndrome: Evidence for unusual semantic organization. Cognitive Neuropsychiatry, 5,
293-318.
Johnson, S. C. & Carey, S. (1998). Knowledge enrichment and conceptual change in
folkbiology: evidence from Williams syndrome. Cognitive Psychology, 37, 156-200.
Karmiloff-Smith, A. (1998) Development itself is the key to understanding developmental
disorders. Trends in Cognitive Sciences, 2, 389-398.
Laing, E., Grant, J., Thomas, M., Parmigiani, C., Ewing, S., & Karmiloff-Smith, A. (2005).
Love is...an abstract word: The influence of lexical semantics on verbal short-term
memory in Williams syndrome. Cortex, 41, 169-179.
Mervis, C., & Bertrand, J. (1997). Developmental relations between cognition and language:
Evidence from Williams syndrome. In L. B. Adamson & M. A. Romski
(Eds.), Research on communication and language disorders: Contribution to theories
of language development (pp.75-106). New York: Brookes.
Morris, C. A., Dempsey, S. A., Leonard, C. O., Dilts, C., & Blackburn, B. L. (1988). Natural
history of Williams syndrome: Physical characteristics. Journal of Paediatric
Rossen, M., Klima, E. S., Bellugi, U., Bihrle, A., & Jones, W. (1996). Interaction between
language and cognition: Evidence from Williams syndrome. In J. H. Beitchman, N. J.
Cohen, M. M. Konstantareas & R. Tannock, Language learning and behavior (pp.
367-92). New York: Cambridge University Press.
Sperber, D. & Wilson, D. (1987) Precis of Relevance: Communication and Cognition.
Behavioral and Brain Sciences. 10, 697-754
Stevens, T. & Karmiloff-Smith, A. (1997) Word learning in a special population: Do
individuals with Williams syndrome obey lexical constraints? Journal of Child
Language, 24, 737-765.
Stojanovik, V., & van Ewijk, L. (2008). Do children with Williams syndrome have unusual
vocabularies? Journal of Neurolinguistics, 21, 18-34.
Temple, C. M., Almazan, M. & Sherwood, S. (2002) Lexical skills in Williams' syndrome: A
cognitive neuropsychological analysis. Journal of Neurolinguistics, 15, 463-495.
Thal, D., Bates, E., & Bellugi, U. (1989). Language and cognition in two children with
Williams Syndrome. Journal of Speech and Hearing Research, 3, 489-500.
Thomas, M. S. C. (2008). L'acquisition du langage dans les pathologies du diveloppement
[Language development in developmental disorders]. In M. Kail, M. Fayol, & M.
Hickmann, L'apprentissage des langues, (pp. 451-475). Paris: CNRS Editions.
Thomas, M. S. C., Annaz, D., Ansari, D., Scerif, G., Jarrold, C., & Karmiloff-Smith, A.
(2009). Using developmental trajectories to understand developmental disorders.
Thomas, M. S. C., Dockrell, J. E., Messer, D., Parmigiani, C., Ansari, D., &
Karmiloff-Smith, A. (2006). Speeded naming, frequency and the development of the lexicon in
Williams syndrome. Language and Cognitive Processes, 21, 721-759.
Thomas, M. S. C., & Karmiloff-Smith, A. (2005). Can developmental disorders reveal the
component parts of the human language faculty? Language Learning and
Development, 1, 65-92.
Thomas, M. S. C., Purser, H. R. M., & Richardson, F. M. (in press). Modularity and
developmental disorders. In: P. D. Zelazo (Ed), Oxford Handbook of Developmental
Psychology. Oxford: Oxford University Press.
Thomas, M. S. C., van Duuren, M., Purser, H. R. M., Mareschal, D., Ansari, D., &
Karmiloff-Smith, A. (submitted). The development of metaphorical language
comprehension in typical development and in Williams syndrome.
Tyler, L. K., Karmiloff-Smith, A., Voice, K., Stevens, T., Grant, J., Udwin, O., Davies, M.,
Howlin, P. (1997) Do individuals with Williams syndrome have bizarre semantics?
Evidence for lexical organization using an on-line task. Cortex, 33, 515-527.
Udwin, O. & Dennis, J. (1995). Psychological and behavioural phenotypes in genetically
determined syndromes: A review of research findings. In G. O'Brien and W. Yule
(Eds.) Behavioural Phenotypes. Clinics in Developmental Medicine No. 138. London:
MacKeith Press.
Udwin, O., & Yule, W. (1990). Expressive language of children with Williams syndrome.
Volterra, V., Caselli, M.C., Capirci, O., Tonucci, F., Vicari, S. (2003). Early linguistic
abilities in Italian children with Williams Syndrome. Developmental
Neuropsychology, 23, 33-58.
Wilson, D. & Sperber, D. (2004). Relevance Theory. In L. Horn & G. Ward (Eds.) The
Handbook of Pragmatics (pp. 607-632). Oxford: Blackwell.
Wilson, M. D. (1988). The MRC Psycholinguistic Database: Machine Readable Dictionary,
Footnotes
1 While no task in the biological general knowledge battery appeared to make particular
metacognitive demands, two of the five tasks of the folk-biological concepts battery may
have done so (Death, as part of which participants were asked several open-ended questions
about death, such as “What happens to a person when they die?”, and Species
Transformations, in which stories were told of animals being transformed to look like other
animals [e.g. a tiger into a lion], either by dressing-up or by surgery, and participants were
asked, e.g., “Is it a tiger or a lion?”). Despite these concerns, the same basic pattern of results
Table 1.
Categorisation questions and whether perceptual distractors were used in each case
Categorisation question Perceptual distractors?
Which would you find in the sea? N
Which are birds? Y
Which are insects? Y
Which are farm animals? Y
Which are jungle animals? N
Which can fly? N
Which eat meat/fish vs. grass/vegetation? N
Which live in hot places vs. cold places? N
Which can swim well? N
Which live in a nest? N
Which make ivory? N
Which can sting? Y
Which can lay eggs? N
Which are rare and which are common animals? N
Which are reptiles? N
Which are mammals? N
Which ones live to be very old? N
Is a penguin the same kind of thing as a sea lion or
eagle?
Y
Is an octopus the same kind of thing as a jellyfish or
spider?
Figures
Figure 1. Mean number of correct features given by participants in the definitions task plotted
against verbal mental age in years. WS = Williams syndrome, TD = typically developing.
Figure 2. Mean number of salient/diagnostic features given by participants in the definitions
task plotted against verbal mental age in years. WS = Williams syndrome, TD = typically
developing.
Figure 3. Mean number of perceptual and abstract features given by participants in the
definitions task plotted against verbal mental age in years. WS = Williams syndrome, TD =
typically developing. Note the low R2 value for the TD perceptual trajectory reflects wide
variation despite an overall increase with age.
Figure 4. Mean number of correct categorisations plotted against verbal mental age in years.
WS = Williams syndrome, TD = typically developing.
Figure 5. Mean number of correct categorisations on trials with perceptual distractors plotted
against verbal mental age in years. WS = Williams syndrome, TD = typically developing.
Figure 6. Z-scores by group and task plotted against verbal mental age in years. WS =
Williams syndrome, TD = typically developing.
Figure 7a. Mean number of correct features given by participants for ‘elephant’ in the
definitions task plotted against verbal mental age in years. WS = Williams syndrome, TD =
typically developing.
Figure 7b. Mean number of correct categorisations for ‘elephant’ plotted against verbal
Figure 1
R² = 0.3534
R² = 0.1645
0 1 2 3 4 5 6
3 5 7 9 11 13 15 17 19
M
e
a
n
F
e
a
tu
re
s
VMA
TD
Figure 2
R² = 0.6165
R² = 0.5828
0 0.2 0.4 0.6 0.8 1 1.2 1.4 1.6 1.8 2
3 8 13 18
M
e
a
n
F
e
a
tu
re
s
VMA
TD
Figure 3
R² = 0.0918
R² = 0.0152 R² = 0.1692
R² = 0.6712
0 0.5 1 1.5 2
3 8 13 18
M
e
a
n
F
e
a
tu
re
s
VMA
TD Perceptual
WS Perceptual
TD Abstract
Figure 4
R² = 0.3084
R² = 0.3333
2 2.2 2.4 2.6 2.8 3 3.2 3.4
3 5 7 9 11 13 15 17 19
Figure 5
R² = 0.3595
R² = 0.0336
2 2.2 2.4 2.6 2.8 3 3.2 3.4 3.6
3 5 7 9 11 13 15 17 19
Figure 6
R² = 0.3534
R² = 0.1645 R² = 0.3084
R² = 0.3333
-2 -1.5 -1 -0.5 0 0.5 1 1.5 2
3 8 13 18
Z
-S
c
o
re
VMA
TD Definitions
WS Definitions
TD Categorisation
Figure 7a
R² = 0.1664
R² = 0.1387
0 0.05 0.1 0.15 0.2 0.25 0.3
3 5 7 9 11 13 15 17 19
M
e
a
n
F
e
a
tu
re
s
VMA
TD
Figure 7b
R² = 0.0451
R² = 0.1894
0 0.2 0.4 0.6 0.8 1
3 5 7 9 11 13 15 17 19
M
e
a
n
C
o
rr
e
ct
C
a
te
g
o
ri
sa
ti
o
n
s
VMA
TD
Appendix 1. Stimulus animal toys used in the categorisation task, by question
Categorisation question Within
category
Outside
category
Which would you find in the sea? Crab,
octopus, sealion, whale, jellyfish Frog, platypus, crocodile, stag, lion
Which are birds? Eagle,
swan,
penguin
Dragonfly,
sealion,
horse, bat
Which are insects? Bee,
dragonfly,
beetle, ant
Octopus,
crab, calf,
frog
Which are farm animals? Pig, cow,
horse, goat,
ram
Zebra,
cheetah,
stag, swan
Which are jungle animals? Elephant,
lion,
Sealion,
panther,
rhino
penguin
Which can fly? Bee, eagle,
beetle, bat
Jellyfish,
spider,
penguin, pig
Which eat meat/fish vs. grass/vegetation? Whale,
panther,
bear
Elephant,
pig, goat
Which live in hot places vs. cold places? Zebra,
snake
Bear,
penguin
Which can swim well? Penguin,
dolphin, octopus, crocodile, frog Rhino, pig, cheetah, bear, horse
Which live in a nest? Swan, bee,
ant
Crab, cat,
calf
Which make ivory? Elephant,
rhino
Crocodile,
dolphin
Which can sting? Bee,
jellyfish
Octopus,
Which can lay eggs? Swan, eagle, crocodile, T-rex, Frog Elephant, dolphin, pig, bat, ram
Which are the two biggest in real life vs. two smallest? Elephant,
whale, pig,
dog
Tortoise,
spider, crab,
bat, ant
Which are rare and which are common animals? Panther,
whale, eagle
Pig, ant,
horse
Which are reptiles? T-rex,
snake, crocodile, tortoise Sealion, platypus, eagle, jellyfish
Which are mammals? Elephant,
bat, whale,
lion
Frog,
octopus,
eagle, beetle
Which ones live to be very old? Tortoise,
elephant,
chimp
Frog, swan,
ant
Is a penguin the same kind of thing as a sea lion or
eagle?
Is an octopus the same kind of thing as a jellyfish or
spider?