Munich Personal RePEc Archive
Capital Inflows, Credit Booms and Their
Risks
Reinhart, Carmen
Harvard University
March 2012
Online at
https://mpra.ub.uni-muenchen.de/50981/
1 This draft: March 29, 2012
Comments welcome
Capital Inflows, Credit Booms and Their Risks
Carmen M. Reinhart1
Peterson Institute for International Economics, NBER and CEPR
This paper highlights the findings of some of the recent research on capital flows, credit booms, and their attendant consequences for asset prices, business cycles, financial crises and the interaction among these. The aim is to condense key results from the relevant literature and promote discussion on how financial and economic developments in China in recent years fit within established patterns detected in the broader cross-country and historical experience encompassing advanced and emerging market economies across most regions. The big question posed is whether taken together these developments describe the antecedents of a banking crisis with its potential severe consequences for economic activity or a milder soft landing scenario.
1
2
Introduction
Capital inflows bonanzas have become more frequent after restrictions to international
movements were lifted in most countries over the last three decades.2 Capital flows to emerging
economies can finance investment and foster economic growth, as well as increase welfare by
facilitating consumption smoothing. However, inflows may also induce excessive monetary and
credit expansions, complicate monetary policy, build an assortment of financial vulnerabilities,
and distort asset prices. Large inflows tend to be associated with expansionary economic
policies that often behave procyclically.3 These linkages between surges in capital inflows and
financial excess are not limited to emerging markets, as the post-2007 wave of crises in advanced
economies attest.4
Capital controls notwithstanding, China has faced in recent years and continues to do so
many of the challenges posed by this environment. Much of the discussion complements
concerns raised by Lardy (2012) about various dimensions of financial sector fragility and its
implications for the real economy in the period ahead while adding some elements from a
historical and international comparison.
The rest of the paper is organized as follows. The next section briefly reviews
well-known trends and developments in capital flows, international reserve accumulation, domestic
credit, and real estate prices for China. We then discuss the conceptual interaction between
exchange rate regimes and capital flows and credit growth patterns while revisiting the existing
literature. The main empirical findings on these links are summarized. Section III takes up the
question of do capital inflow bonanzas and credit booms make economies more crisis prone. We
2 See, for example, Reinhart and Reinhart (2008), and references therein. 3 Kaminsky, Reinhart, and Vegh (2004).
4
3
distinguish between studies focusing on the inflows proper and those primarily concerned with
domestic credit cycles as well as between banking and inflation crises to sketch the main
empirical findings in this literature. Section IV discusses the recurring theme in crisis episodes of
“hidden debts” an issue particularly germane to China’s current conjuncture. The big question is
whether, taken together, these developments describe the antecedents of a banking crisis with its
potential consequences for economic activity or a milder, soft landing.
II. Capital Flows and Credit:
Well-Known Trends and Less Well-Known Interactions
In the context of China (or any country with a fixed exchange rate), the discussion of
domestic credit booms is intimately connected to exchange rate policy and, specifically, to
foreign exchange market intervention, and whether the intervention is sterilized or not.
1. Reserve accumulation and domestic credit
From the basic balance-of-payments accounting identity, capital inflows (a surplus in the
capital account) are associated with either a deficit in the current account, an accumulation of
central bank reserves or any combination of the two.5 In Thailand in the 1990s, for example, the
capital inflows were associated predominantly with widening current account deficits while in
China the flows have been associated with a sharp reserve buildup.
The aims of sterilized intervention are twofold.6 The intervention in the foreign exchange
market is designed to prevent, or at least damp, nominal exchange rate appreciation that would
otherwise accompany the capital inflow. Meanwhile, an accompanying sale of securities in the
5
The simple rules of double-entry accounting ensure that, up to statistical discrepancies, the capital account surplus or net capital inflow (denoted by KA) Is related to the current account surplus (denoted by CA) and to the official reserves account (denoted by RA) of the balance of payments through the identity: KA+CA+RA ≡ 0, where RA < 0 implies an accumulation of reserves by the monetary authority.
6
4
domestic open market drains domestic reserves so as to offset the effects on total reserves--and
hence the money supply--that would otherwise ensue from the central bank's accumulation of
foreign exchange reserves. Other methods of sterilization usually involve increases in reserve
requirements. These do not reduce the impact of reserve accumulation on base money but
instead reduce the money multiplier and the accompanying impacts on broad money and credit
creation. In China (see Lardy, 2008 and 2012), as in many emerging markets (EMs), reserve
requirements have been an active component of the policy tool kit to deal with the effects of
capital inflows. A less frequent method of sterilization involves the transfer of government
deposits from the banking sector to the central bank—thus, in effect, placing a 100 percent
reserve requirement on these deposits.
A policy “lesson” distilled from a review of exchange rate and monetary policy during past
cycles of capital inflows (see Reinhart and Reinhart, 1998) through the 1990s is that despite
persistent efforts by the monetary authorities and a variety methods of sterilization, the
expansionary effects of reserve accumulation on the monetary aggregates is seldom (if ever)
fully offset by liquidity draining efforts.
Figure 1 traces China’s unparalleled accumulation of foreign exchange reserves (excluding
gold) since 1980. While the dollar magnitudes of the reserve accumulation rise exponentially, as
the figure makes plain, the log scale shown in the inset points to a steady rate of accumulation,
5
Figure 1. China: International Reserves Excluding Gold, 1981-2011 (billions of US dollars)
Sources: Bloomberg and International Monetary Fund, International Financial Statistics.
As noted previously, the full sterilization of a rapid reserve build-up has seldom been
achieved in the broad range of capital inflow episodes (even in cases where it may have been
desirable) and China’s case is no exception in this regard.
Thus, over the same three-decade period shown in Figure 1, domestic credit both in real
terms and as a share of GDP has been climbing markedly (Figure 2). In effect Figure 2
understates by a significant margin the extent of credit expansion, as lending in the informal
sector has soared during the latter part of the sample (see Lardy (2008) for a summary of Li
Jianzhun, (2008) study on the size of the underground lending). 0 500 1000 1500 2000 2500 3000
1978 1980 1982 1984 1986 1988 1990 1992 1994 1996 1998 2000 2002 2004 2006 2008 2010
6
As with capital inflows, a rising ratio of domestic credit to GDP evidences financial
deepening, often positively connected to long term growth, as highlighted by Ross Levine in
several studies. As with capital inflow bonanzas, credit booms often end badly and are a regular
precursor of full blown financial crises--the evidence on this theme is reviewed in the next
[image:7.612.86.530.275.579.2]section). Both inflow surges and credit booms are a “mixed blessing.”
Figure 2.China: Domestic Credit as a Percent of GDP and Banking Crisis, 1978-2010 (in percent)
Sources: International Monetary Fund, International Financial Statistics, World Economic Outlook, National Statistics Bureau of China, Reinhart and Rogoff (2009).
30 50 70 90 110 130 150 170
2007-the onset of the US Subprime crisis and global
turmoil
First year of banking crisis (shaded)
7
While the rise in private debt burdens is evident from Figure 2, it is useful to place
China’s experience in a comparative international setting. To that end, Table 1 documents the
changes in domestic credit/GDP over 1978-2010 (the full period for which the IMF reports
domestic bank credit data for China) and for 1997-2010, from the onset of the Asian crisis to the
most recent data.7 Apart from the calculations for China, we report the comparable changes for
sub groups of advanced economies (reporting separately the countries which had financial crises
in 2007-2009) and for emerging markets.
Among the salient points is that the only group posting larger increases in credit/GDP
than China over these periods is the advanced economies that ended their credit booms and
accompanying real estate bubbles in spectacular financial crises. For the Asian 1997-1998
crises countries, the low credit numbers for the entire period (1978-2010) mask the sharp
credit booms prior to the 1997 crisis and reflect the sharp deleveraging post 1997, as the last
column and Figure 4 makes plain.8
7 Monthly data for 2011 is available for most of the countries in the table but the end-month is uneven. 8
8
Table1. Changes in Domestic Credit/GDP: Selected Countries, 1978-2010 (in percent)
Country 1978-2010 1997-2010
China 109.1 46.9
Selected advanced economies
Australia 99.0 60.3
Austria 58.4 6.8
Finland 57.9 45.5
France 52.7 32.4
Germany 42.1 -5.8
Japan (crisis in 1991) 70.7 18.9
Average 63.47 26.35
Selected emerging markets
Argentina (crisis in 2001) -6.4 -1.2
Brazil 53.2 39.4
Chile 31.2 9.2
India 39.0 29.3
South Africa 30.1 21.1
Average 29.42 19.56
1997-1998 crisis countries
Indonesia 15.7 -24.0
Korea 67.5 41.8
Thailand 50.7 -68.5
Average 44.63 -16.9
2007-2009 crisis countries
Greece 74.5 65.0
Ireland 194.3 146.3
Italy 37.7 52.4
Portugal 109.4 37.1
Spain 138.0 129.1
United Kingdom 186.1 102.0
United States 108.2 43.7
Average 121.17 82.23
9
2. Exchange rate regimes and the capital flow-domestic credit link
Complementing the study of past capital flow cycles in Reinhart and Reinhart (1998 and
2008), Magud, Reinhart, and Vesperoni (2011) (MRV) examine 25 emerging markets through
the last capital inflow cycle to emerging Europe that ended abruptly in 2008. The focus of that
study is examining the association between domestic credit, capital inflows and the exchange
rate regime. The main empirical results are anticipated in Figure 3 through cross-plot charts:9
Figure 3, panel (a) presents evidence that credit to the private sector is higher in
economies with less flexible exchange regimes. (Appendix Table 1 summarizes the exchange
rate regime categories, which range from the least category 1 to the most
flexible-category 6.
Panel (b) shows that there seems to be a significant relationship between the share of
credit in foreign currency credit and exchange rate regimes, with a higher share in economies
with less flexible arrangements.
Panel (c) documents that capital flows are higher in economies with less flexible
exchange rate regimes. The scatter, though, suggests that this relationship may be associated
with a few outliers in very inflexible regimes.10
MRV show that, during capital inflow bonanzas, credit grows more rapidly in economies
with relatively inflexible exchange rate regimes. Studies on the economic performance of
different exchange regimes have tended to focus on growth, inflation, fiscal policies, and current
account adjustments, but have been relatively silent on the evolution of domestic credit. In a
related paper, Mendoza and Terrones (2011) show that capital inflows surge before the peak in
9 For the full empirical analysis, the interested reader is referred to the original paper. 10
10
credit booms, and that these latter have a higher frequency under less flexible exchange rate
regimes. KRV discuss and document why and how this relationship between capital inflows,
domestic credit, and exchange rate regimes works through banking intermediation. These
developments in credit could potentially be exclusively explained if countries with more rigid
exchange rate arrangements tend to record larger capital inflows. However, by analyzing the
relationship of the ratio of capital flows to GDP and the exchange rate regime, we do not find
11
Figure 3. Exchange Rate Flexibility, Credit, and Capital Flows
Panel A 0 20 40 60 80 100 120 140 160 180 200
0 1 2 3 4 5 6
D om e st ic C re d it t o G D P
Exchange Rate Flexibility
Panel B 0 10 20 30 40 50 60 70 80 90 100
0 1 2 3 4 5 6
F o re ig n C u rre n cy C re d it ( S h a re o f T o ta l)
Exchange Rate Flexibility
Panel C -20 -10 0 10 20 30 40
0 1 2 3 4 5 6
A nnua l C a pi ta l F lo w s t o G D P
12
3. Policy questions
MRV go on to suggest that on the basis of their findings that some of the most relevant
tools to counteract lack of exchange rate flexibility (apart from the obvious implication of
allowing for greater exchange rate flexibility) include:
Currency-dependent liquidity requirements—maybe even combining them with marginal
reserve requirements on external wholesale financing. Both contain credit and reduce incentives
to borrow in foreign currency by reducing the interest rate differential between loans in domestic
and foreign currency. Increasing reserve requirements across the board or imposing limits on
external borrowing by the banking sector may of course also reduce domestic credit growth.
Increasing capital requirements for FX loans and/or introducing dynamic provisioning on
FX loans (i.e. provisions increase as the share of FX loan over the total increases). These would
place incentives for banks to internalize the higher credit risk associated with potential
borrowers’ currency mismatches. They would also facilitate the building of buffers to cope with
capital flows reversals.
Tightening debt-to-income and loan-to-value ratios (conditional on the debts’ currency
denomination) would also contribute to contain domestic credit directly, and might be more
effective than traditional monetary tightening—i.e. increasing domestic interest rates.
However, for a comprehensive discussion of post-financial crisis macroprudential regulation
aimed at curbing credit booms, asset price bubbles and financial sector vulnerability more
generally, Goldstein (2012) provides carity on both the nature of the general discussion as well
13
4. Attendant Real Estate Booms
Credit booms have historically been accompanied by asset price booms; Kaminsky and
Reinhart (1999) document this for equities. Surges in the prices of equity, real estate, or both
marketshave accompanied cycles of rising leverage. Recent historical work by Schularick and
Taylor (2011) documents how this pattern pre-dates the post-WWII era. Yet, it is surprising how
many contemporary observers believed the U.S. housing price bubble during 2000–2006
(primarily) to be both unique and unprecedented. The magnitude of the bubble was certainly
unprecedented to the United States—at least during the past century for which we have
comparable data. However, in a broader global context, the subprime housing bubble experience
is not unique to the United States; nor is it magnitudes out of line with other real estate bubbles
that have also ended equally lamentably in financial crises.
Figure 4 compares the run-up in housing prices during 2002-2006 during the runup to the
subprime crisis that begins to unfold in the summer of 2007. The red bars highlight the (many)
countries where the surge in real housing prices culminated in a systemic banking during
2007-2009 other countries shown also experienced milder financial distress. In many of these cases,
five years after the onset of the crises housing prices have yet to stabilize, with Ireland and Spain
posting some of significant declines in the most recent data. Reinhart and Rogoff (2009)
document how pre-crises booms and post-crisis collapses were an integral feature of all the
major financial crises (in both advanced and emerging economies) where the real estate data is
available. For the RR sample the average peak-to-trough decline lasts six years and amounts to a
cumulative decline of about 36 percent. For Japan, since the start of its major banking crisis in
14
Since January 2003, when the data series start through the May 2010 peak, Shanghai
prices of existing homes (in real terms) rose by about 100 percent. Since then prices have
fallen by about 7 percent. While moderate price declines are a welcome sign of “cooling off”
after a surge (or bubble), a more marked slide in real estate prices has historically been a
harbinger of banking sector problems. It is one of the indicators with the highest predictive
ability (lowest noise-to-signal ratio).11
15
Figure 4. Percent Change in Real Housing Prices (2002–2006) and Banking Crises, 2007-2009
Source: Ehomeday, National Statistics Bureau of China, Reinhart and Rogoff (2009) and author’s calculations.
China: Shanghai prices of existing homes, inflation adjusted
(percent change)
January 2003-May 2010 (peak) 97.3 May 2010-December 2011 -6.9
-50 0 50 100 150 200 2
Ukraine Estonia Lithuania Latvia South Africa NewZealand Poland Iceland Spain Denmark France U.S. Belgium Ireland Hungary Canada Hong Kong Slovenia Sweden U.K. China Finland Australia Norway Italy Serbia Thailand Argentina Taiwan CzechRep. Netherlands Colombia Switzerland Malaysia South Korea Portugal Malaysia Singapore Austria Philippines Indonesia Germany Japan Percent Change
16
III. Do Capital Flow Bonanzas and Credit Booms Make Countries More Crisis Prone?
Are capital flow bonanzas a blessing or a curse? Or, for that matter, are they neutral as
regards their role in making financial crises more likely or more severe? The literature is filled
with famous case studies of capital flow bonanzas that ended in spectacular crises. The papers
range from the infamous episodes in the Southern Cone in the late 1970s-early 1980s (see, for
instance, Diaz Alejandro’s 1985 classic) to Calvo and Talvi (2005), who place great store in the
capital flow sudden stop following the Russian 1998 crisis in explaining Argentina’s subsequent
crash. Rather than focusing on specific episodes that are either as famous or more obscure, in
this section we systematically examine the potential links between the likelihood of a capital
inflow bonanza and financial crises. Reinhart and Reinhart (2008) investigate this issue for
capital flows; Mendoza and Terrones (2008 and 2011) Reinhart and Reinhart (2010), and
Schularick and Taylor (2011) for domestic credit booms.
1. Capital flow bonanzas and financial crises
Capital flow bonanzas are catalogued, country-by-country in Reinhart and Reinhart
(2008) and financial crises definitions in Reinhart and Rogoff (2009). From the crises and the
bonanza dates, Reinhart and Reinhart (2008) constructed a family of country-specific
probabilities. For each of the 64 countries in their sample, this implies four unconditional crisis
probabilities, that of: default (or restructuring) on external sovereign debt, a currency crash, an
inflation crisis, and a banking crisis. They also construct the probability of each type of crisis
within a window of three years before and after the bonanza year or years--the conditional
17
conditional probability, P(Crisis│Bonanza) should be greater than the unconditional probability
of a crisis, P(Crisis).
For the purposes of discussing China’s possible vulnerabilities, as neither an external
currency crisis nor a sovereign default on external debt appear remotely probable, given the
extremely low levels of gross total (public plus private) external indebtedness (especially relative
to liquid international reserves), current account surpluses, and the extensive capital controls.
Thus, only the main results for “internal” crises (banking and inflation) are summarized here.
It is important to remember in this context, that Japan’s two-decade long banking and real
estate crisis as well as China’s banking crisis of the 1990s largely connected to lending to
unprofitable state-owned enterprises were wholly of a domestic nature.
One of RR (2008) main results for the full sample is that the probability of any of the
four varieties of crises conditional on a capital flow bonanza is significantly higher than the
unconditional probability. Put differently, the incidence of a financial crisis is higher around
a capital inflow bonanza.
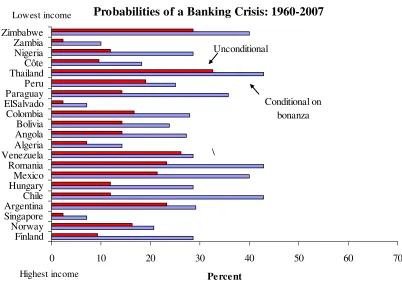
Figures 5 and 6 banking and inflation crises, respectively, present a comparison of
conditional and unconditional probabilities for individual countries, where the differences in
crisis probabilities were greatest. (Hence, the country list varies from one figure to the next).
While the advanced economies register much lower (conditional and unconditional) crisis
probabilities than their lower income counterparts, the likelihood of crisis is higher around
bonanza episodes in several instances. Notably, Finland and Norway record a higher probability
18
results for the advanced economies that are both quantitatively and qualitatively similar to those
[image:19.612.97.499.232.521.2]of emerging markets.
Figure 5. Are bonanza episodes more crisis prone? Banking crises: 66 countries, 1960-2007
Sources: Reinhart and Reinhart (2009), and sources cited therein.
Probabilities of a Banking Crisis: 1960-2007
0 10 20 30 40 50 60 70
Finland Norway Singapore ArgentinaChile HungaryMexico Romania VenezuelaAlgeria AngolaBolivia Colombia ElSalvadoParaguay Peru ThailandCôte Nigeria Zambia Zimbabwe
Percent
Unconditional
Conditional on bonanza Lowest income
Highest income
19
Figure 6. Are bonanza episodes more crisis prone? Inflation crises: 66 countries, 1960-2007
2. Credit booms and crises
The link between credit booms and crises began to be investigated in earnest following the
Mexican banking and currency crash of late 1994-1995 and the subsequent Asian crisis in
1997-1998. For nearly a decade (until the outbreak of the subprime crises) little academic work was
done on the subject and recently the topic has again regained scrutiny and popularity.
Probabilities of an Inflation Crisis: 1960-2007
0 10 20 30 40 50 60 70 80 90 100
GreeceItaly PortugalUnited Korea ArgentinaChile Costa RicaHungary MauritiusMexico Poland RomaniaTurkey AlgeriaAngola ColombiaEcuador El SalvadorGuatemala Peru MyanmarNigeria Zambia Zimbabwe
Percent
Unconditional
Conditional on bonanza Lowest income
20
In earlier papers, Kaminsky and Reinhart (1999) and Goldstein, Kaminsky and Reinhart
(2000) using the “signals” approach to develop an early warnings system identify “abnormal”
increases in credit/GDP among the leading indicators of both banking and currency crises. They
also find that 12-month changes in real equity prices (which are themselves correlated with the
credit boom) rank highly for a large sample of emerging market and a smaller sample of
advanced economy crises. Gourinchas,Valdes and Landerretche (2001), working with a sample
of Latin American countries, however, concluded that there is little connection between lending
booms and busts and crises. Their definition and dating of credit cycles differed from that used
in the “signals approach” papers and was subsequently critically questioned by Mendoza and
Terrones (2008), (MT) who examine nearly fifty credit booms in a large sample of advanced and
emerging market economies. Mendoza and Terrones (2008) conclude that while it is clear that
not all credit booms end in crises, nearly all financial crises are preceded by credit booms (in line
with the early results of the “signals” approach). In that paper, in which the macroeconomic data
was complemented by a micro firm-level database, they ended the sample in 2006 and (not
surprisingly) they concluded that the link between credit booms and subsequent financial crises
was more pronounced in emerging markets than in advanced economies.
In an update and extension of their work, Mendoza and Terrones (2011), after incorporating
post-2007 data and crises episodes reach the conclusion that the differences between advanced
and emerging economies (in terms of credit booms ending in crises) has all but disappeared.
Schularick and Taylor (2011) in several very recent papers enrich this analysis by extending the
sample for 12 advanced economies back to 1870. This extension is of interest for China, as the
long sample (about 140 years) also captures an era when many of the now advanced economies
21
of the sample than in the past three decades. Crisis or not, a key finding is that credit booms and
busts importantly influence cycles in real economic activity, in a consistent way across time; the
same cannot be said of monetary aggregates, which seem to have lost their earlier connection
with output. In a subsequent paper, Jorda, Schularick, and Taylor (2011) concludes that credit
growth emerges as the single best predictor of financial instability. Having examined the
indicator properties of many economic and financial series (see Goldstein, Kaminsk, and
Reinhart, 2000). This result appears somewhat overstated and colored by their more limited
choice of alternative indicators. Nonetheless, taken as a whole this literature clearly suggests
that credit booms have a distinct element of danger.
To illustrate this point with well-known crises episodes, Reinhart and Reinhart (2010) argue
in their Jackson Hole paper that while monetary, fiscal, and exchange rate policies differed
markedly (before, during, and after crisis) across episodes, the common thread was a sharp
build-up in leverage that spans a decade or more followed by a protracted period of deleveraging after
a banking crisis that lasts, on average seven years. Figure 7, taken from this study, focuses on
the amplitude of the fluctuations. The top bar measures the increase in domestic credit/GDP
from the minimum credit ratio in the 10-year window prior to the crisis (often the date for this
minimum turns out to be t-10) to the maximum value reached usually shortly before, during or
shortly after the financial crisis.12
As is evident, the increases in credit/GDP in the run-up to the crisis vary in size, with
surges in the 80-to-90 percent range before the crisis in Chile (1981) and Thailand (1997);
among the advanced economies, Japan (1992) holds the record, with an increase of about 70
22
percent.13 The median rise in domestic bank credit/GDP across these episodes is about 38
percent. Quite often, this leverage ratio continues to increase immediately after the crisis,
despite the fact that a credit crunch is underway. During this stage of the crisis, sharp declines in
nominal GDP (not matched by comparable write-downs in outstanding credits) importantly
account for increases in the ratio of credit to GDP. Typically, the greater the unwillingness (or
inability) to write down nonperforming debts, the longer the deleveraging process is delayed.14
This pattern is most evident in post-crisis Japan, where credit/GDP continues to climb until 1996,
peaking at 260.5 percent.
Figure 7. Domestic Banking Credit/GDP Twenty-one Years Around Severe Financial Crises:
Amplitude of Boom-Bust Credit Cycles in fifteen Post WWII Episodes
13 In effect, the rapid rise in leverage pre-dates our 10-year window, which begins in 1982 for Japan.
23
Sources: Reinhart and Reinhart (2010) and sources and authors’ calculations listed therein.
Notes: The magnitude of credit booms shown correspond to the difference between the maximum domestic bank credit-GDP ratio around the crisis and the pre-crisis low for the ratio during the 10-year window preceding the crisis. Similarly the extent of deleveraging is calculated as the minimum credit/GDP ratio reached during the 10-year window after the crisis and the maximum ratio reached around the crisis. For Korea, there is an uninterrupted secular rise in domestic bank credit-to-GDP during 1987-2007 (the 10-year window around the crisis). Post-crisis deleveraging appears to be confined to external debts (see Reinhart, 2010).
24
IV. “Hidden Debts”
“There are four things every person has more of than they know; sins, debt, years, and foes.”
-Persian Proverb
I will only focus on the second item in that list. Thus far, we have dealt with debt that is
seen and, more or less accurately. However, oftentimes in crises debt overhangs appear from
seemingly nowhere. It is not a new phenomenon. Writing about Chile’s crises in the early 1980s,
Diaz Alejandro (1985) was ahead of the curve as he wrote about the problem of government’s
contingent liabilities in the banking sector. He asked us to consider a country where
“The recorded public sector deficit was nonexistent, miniscule, or moderate; the
declining importance of ostensible public debt in the national balance sheet was
celebrated by some observers.”
The private sector and local governments was a different matter. There was a credit
boom, real estate and equity prices soared—so did debts. Growth seemed inevitable.
However, as Diaz Alejandro explains, the pity of the boom is that
“little effort was spent on investigating the credentials of new entrants to the
ever-growing pool of lenders and borrowers…practically no inspection or supervision of bank
portfolios existed…”
After the onset of the asset price decline, banking sectors were riddled with high debts (of
which a sizable share was nonperforming) and low levels of capitalization, while household
25
Under such conditions, the migration of private debts to the public sector balance sheets
has been a common recurring feature of banking crises.
Hidden debts thus fall into a variety of categories, some of which are more relevant to
China’s case than others.
The liabilities from unfunded (or underfunded) pension schemes. This is a source of
hidden debts on a massive scale for most advanced economies. Given marked differences in
demographics and social safety net schemes, this is less of an issue for emerging market
economies.
Contingent liabilities from private debts (most often the banking sector). This has been
and continues to be a major issue for many advanced economies in the ongoing crisis, Iceland,
Ireland and to a lesser degree Spain, all three which had a major private credit boom ahead of the
crisis, stand out in this regard. An a-priori unknown share of China’s bank debts (particularly
those connected to real estate) are candidates for this class of “hidden debt.” Even when private
debt are measured with precision (a rare occurrence) the share that will wind up in the public
hands is difficult to gauge until after the fact.
Debts of local, state or provincial governments. Historically these debts have been “less
than precisely” measured, as the degree of securitization is far lower than for central government
and the incidence of off balance sheet items is usually higher. In China, this is compounded by
credit transactions in the informal market, or shadow banking sector. Debts of provincial and
local governments, which remained largely “hidden” during the boom phase of the cycle also
26
in the regard during the crisis of 2001 as well as the Barings crisis of 1890. Several of Spain’s
provinces are reminiscent of this problem at present.
Central bank debts. Seldom is the debt issued by the central bank, for example, for
sterilization of foreign exchange purchases, accounted in a manner comparable to central
government debt. A different variation of hidden central bank debt’s was Bank of Thailand’s
large off-balance sheet derivative position in the foreign exchange market on the eve of the 1997
crisis.
The unofficial “shadow banking sector, which in the case of China, as discussed, has
reached significant proportions. In several of the crises episodes studies in Reinhart and Rogoff
(2009), the activities of finance companies (and their portfolios) were only marginally
understood until asset price collapses revealed their weaknesses.
“Below-the-line arrears” at all levels of government-although more common place at the
local and provincial levels accumulate rapidly ahead of and during crisis, a payments are
delayed, missed or made only partially. This is a nontrivial type of “hidden debts” at present in
much of periphery Europe. It is also an issue for US states like California and Illinois.
Conclusions
Writing about the incipient decline in housing prices and the mounting financial stress
Unites States in January of 2008 Ken Rogoff and I concluded:
“Tolstoy famously begins his classic novel Anna Karenina with “Every happy family is
27
doubt is distinct, they also share striking similarities, in the run-up of asset prices, in debt
accumulation, in growth patterns, and in current account deficits…
…Perhaps the United States will prove a different kind of happy family. Despite many
superficial similarities to a typical crisis country, it may yet suffer a growth lapse comparable
only to the mildest cases. Perhaps this time will be different as so many argue. Nevertheless, the
quantitative and qualitative parallels in run-ups to earlier post-war industrialized-country
financial crises are worthy of note.
… Finally, we note that although this paper has concentrated on the United States, many
of the same parallels hold for other countries that began experiencing housing price duress
during the 2007, including Spain, the United Kingdom and Ireland. There can be similarities
across unhappy families, too.”
Reinhart and Rogoff (2008)
As noted earlier, current account deficits and external indebtedess are not a part of the
landscape for China; these were also not part of the landscape for Japan in 1991 and are not a
“prerequisite” for a domestic banking crisis. Britain had several major financial crises in the
1800s while it was lender and banker to the rest of the world. Perhaps the decline in equity and
real estate prices underway in China is a modest and welcome correction and not part of a more
significant reversal. From a policy standpoint, however, it appears prudent to prepare for the
worst while hoping for the best. To that end, quantifying, accounting, consolidating, and
provisioning for the many loose ends associated with visible and hidden debts appears as a
28 References
Backe, P. and C. Wojcik (2008), “Credit Booms, Monetary Integration, and the Neoclassical Synthesis,” Journal of Banking and Finance, 32, 458-470.
Bubula, A., and I. Ötker-Robe (2003), “Are Pegged and Intermediate Regimes More Crisis Prone?” IMF Working Paper 03/223 (Washington: International Monetary Fund).
Calvo, Guillermo A., and Ernesto Talvi, “Sudden Stop, Financial Factors and Economic
Collapse in Latin America: Learning from Argentina and Chile,” NBER Working Paper 11153, February 2005.
Diaz-Alejandro, Carlos. “Good-Bye Financial Repression, Hello Financial Crash.” Journal of Development Economics, 19(1/2), February 1985, 1-24.
Goldstein, M., G.Kaminsky, and C. Reinhart (2000). ,Assessing Financial Vulnerability: An Early Warning System for Emerging Markets (with Morris, (Washington, DC: Institute for International Economics).
Goldstein, M. (2012), “Financial Regulation and Reform After the Crisis,” paper prepared for the CF40-PIIE Conference, Beijing, April 26-28.
Jordà, O., M. Schularick and A. Taylor “When Credit Bites Back: Leverage, Business Cycles, and Crises” NBER WP 17621
Kaminsky, G., C. Reinhart, and C. Végh (2004), “When It Rains, It Pours: Procyclical Capital Flows and Macroeconomic Policies,” NBER Working Paper 10780.
Lardy, N. (2008) “Financial Repression in China,” Peterson Institute Policy Brief Number PB 08-8se, Spetember.
Lardy, N. (2012). Sustaining China's Economic Growth after the Global Financial Crisis
(Washington DC: Peterson Institute for International Economics, January).
Li Jianzhun (2008) “Irregular Credit Completely Offsets the Retrenchment Gap,” China Economic Management Report, July.
Magud, N., C. Reinhart, and E. Vesperoni,“Capital Inflows, Exchange Rate Flexibility, and Credit Booms” NBER Working Paper 17670, December 2011.
29
Mendoza, E. and M. Terrones (2011), “An Anatomy of Credit Booms and their Demise” mimeograph, University of Maryland, November.
Reinhart, C. and V. Reinhart (1998) “Some Lessons for Policy Makers Who Deal with the Mixed Blessing of Capital Inflows,” in Miles Kahler, ed. Capital Flows and Financial Crises, (Ithaca, NY: Cornell University Press), 93-127.
Reinhart, C. and V. Reinhart (2008), “Capital Flow Bonanzas: An Encompassing View of the Past and Present,” in Jeffrey Frankel and Francesco Giavazzi (eds.) NBER International Seminar in Macroeconomics 2008, (Chicago: Chicago University Press for the NBER, 2009). 1-54.
Reinhart, C. and V. Reinhart (2010), “After the Fall,” forthcoming in Federal Reserve Bank of Kansas City Economic Policy Symposium, Macroeconomic Challenges: The Decade Ahead at
Jackson Hole, Wyoming, on August 26-28, 2010.
Reinhart, C. and K. Rogoff (2004), “The Modern History of Exchange Rate Arrangements: A Reinterpretation,”Quarterly Journal of Economics 119(1):1-48, February.
Reinhart, C. and K. Rogoff (2008) “Is The 2007 U.S. Subprime Crisis So Different? An, International Historical Comparison,” American Economic Review, Vol. 98 No. 2, May 2008,
339-344.
Reinhart, C. and K. Rogoff (2009), This Time It’s Different: Eight Centuries of Financial Folly
(Princeton: Princeton University Press, September).
30
Appendix
1 No separate legal tender
1 Pre announced peg or currency board arrangement
1 Pre announced horizontal band that is narrower than or equal to +/-2% 1 De facto peg
2 Pre announced crawling peg
2 Pre announced crawling band that is narrower than or equal to +/-2% 2 De factor crawling peg
2 De facto crawling band that is narrower than or equal to +/-2% 3 Pre announced crawling band that is wider than or equal to +/-2% 3 De facto crawling band that is narrower than or equal to +/-5%
3 Moving band that is narrower than or equal to +/-2% (i.e., allows for both appreciation and depreciation over time)
3 Managed floating 4 Freely floating 5 Freely falling
6 Dual market in which parallel market data is missing.