Chemistry Dissertations Department of Chemistry
Fall 12-8-2011
Targeted Molecular MR Imaging of HER2 and EGFR Using De
Targeted Molecular MR Imaging of HER2 and EGFR Using De
Novo Designed Protein Contrast Agents
Novo Designed Protein Contrast Agents
Jingjuan Qiao
Follow this and additional works at: https://scholarworks.gsu.edu/chemistry_diss
Recommended Citation Recommended Citation
Qiao, Jingjuan, "Targeted Molecular MR Imaging of HER2 and EGFR Using De Novo Designed Protein Contrast Agents." Dissertation, Georgia State University, 2011.
https://scholarworks.gsu.edu/chemistry_diss/62
This Dissertation is brought to you for free and open access by the Department of Chemistry at ScholarWorks @ Georgia State University. It has been accepted for inclusion in Chemistry Dissertations by an authorized
administrator of ScholarWorks @ Georgia State University. For more information, please contact
PROTEIN CONTRAST AGENTS
by
JINGJUAN QIAO
Under the Direction of Dr. Jenny J. Yang
ABSTRACT
The application of magnetic resonance imaging (MRI) to non-invasively assess disease
biomarkers has been hampered by lack of desired contrast agents with high relaxivity, targeting
capability, and optimized pharmacokinetics. We developed a novel MRI probe which targets
HER2, a biomarker for various cancers and a target for anti-cancer therapies. This multimodal
HER2-targeted MRI probe integrates a rationally designed protein contrast agent with a high
affinity HER2 affibody and near IR dye. Our probe can differentially monitor tumors with
differ-ent HER2 levels in both cells and xenograft mice. In addition to its 10-fold higher dose efficiency
compared to clinically-approved agent DTPA, our developed agent also exhibits advantages in
demon-second series of protein contrast agents that included affibody against EFGR developed with
the capability to specifically target EGFR. These contrast agents have been utilized to monitor
drug treatments and quantitatively analyze biomarker expression level. Furthermore, we
antic-ipate these agents will provide powerful tools for quantitative assessment of molecular
mark-ers, and improved resolution for diagnosis, prognosis and drug discovery.
PROTEIN CONTRAST AGENTS
by
JINGJUAN QIAO
A Dissertation Submitted in Partial Fulfillment of the Requirements for the Degree of
Doctor of Philosophy
in the College of Arts and Sciences
Georgia State University
Copyright by Jingjuan Qiao
PROTEIN CONTRAST AGENTS
by
JINGJUAN QIAO
Committee Chair: Dr. Jenny J. Yang
Committee: Dr. Aimin Liu
Dr. Zhi-ren Liu
Dr. Lily Yang
Electronic Version Approved:
Office of Graduate Studies
College of Arts and Sciences
Georgia State University
ACKNOWLEDGEMENTS
All the work in this dissertation was carried out under the direction of Dr. Jenny J. Yang;
in collaborate with Dr. Zhi-ren Liu. Dr. Yang’s knowledge guided my research with valuable
sug-gestions.
I am fortunate indeed to have such knowledgeable committee members who helped to
make this a wonderful learning event for me. Throughout my dissertation experience, Dr. Yang
provided immeasurably wise and perceptive counsel. I am especially grateful to her for
conti-nuously supporting my experiments and ideas, and helping me to express my research goals in
writing. My sincere thanks to Dr. Lily Yang, Dr. Hui Mao and Dr. Hans Grossniclaus, each of
whom contributed important and unique perspectives throughout the research development
and analysis. Their advice and feedback have been more helpful than they may realize.
I want to express many thanks to my friends Dr. Shunyi Li, Dr. Jie Jiang, Shenghui Xue,
Fan Pu and other members in Dr. Jenny Yang’s lab. I also want to thank Dr. Robert Long, Dr. Liya
Wang, and Dr. Hekmatayar for collecting MRI data.
This work is supported by grants from National Institute of Health and National Cancer
Institute, as well as a Brain and Behavior Fellowship provided by Georgia State University.
Finally, and most importantly, I would like to thank my parents and my husband,
TABLE OF CONTENTS
ACKNOWLEDGEMENTS ... iv
LIST OF FIGURES ... xiv
LIST OF ABBREVIATIONS ... xix
Chapter 1. INTRODUCTION ... 1
1.1 Cancer as human diseases ... 1
1.1.1 Biomarkers and its role in diagnosis, prognosis and treatment ... 2
1.1.2 Detection of biomarkers ... 6
1.2 EGFR family function as biomarkers for diagnosis and therapy ... 8
1.2.1 Structure of EGFR family proteins ... 9
1.2.2 Roles of EGFR family in tumor formation and growth ... 11
1.2.3 Distribution of EGFR family members in various cancers and cell lines ... 16
1.3 Targeted reagents for EGFR family ... 18
1.3.1 Intra-cellular inhibitor an extra-cellular ligands of EGFR (HER1) ... 19
1.3.2 Engineered antibodies and drugs for HER2 ... 21
1.4 Affibody library and screening ... 23
1.4.1 Affibody derived from z-domain of Protein A and screened by phage display………….. ... 23
1.5 Clinical imaging techniques and the application... 26
1.5.1 Magnetic Resonance Imaging and its application ... 27
1.5.2 Near Infra-red imaging and in vivo application ... 28
1.5.3 Other techniques of molecular imaging ... 29
1.6 Molecular imaging ... 30
1.7 Contrast agents for molecular imaging ... 33
1.7.1 MRI contrast agents ... 33
1.7.2 Biomarkers targeted contrast agents ... 36
1.7.3 Criteria of designing ideal contrast agents ... 37
1.8 Objectives of this study, and over view of the dissertation ... 38
Chapter 2. MATERIAL AND METHODS ... 42
2.1 Molecular cloning of ProCA1-affibody to target HER2 and EGFR ... 42
2.2 Plasmid construction and protein generation ... 42
2.2.1 GST-fusion ProCA1-affibody and purification ... 43
2.2.2 Sub-cloning of tagless ProCA1-affibody and purification ... 43
2.3 PEGylation of ProCA1-affibody ... 45
2.4 Conjugation of near infra red (NIR) dye to ProCA1-affibody ... 45
2.5 Determining the folding condition of ProCA1-affibody ... 46
2.5.2 Circular dichroism spectroscopy ... 46
2.5.3 Fluorescence spectroscopy ... 47
2.5.4 Nuclear Magnetic Resonance (NMR) spectroscopy ... 47
2.6 Relaxivity measurements and metal binding affinity of ProCA1-affibody ... 47
2.7 Cell culture and mammalian expression ... 48
2.8 Cancer cell targeting... 49
2.8.1 Enzyme linked immunosorbent assay (ELISA) ... 49
2.8.2 Western blotting ... 50
2.8.3 Radio-active assay on cancer cells ... 51
2.8.4 Immunofluorescent staining in cancer cells ... 52
2.8.5 Flow cytometer assay (FACS) ... 53
2.8.6 Magnetic Resonance Imaging (MRI) in cancer cells ... 53
2.9 Animal experiments ... 54
2.9.1 Nude mouse xenograft model ... 54
2.9.2 Nude mouse othotopic model ... 54
2.9.3 Magnetic Resonance Imaging (MRI) of tumor mouse ... 55
2.9.4 Near infra-red (NIR) imaging of tumor mouse ... 55
2.9.5 Biodistribution and blood circulation measurements ... 56
2.10 Histology analysis ... 57
2.10.1 Preparation of tissue slices ... 57
2.10.2 Immunohistology chemistry (IHC) on paraffin embedded slices ... 58
2.10.3 Immunofluorescent staining on frozen slices ... 58
2.11 Measure immunogenecity of ProCA1-affi ... 59
2.12 Measurement of Acute toxicity ... 59
Chapter 3. DESIGN, PREPARATION AND IN VITRO CHARACTERIZATION OF HER2 TARGETD PROCA1 USING AFFIBODY ... 61
3.1 Introduction... 61
3.2 Results and Discussion ... 63
3.2.1 Designed HER2 targeted protein based contrast agent with one Gd3+ binding site……….. ... 63
3.2.2 Generation of targeted ProCA1-affi342 ... 66
3.2.3 Conformational analysis of ProCA1-affibody ... 71
3.2.4 Modified ProCA1-affibody has been increased both in metal binding affinity and relaxivity 73 3.2.5 Other improved properties for modified contrast agents ... 75
3.2.6 Dual label ProCA1-affibody with NIR dye ... 77
4.1 Introduction... 82
4.2 Results and Discussion ... 83
4.2.1 Selection of cell lines ... 83
4.2.2 Monitoring cell targeting of Affibody variants using western blotting ... 83
4.2.3 Immunofluorescent staining of cancer cells with ProCA1-affi ... 86
4.2.4 Cancer cells treated by different amount of ProCA1-affibody demonstrate the quantitative monitoring capability of designed MRI contrast agents ... 91
4.2.5 Flowcytometry measures the constant binding of ProCA1-affi342 to cancer cells 93 4.2.6 Generation of antibody against ProCA1-CD2-m ... 97
4.2.7 Quantitative analysis of MRI signals in cancer cells ... 100
4.2.8 Cell binding was analyzed by measuring retention of 153Gd cheleted with ProCA1-affi342 ... 100
4.2.9 Summary and future work ... 102
Chapter 5. ESTBLISHING TUMOR MODELS AND MOLECULAR IMAGING OF HER2 IN MOUSE BY MRI AND NIR AND FURTHER ANALYSIS BY HISTOLOGY ASSAYS ... 104
5.1 Introduction... 104
5.2 Results and discussion ... 106
5.2.2 MRI on xenograft model indicates the specific targeting of
ProCA1-affibody……… ... 106
5.2.3 NIR imaging shows relative distribution of ProCA1-affibody in various mouse organs……….. ... 110
5.2.4 Immunofluorescent staining of frozen tissue slides can demonstrate the tissue penetration of ProCA1-affibody ... 112
5.2.5 MRI blocking experiment further confirmed the tumor targeting ... 114
5.2.6 Advantages of ProCA1-affibody to antibodies in tumor targeting ... 116
5.3 Conclusion ... 121
Chapter 6. BIODISTRIBUTION AND PHARMOKINETIC STUDY OF DEVELOPED CONTRAST AGENTS 124 6.1 Introduction... 124
6.2 Results and discussion ... 126
6.2.1 Distribution calculation by NIR signals in different mouse organs... 126
6.2.2 Bio-distribution and blood retention by 153Gd assay... 129
6.2.3 Bio-distribution with ICP-OES ... 133
Chapter 7. EFFECTS OF DRUG TREATMENTS DETERMINED BY PROCA1-AFFIBODY .... 136
7.1 Introduction... 136
7.2.1 Both receptor level and cell survival decrease after been treated by
Herceptin……… ... 137
7.2.2 Monitoring the receptor change after drug treatment using flow cytometry ………..138
7.2.3 ProCA1-affibody can monitor the total receptor change in cancer cells by MRI………. ... 140
Chapter 8. MONITORING CHANGES IN BIOMARKERS OF DISTRIBUTIONS AND EXPRESSION LEVELS DURING BREAST CANCER PROGRESSION BY TARGETED PROTEIN BASED CONTRAST AGENTS………….. ... 142
8.1 Introduction... 142
8.2 Results and discussion ... 150
8.2.1 Biomarker changes during the prognosis ... 150
8.2.2 Generation of EGFR targeted contrast agent ... 150
8.2.3 MR imaging of orthotopic tumors ... 154
8.2.4 MRI can monitor distribution of biomarkers ... 157
Chapter 9. OTHER CONTRAST AGENTS WITH MULTIPLE METAL BINDING SITES ... 160
9.1 Designing HER2 targeted contrast agent by using mutated CaM as host protein (ProCA22-affi342) ... 160
9.2 Toxicity of protein based contrast agents ... 161
PUBLICATIONS AND MANUSCRIPT IN REVISION ... 170
MANUSCRIPTS IN PREPARATION ... 171
Appendix I ... 172
Establish mammalian expression and purification of HER2-ECD ... 172
Appendix II ... 175
Vaccine and Monkey virus ... 175
LIST OF TABLES
Table 1 EGFR overexpression rate in different stages of cancers 14
Table 2 HER2 overexpression rate in different stages of cancers 15
Table 3 HER2 inhibitor in clinical use 19
Table 4. Physicochemical characteristics of commercially-available, extracellular,
predominantly renally excreted gadolinium-based MR contrast agents. 36
Table 5 Contents of all the variants 41
Table 6 HER2 expression level in various cancer cells 84
Table 7 Biodistribution of Radioactive assay in CD1 mice 132
Table 8 Bio-distribution of ProCA1-affi-m was measured by ICP-OES at various time
points 134
Table 9 Bio-distribution of MRI contrast agents was measured by ICP-OES to optimize
the modification condition 135
Table 10 Table of different breast cancer types 143
LIST OF FIGURES
Figure 1.1 Occurrence of different cancers in western countries. 2
Figure 1.2 EGFR family and its targeting molecules 5
Figure 1.3 Algorithm for Herceptin use 7
Figure 1.4 EGF receptor activation. 9
Figure 1.5 Crystal structure of HER2 and HER2-Herceptin complex 11
Figure 1.6 EGFR (A) and HER2(B) are negative prognostic factors in breast cancers 12
Figure 1.7 HER2 expression level of various cancer cells 17
Figure 1.8 Therapeutic effects through antibodies 22
Figure 1.9 Structure and Sequences alignment of affibody 24
Figure 1.10 ZHER2:342 is endocytosed into SKBR-3 cancer cells with HER2 over expression 25
Figure 1.11 Spatial resolution and penetration depth of molecular imaging techniques 32
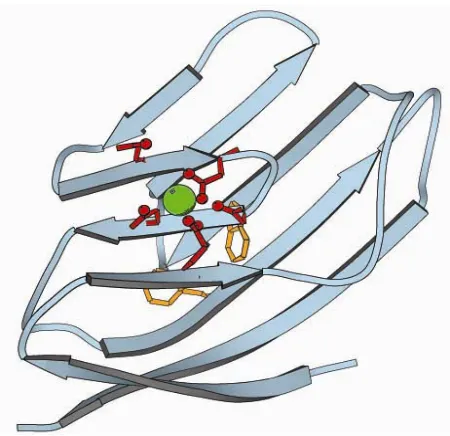
Figure 1.12 Model structure of ProCA1-CD2 35
Figure 2.1 DNA map of PGEX-2T vector 44
Figure 2.2 DNA map of PET-20b vector 44
Figure 3.1 Model Structure of ProCA1-CD2 64
Figure 3.2Model Structure of ProCA1-affibody. 65
Figure 3.3 Construction of ProCA1-affi342. 66
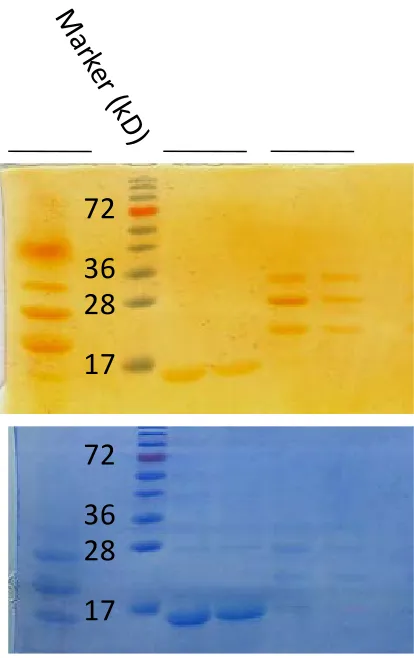
Figure 3.5 SDS gel of expression and initial purification by GS-4B column 68
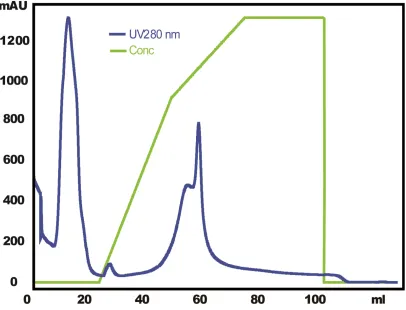
Figure 3.6 Purification of PEGylated ProCA1-affi342 with cation exchange column 69
Figure 3.7 SDS gel of purified ProCA1-affi342m from SP column 70
Figure 3.8 Expression of ProCA1-affi342 in PET20b vector 71
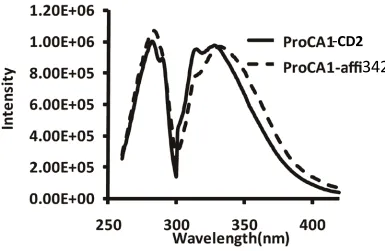
Figure 3.9 Tryptophan Fluorescence measurement. 72
Figure 3.10 The secondary structure measured by CD. 73
Figure 3.11 Metal binding affinity measurement. 74
Figure 3.12 Relaxivity of ProCA1-affibody. 75
Figure 3.13 SDS gel to measure the stability of modified contrast agent 76
Figure 3.14 PEGylation substantially reduced the immune responses monitored by
poly-antibodies. 77
Figure 3.15 Chemical structure of Cy5.5 dye 77
Figure 3.16 Extinction Coefficient of Cy 5.5 was measured 78
Figure 3.17 Conjugation rate measurement 79
Figure 3.18 MS spectra of free protein and conjugated protein 80
Figure 3.19 NMR spectra of free protein and protein-dye complex 81
Figure 4.1 Western blot of ProCA1-affi been retained in the cancer cells 85
Figure 4.2 ELISA of ProCA1-affi342 86
Figure 4.3 Immunostaining of HER2 on cell membrane. 88
Figure 4.4 Cell staining by ProCA1-affi WT 89
Figure 4.5 Immunostaining for endocytosis studies. 90
Figure 4.7 Immuno staining of Cancer cells at various time points 92
Figure 4.8 ELISA results to measure the binding to cancer cells 93
Figure 4.9 Binding affinity measurements (A) and Curve fitting of the binding between
ProCA1-affi342m and SKOV-3 cancer cells (B) 95
Figure 4.10 Curve fitted by Hill equation 96
Figure 4.11 Competative assay to measure the cell binding 97
Figure 4.12 Western blotting of anti0serum activity 99
Figure 4.13 Purified antibodies from anti-serum 99
Figure 4.14 The HER2 positive cells SKOV-3 can be imaged under MRI after incubated
with various concentrations of contrast agents. 100
Figure 4.15 Different concentrations of ProCA1-affi342 been retained in the cancer cells
by radioactive assay. 101
Figure 4.16 Radioactive assay to measure the cell binding of ProCA1-affibody. 102
Figure 5.1 NIR imaging on Xenografted mouse. 107
Figure 5.2 MRI of Xenografted mouse with Fast Spin Echo. 108
Figure 5.3 MRI of Xenografted mouse with Gradient Echo. 109
Figure 5.4 NIR imaging of mouse organs. 111
Figure 5.5 IHC staining on mouse tissues for biodistribution studies. 113
Figure 5.6 Magnetic resonance images and image intensities of the mouse tumor
pre-blocked by affibody ZHER2:342. 115
Figure 5.7 Direct staining with SKOV-3 tumors. 118
Figure 5.9 The tissue penetration properties of ProCA1 –affi-m were compared with
antibody by IHF staining. 120
Figure 6.1 Biodistribution demostrated by NIR imaging 127
Figure 6.2 Average intensity of each organ by NIR measurement 128
Figure 6.3 Western blotting of quantitative analysis of distribution 128
Figure 6.4 Biodistribution demostrated by IHC 129
Figure 6.5 Western blotting of blood retention 130
Figure 6.6 Bio-distribution of ProCA1-affi by 153Gd radioactive assay. 131
Figure 6.7 Blood circulation of ProCA1 series contrast agents 132
Figure 7.1 ELISA assay to monitor the HER2 receptor level changes after being treated
with Herceptin in SKOV3 cells. 137
Figure 7.2 Western blotting results indicated that the total receptor number decreased
about 35% after five days of treatments with Herceptin 138
Figure 7.3 Drug treatment measued by flow cytometry 139
Figure 7.4 Flow cytometry demostrated the receptor level change after being treated
with Herceptin. 140
Figure 7.5 MR images of SKOV3 cells after various days of treatments by Herceptin 141
Figure 8.1 Histological special breast cancer types 144
Figure 8.2 Progression of DCIS tumors 145
Figure 8.3 EGFR and HER expression levels in a human breast cancer xenograft derived
from a basal type of breast cancer cell ine (MCF-10DCIS) 149
Figure 8.5 ELISA of cell binding with EGFR high expression 152
Figure 8.6 Immunostaining of cancer cells by ProCA1-affibody-EGFR 153
Figure 8.7 Immuno staining of ProCA1-affi1907 in SKOV-3 cancer cells 154
Figure 8.8 MRI of orthotopic model. 155
Figure 8.9 MRI of orthotopic tumor model with fast spin echo 156
Figure 8.10 MRI of orthotopic tumor model with gradient echo 157
Figure 8.11 MR images can demonstrate the structure difference at the edge and core of
the tumor 158
Figure 8.12 Tumor structure can be measured by MRI and IHC 159
Figure 9.1Measurement of creatinine concentration in mouse blood 162
Figure 9.2 The enzyme in liver of ALT (alanine aminotransferase) and ALP(Alkaline
Phosphatase) activity 163
LIST OF ABBREVIATIONS
AP Alkaline Phosphatase
CaM Calmodulin
CD Circular dichroism
CD2 Cluster of differentiation 2
CT X-ray computed tomography
DAPI 4'-6-Diamidino-2-phenylindole
DCIS Ductal Carcinoma in situ
DMEM Dulbecco’s modified Eagle’s medium
ECD Extracelluar domain
EGFR Epidermal Growth Factor Receptor
ELISA Enzyme-lined Immunosorbent Assays
FACS Fluorescence Activated Cell Sorting
FITC Fluorescein Isothiocyanate
FISH Fluorescent in situ Hybridization
FRET Fluorescence resonance energy transfer
GFP Green fluorescent protein
GRPR Gastrin Releasing Peptide Receptor
GST Glutathione-S-transferase
HBSS Hank’s Buffered Salt Solution
HRP Horseradish Peroxidase
ICP-OES Inductively Coupled Plasma Optical Emission Spectroscopy
IHC Immunohistochemistry
IPTG Isopropyl-β-D-thiogalactopyranoside
Kd Dissociation constant
MRI Molecular resonance imaging
NIR Near infrared
NMR Nuclear magnetic resonance
OCT Frozen tissue matrix
OD Optical density
PBS Phosphate-buffered saline
PCR Polymerase chain reaction
PEG Polyethylene Glycol
PET Positron-emission tomography
ProCA Protein Based MRI contrast agents
PSA Prostate Specific Antigen
SDS-PAGE Sodium dodecyl sulfate polyacrylamide gel electrophoresis
SNR Signal to noise ratio
Chapter 1. INTRODUCTION
1.1 Cancer as human diseases
Cancer is caused by cells that grow uncontrolled and do not die. Normally, the cells in
the human body will follow a rule of growth, division, and death. Programmed cell death is
called apoptosis [1]. When this process is broken, cancer will form. Unlike regular cells, cancer
cells do not experience programmatic death and instead continue to grow and divide. This leads
to a mass of abnormal cells that grows out of control. In addition, cancer progression through
different stages causes invasiveness and metastasis [2]
In nowadays, cancer has been one of the most common human diseases, 23% of which
will cause death. More than 30% people in the world will receive cancer diagnosis during their
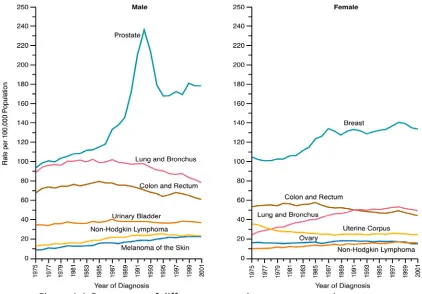
life time [3]. As shown in Figure 1.1, breast cancer and prostate cancer have highest occurrence
among all the cancers also with relatively high death rate [4]. Cancer diagnosis is mainly
achieved by X-ray or biopsy. For example, breast cancer was also been detected by
mammo-graphy since 1980s.
Prognosis is a prediction of probable outcome of a disease [5].Since a lot of factors of
individuals will affect the progress of disease, prognosis helps to identify which tumors are
Figure 1.1 Occurrence of different cancers in western countries.
Although the death rate of cancer is decreasing due to the development of diagnosis and therapy, the occurrence of breast and prostate cancers are still increasing. Both of the can-cers have highest occurrence in the western countries [7]
1.1.1 Biomarkers and its role in diagnosis, prognosis and treatment
Molecular targets, which are called biomarkers were discovered by researchers [8].
Since cancer is one of the common diseases in the world today, cancer biomarkers are of most
interests for researchers. An early diagnosis of cancers determines the possibility of curing
dis-ease[9] because the tumor will always prognoses into invasive tumor or metastasis into other
organs, which makes the therapy even more difficult . Therefore, it is necessary to find a target
molecule as a biomarker. In order to diagnose or prognoses the cancers accurately and
Various diagnosis assays have been developed based on the analysis of biomarkers [10].
For example, From 1970s, cervix cancer diagnosis by cell sample analysis has been offered. PSA
(Prostate Specific Antigen) in the urea or blood sample has been used to be widely applied to
diagnosing the prostate cancers [11].
The preferred targets for tumors should be present only in tumor cells and easily
recog-nized by targeting reagents during blood circulation. Therefore, cell surface molecules or
struc-tures in extracellular matrix are suitable for functioning as biomarkers [12]. For example, PSMA
(Prostate Specific Membrane Antigen) and HER2 are cell membrane proteins which express in
high level only in specific prostate or breast cancers.
The perfect target structure for use in tumor targeting should be present only in tumor
cells, and be easily accessible for targeting agents located in the blood. This makes cell surface
structures, or structures located in the extracellular matrix, suitable. It is also important that
the target is available during the whole treatment time, so that the cancer cells do not down
regulate its expression during treatment. This can be achieved if the target structure is needed
for the cancer cell to grow and divide.
Biomarkers have provided valuable information in patient selection. By estimating the
highest benefit from the treatment, the treatment population can be enriched by biomarkers
identification. Therefore, biomarkers play important roles in two aspects: first, biomarkers will
define which patients will benefit from the disease treatment by drugs; second, whether the
drugs function properly according to the expected mechanism based on biomarkers [13]. In
nowadays, almost half of the new developed molecular entities are involved in biomarker
Although biomarkers have been expected to increase the success rates in cancer
diag-nosis and treatments, there are still several challenges in clinical application of biomarkers [14].
First, the clearly understanding of biomarkers in the development of cancers is required for the
clinical process [15]. Second, reliable testing assay of biomarkers is needed for the reproducible
results. Although PSA is widely used for prostate cancer patient screening, it is not accurate,
with many false positives that gives wrong information if diagnosis [16]. Third, the detection
boundaries have to be defined by the constant testing. Fourth, the possible function of a novel
biomarker during a planned therapeutic strategy has to be estimated before been applied [17].
In a summary, all these factors have to be well considered before and during the clinical
appli-cation of biomarkers.
To be a biomarker, the molecule must possess several properties: it exits in tumor cells
rather than normal cells; it can be easily detected by targeting agents either in blood or tissue;
the molecule is available during the treatment period. The cell surface molecules or molecules
located in extracellular matrix have the highest possibility to be a biomarker.
In nowadays, almost half of the new molecular entries are involved in the development
of biomarkers. Targeted prognosis and therapy have increased survival percentage [12].
Design-ing targeted contrast agents can benefit for the diagnosis and prognosis of diseases. One
sub-ject of the biomarkers for cancer is receptor on cell surfaces which are widely studied. The
pop-ular receptors like PSA (prostate specific antigen), GRPR (gastrin releasing peptide receptor),
EGFR (epidermal growth factor receptor) family have been applied clinically for cancer
deter-mination and therapy [18-19]. These receptors always get over expressed in various cancer
pep-tide (GRP) is a member of bombesin like family of which pre-protein is cleaved into GRP of 27
amino acids or neuromedin C of 10 amino acids [22]. GRP is widely used to conjugate with
na-noparticles, quantum dots or other probes to function as a targeted contrast agent against
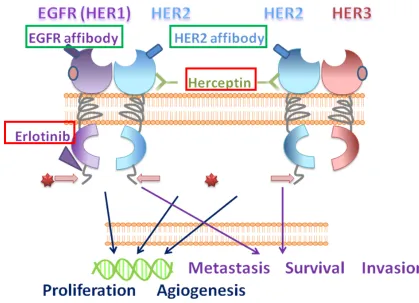
[image:28.612.104.523.254.557.2]GRPR [19]. Similar as GRP, EGF is the ligand for EGFR, which is the first member of EGFR family
(Figure 1.2). There is a high expression level of both EGFR and EGF in various cancer cells, like
breast cancers, ovarian cancers and pancreatic cancers [23].
Figure 1.2 EGFR family and its targeting molecules
1.1.2 Detection of biomarkers
Many techniques have been developed to measure specific biomarkers at protein, DNA
or RNA levels; for example, immunohistochemistry (IHC), enzyme-lined immunosorbent assays
(ELISA), fluorescent in situ hybridization (FISH) and real time polymerase chain reaction
(RT-PCR), as well as Flowcytometre (Figure 1.3). In order to get reproducible and reliable results
from the assays, Validation of the methods is critical to the assay [24].
Take one of the most famous biomarkers for breast cancer, HER2 (human epidermal
growth factor receptor 2) as an example (Figure 1.2). Since HER2 is involved in signal pathway
by the intracellular kinase domain. The mutation of the kinase gene will result in poor prognosis.
Therefore, RT-PCR of the mutated gene can predict the abnormal function of the biomarkers
[25]. HER2 gene also encodes a trans-membrane protein with the extracellular domain as a
tar-get for antibodies. Several antibodies against HER2 have been developed which makes IHC is
widely used to measure the expression level of HER2 protein which is related to the disease
stage.
However, most of these established methods are invasive by biopsy or surgery.
Unfor-tunately, the clinical application of targeted therapy is largely limited by current methods for
assessment of these cancer biomarkers using invasive methods such as biopsy. One of five
HER2/Neu clinical tests, including biopsy and immunostaining (IHC) provides incorrect results,
which severely affect the selection of appropriate patients for personalized treatment using
HER2/EGFR targeted cancer therapies. Limitations of these methods are mainly because of
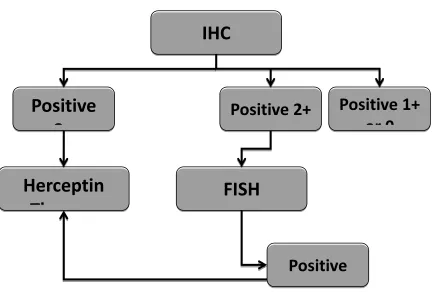
As shown in Figure 1.3, current diagnosis of HER2 is first based on IHC results. IHC will
predict the expression level of HER2 which is related to the tumor stages. The expression of
HER2 is generally divided into 4 levels, and only the highest level is suitable for targeted therapy.
The cancers with lower level of HER2 will need further analysis by FISH to determine the HER2
gene. However, IHC needs surgery to get the tissue samples for analysis. FISH also need to use
biopsy to get the tissue sample. These invasive techniques may stimulate the tumor growth and
[image:30.612.110.543.296.588.2]metastasis [26].
Figure 1.3 Algorithm for Herceptin use
In order to diagnose whether the specific type of breast cancer is suitable for Herceptin therapy, Cancer tissue samples are required for the diagnostic method of IHC. Only the HER2 level detected by IHC is up to stage 3, this type of cancer is illegible for Herceptin treatment. If the expression level is in stage 2, further diagnosis with FISH to amplify the HER2 DNA will be taken to confirm the treatment methods [27].
IHC
Positive
3
Positive 2+
Positive 1+
or 0
Herceptin
Th
FISH
1.2 EGFR family function as biomarkers for diagnosis and therapy
The epidermal growth factors (EGF) induce signal transduction by activating the kinase
domain of the epidermal growth factor receptors (EGFR) to promote cellular proliferation and
survival (Figure 1.2). EGFRs are comprised of four family members: EGFR/HER1, HER2/Neu,
HER3 and HER4, respectively. They share similar structures with an extracellular ligand binding
domain, a transmembrane domain, and a functional intracellular tyrosine kinase domain
(ex-cept for HER3). Different from other three re(ex-ceptor family members, HER2/Neu does not have
a natural ligand and its ECD domain is able to adopt an activated state to dimerize with EGFR or
HER3 (EGFR/HER2, HER2/HER3). HER2 is the preferred dimerization partner in the EGFR family.
HER2/Neu and EGFR are also major prognosis biomarkers over-expressed in various types of
cancer cells [28] and tissue samples from cancer patients [20, 29].
Various carcinomas, like glioma, bladder carcinomas and lung cancers, have
overexpres-sion of EGFR proteins [30-31]. The EGFR has many ligands, such as EGF and Transforming
Growth Factor-α(TGF-α). As shown in Figure 1.4, ligand binding cause conformational change
which exposing the dimerization of domain II. Because of the effects of dimerization, the
tyro-sine kinase sites located in the intracellular domain get phosphorylated. However, Her2 is not
dependent on the ligand activation. HER2 is the preferred dimerization partner for all the other
1.2.1 Structure of EGFR family proteins
Figure 1.4 EGF receptor activation.
I-IV: domains of the extracellular part of the receptor, TM: transmembrane domain, IC: Intracellular domain. Binding of EGF to the domain one and three of EGFR (HER1) ECD will cause the form change of domain and lead to homo-dimerization.
Figure 1.2 shows that the epidermal growth factors (EGF) induce signal transduction by
activating the kinase domain of the epidermal growth factor receptors (EGFR) to promote
cellu-lar proliferation and survival. EGFRs are comprised of four family members: EGFR/HER1,
HER2/Neu, HER3 and HER4, respectively.
They share similar structures with an extracellular ligand binding domain, a
transmem-brane domain, and a functional intracellular tyrosine kinase domain (except for HER3). The
EGFR has many ligands, such as EGF and Transforming Growth Factor-α(TGF-α). As shown in
Figure 1.4, ligand binding cause conformational change which exposing the dimerization of
do-main II. Because of the effects of dimerization, the tyrosine kinase sites located in the
Different from other three receptor family members, HER2/Neu does not have a natural
ligand. HER2 is the preferred dimerization partner for all the other members in the EGFR family.
When overexpressed, HER2 homodimers are often formed [34-35]. Its ECD domain is able to
adopt an activated state to dimerize with EGFR or HER3 (EGFR/HER2, HER2/HER3). Among the
EGFR members, HER2 is the one which is lack of natural ligand for the extracellular domain.
Therefore, HER2 has to form dimer with other family members to activate the downstream
sig-nal pathway [36]. Since HER3 is lack of the tyrosine kinase domain, when HER2 and HER3 form
into a heterodimer, binding of the ligand to HER3 will activate the tyrosine kinase function of
HER2. Various antibodies or other peptides have been developed to target to HER2 (Figure1.5).
To date, there are structures of extracellular domains have been determined mainly by X-ray
crystallography [37]. As shown in Figure 1.5, these structures reveal a fixed conformation for
HER2 that resembles a ligand-activated state, and show HER2 poised to interact with other ErbB
receptors in the absence of direct ligand binding. Herceptin binds to the juxtamembrane region
of HER2, identifying this site as a target for anticancer therapies [37]. This binding may facilitate
the endocytosis by providing direct interaction of the formed steric barrier to the
transmem-brane regions [38]. By identify the binding patterns of Herceptin Fab domain and HER2 ECD, a
basis of designing new targets for HER2 has been generated for diagnosis and therapeutic
Figure 1.5 Crystal structure of HER2 and HER2-Herceptin complex
The Fab domain of antibody Herceptin targets to the domain 4 of HER2 ECD close to the transmembrane domain. This may facilitate the endocytosis of HER2 after binding with Hercep-tin. The ADCC (antibody dependent cytoxicity) will be triggered after binding [37].
1.2.2 Roles of EGFR family in tumor formation and growth
As epidermal growth factor receptors, HER family proteins express on the cell
mem-brane. Both of the transmembrane proteins are important in tissue normal growth and
devel-opment [39]. The expression level of EGFR is relatively low in normal tissues except normal skin
epithelial cells. EGFR is also widely expressed in the tumor epithelial cells [40-41]. The
A
[image:35.612.109.507.70.476.2]B
Figure 1.6 EGFR (A) and HER2(B) are negative prognostic factors in breast cancers Those biomarkers that indicate lower survival rate are called negative prognostic bio-markers. Those cancer cells with higher expression level of EGFR or HER2 will have relatively lower survival rate and shorter survival time [42-43].
EGFR family members play an important role in various tumor etiology including breast
cancers, ovarian cancers, pancreatic cancers, prostate cancers and lung cancers (Figure 1.6).
The over expression of EGFR proteins as a consequence of amplification of EGFR genes in
of EGFR proteins is due to the character of EGFR as they can cause the loss of tumor
suppres-sion gene because EGFR is mutationally activated in half of the cancer cells [41].
Among of the members, HER1 and HER2 are two well established biomarkers for
diag-nosis and treatments. About 30% of the breast cancers have over expression of HER1 or HER2.
HER1 over-expresses in many solid tumors. By binding with its ligands, a signaling network will
be triggered (Figure 1.2). The tyrosine kinase domain will be activated for the downstream
sig-nal path way [1, 44]. Therefore, the cell proliferation and angiogenesis will be promoted and
the cell apoptosis will be inhibited [1]. The HER2 positive breast cancer is correlated with high
matastasis and low survival rate. HER2/Neu and EGFR are also major prognosis biomarkers
over-expressed in various types of cancer cells [28] and tissue samples from cancer patients
[20, 29]. Various carcinomas, like glioma, bladder carcinomas and lung cancers, have
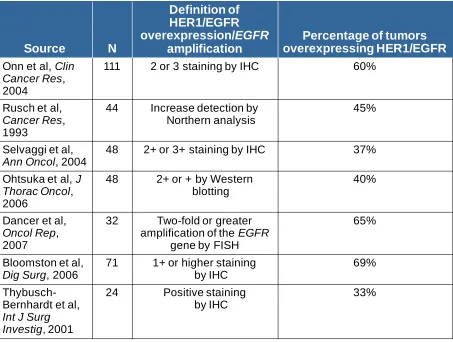
overex-pression of EGFR proteins [30-31]. Table 1 shows that up to 69% percentage of tumors have
high expression level of EGFR especially in later stage. Table 2 shows HER2 has high expression
level in about 30% tumor cells. However, HER2 expression is also over expressed in the early
Table 1 EGFR overexpression rate in different stages of cancers Source N Definition of HER1/EGFR overexpression/EGFR amplification
Percentage of tumors overexpressing HER1/EGFR Onn et al, Clin
Cancer Res, 2004
111 2 or 3 staining by IHC 60%
Rusch et al,
Cancer Res, 1993
44 Increase detection by Northern analysis
45%
Selvaggi et al,
Ann Oncol, 2004
48 2+ or 3+ staining by IHC 37%
Ohtsuka et al, J Thorac Oncol, 2006
48 2+ or + by Western
blotting
40%
Dancer et al,
Oncol Rep, 2007
32 Two-fold or greater amplification of the EGFR
gene by FISH
65%
Bloomston et al,
Dig Surg, 2006
71 1+ or higher staining by IHC
69%
Thybusch-Bernhardt et al,
Int J Surg Investig, 2001
24 Positive staining
by IHC
Table 2 HER2 overexpression rate in different stages of cancers
The over expression of EGFR and EGFR2 are associated with poor prognosis (Figure 1.6)
[10, 46]. The epidermal growth factors (EGF) induce signal transduction by activating the kinase
domain of the epidermal growth factor receptors (EGFR) to promote cellular proliferation and
survival (Figure 1.2). HER2/Neu and EGFR are over-expressed in various types of cancer cells
[28] and tissue samples from cancer patients. HER2 is a negative prognostic factor [20, 29]. In
numerous clinical studies, it is reported to associate with shorter disease-free and overall
sur-vival for breast and ovarian cancers as well as increased risk of death. About 30% of all breast
cancer cases are associated with expression of HER2/Neu. High expression of HER2/Neu closely
correlates with low survival rate [45, 47-48]. The rate of HER2/Neu overexpression was
esti-mated within a wide range of 6-35% in gastric cancer [49], 9-32% in ovarian cancer [50], and in
up to 70% of human pancreatic cancer [51]. EGFR also leads to increased cell proliferation and
Source N
Definition of HER2 overexpression/HER2
amplification
Percentage of tumors with HER2 overexpression/HER2
amplification Slamon et al,
Science, 1987
189 Two-fold or greater
amplification of HER2 gene by Southern blot
30%
Paik et al,
J Natl Cancer Inst, 2000
2034 Definite membrane staining by IHC in any tumor cell
29%
Owens et al,
Clin Breast Cancer, 2004
16,092 (FISH)
116,73 6 (IHC)
Two-fold or greater
amplification of HER2 gene by FISH
2+ or higher result by IHC
23%
20%
Seshadri et al,
J Clin Oncol, 19934
1056 Two-fold or greater
amplification of HER2 gene by slot blot
21%
Andrulis et al,
J Clin Oncol, 1998
580 Two-fold or greater
amplification of HER2 gene by Southern blot, slot blot, and/or RT-PCR
motility and decreased apoptosis [52]. EGFR is also a negative prognostic factor for multiple
tumor types, including non-small cell lung carcinoma (NSCLC) and pancreatic cancer [53].
Co-expression of EGFR and HER2 is found in 10–36% primary human breast carcinomas,
and it is generally associated with a poor prognosis compared with expression of a single
recep-tor [34, 54-56]. To date, the roles of EGFR and HER2/Neu in the progression of pre-invasive
duc-tal carcinoma in situ (DCIS) to potentially lethal invasive breast cancer remain under hot debate.
HER2/Neu is overexpressed in 60 to 70% of DCIS tissues which is much greater than in invasive
breast cancer tissues (~30%). In contrast, overexpression of HER2/neu is not found in normal
ductal cells or in hyperplasic ductal cells [57]. In addition, it has been shown that 14 to 91% of
human breast carcinomas express a high level of the EGFRs [52]. The majority (70%) of DCIS
tis-sues identified by mammographic microcalcification are of high grade comedo type, which is
associated with a high proliferation rate, lack of estrogen receptor, and high expression levels
of EGFR and HER2/neu [53]. The importance of EGFR signaling in the growth of DCIS tissues is
further supported by study results obtained from examination of the effects of an EGFR
inhibi-tor, iressa, on human DCIS tissues xenografted in nude mice [58-59].
1.2.3 Distribution of EGFR family members in various cancers and cell lines
There are more than 20 cell lines which have high expression level of HER2. They mainly
come from breast tumor, ovarian and pancreatic tumors. Among these cell lines, several pairs
of positive and negative HER2 cell lines are widely used in research (Table 3) [9].
SKBR-3 is one of the most traditional human breast cancer cell lines. This cell line was
SKBR-3. The AU565 cell line amplifies and overexpresses the HER2 oncogene; it expresses the
HER-3, HER-4 and p53 oncogenes. The expression level of HER2 in AU565 is much higher than in
SKBR-3. These two cell line are usually used to study the effect of drug or protein to HER2 cell
lines. However, their tumorigenicity is very low. As a result of that, they are not proper for a
tumor mouse model.
SKOV-3 cell line is a hypodiploid human cell line which originated from ovarain cancer.
The Her2 expression level is higher than SKBR-3. It can generate tumor in nude mice with well
differentiated adenocarcinoma. Because of its ability to generate well shaped tumors, it is
widely used on nude mouse for Her2 tumor model. Compare with SKOV-3, BT474 is another cell
line which is also commonly been used for generating tumors. BT-474 was isolated by E.
Lasfar-gues and W.G. Coutinho from a solid, invasive ductal carcinoma of the breast. The expression
level of BT474 is similar as AU565. Besides these genital cancers, pancreatic cancer sometime
also has a high expression level of Her2, such as MIAPaca-2.
Figure 1.7 HER2 expression level of various cancer cells
The HER2 expression levels have been measured in different cell lines. The cell line SKOV-3, SKBR-3 and BT474 with an expression level up to 106 per cell are called HER2 positive cell lines. The cell lines with expression level less than 104 are called HER2 negative cell lines.
0.00
1.00
2.00
BT474
SKBR3
SKOV3
MCF7
MDA-MB-231
MDA-MB-361
Based on the choice of positive cell lines, negative cell lines can be decided as a pair. For
example, MCF-7 and MDA-MB-231 come from breast cancer which can be control for SKBR-3
and AU565 (Table 3). By choosing cell lines from similar sources, the species difference can be
minimized.
Mouse EGFR-2 is different from HER2 which are from human. However, mouse EGFR-2
is also related to breast cancer of mouse. Both NT5 and EMT-6 are form mouse mammary
can-cer; EGFR-2 is overexpressed in NT5.
1.3 Targeted reagents for EGFR family
Besides the endogenous ligands for EGFR members, various targeted reagents, like
anti-bodies and peptides, have been developed against EGFR members. Based on the targeted
re-gion of the receptor, the targeted reagents can be generally divided into two types. One type of
reagents targets to the intracellular domain of EGFR; while another type targets to the
extracel-lular domain of EGFR [2, 60]. The intracelextracel-lular targeting reagents are inhibitors to the tyrosine
kinase domain. The reagents target to the extracellular domain can cause endocytosis, ADCC
(antibody dependent cytoxicity) effects of the cancer cells. The targeted molecules can be
anti-bodies such as, Herceptin, protein domain such as EGF and affibody, peptide, such as Latibnib
and small molecules such as Taxol [61]. The traditional cancer treatment like radiation therapy
and chemotherapy, will affect all normal cells. To use protein as a drug, it will decrease the
The drugs are summarized in Table 4 [62]. Small molecules like Lapatinib function as the
kinase domain inhibitor can inhibit both EGFR and HER2. The HER2 specific antibody like
Trastu-zumab (Herceptin) only target to the extracellular domain of HER2 which can inhibitor the HER2
expression specifically.
Table 3 HER2 inhibitor in clinical use [63]
Drug Type Target Source Current clinical status
Monoclonal antibodies
Pertuzumab Humanized HER2 Genen-thech/Roche Phase II trials in breast and ova-rian cancer with other reagent
Trastuzumab Humanized HER2 Genen-thech/Roche
Lanched for breast cancer in combination with chemo thera-py
Tyrosine kinase inhibitors
Lapatinib Thioquinazoline HER1/HER2 GlaxoSmith Kline
Lanched for second-line breast cancer treatment in combination with capecitabine
EKB-569 Cyanoquinoline HER1/HER2 Wyeth Phase II trials in colorectal and non-small cell lung cancers
BIBW-2992 Quinazoline HER1/HER2 Boehringer Ingelheim Phase II trials in breast, non-small cell lung and head cancers
Neratinib Cyanoquinoline Pan-HER Wyeth Phase II trials in breast and non-small cell lung cancers
AEE-788 Pyrrolopyrimi-dine HER1/HER2 Novartis Phase I/II
ARRY-543 Quinazoline HER1/HER2 Array Bio-phama Phase I
BMS-599626 Pyrrolotriazine Pan-HER
Bristol-Myers Squibb
Phase I
1.3.1 Intra-cellular inhibitor an extra-cellular ligands of EGFR (HER1)
The epidermal growth factor receptors EGFR and HER2/Neu are highly expressed as
biomarkers in various cancers and play important roles in cancer progression and survival. They
(Hercep-tin or Trastuzumab) and small inhibitors (Erlo(Hercep-tinib) against HER2 and EGFR have been shown to
be effective with patients over-expressing those biomarkers. Unfortunately, the clinical
applica-tion of targeted therapy is largely limited by current methods for assessment of these cancer
biomarkers using invasive methods such as biopsy. One of five HER2/Neu clinical tests,
includ-ing biopsy and immunostaininclud-ing (IHC) provides incorrect results, which severely affect the
selec-tion of appropriate patients for personalized treatment using HER2/EGFR targeted cancer
ther-apies [34, 64].
The epidermal growth factors (EGF) induce signal transduction by activating the kinase
domain of the epidermal growth factor receptors (EGFR) to promote cellular proliferation and
survival (Figure 1.3). HER2/Neu and EGFR are over-expressed in various types of cancer cells
[28] and tissue samples from cancer patients. HER2 is a negative prognostic factor [20, 29]. In
numerous clinical studies, it is reported to associate with shorter disease-free and overall
sur-vival for breast and ovarian cancers as well as increased risk of death. About 30% of all breast
cancer cases are associated with expression of HER2/Neu. High expression of HER2/Neu closely
correlates with low survival rate [45, 47-48]. The rate of HER2/Neu overexpression was
esti-mated within a wide range of 6-35% in gastric cancer [49], 9-32% in ovarian cancer [50], and in
up to 70% of human pancreatic cancer [51]. EGFR also leads to increased cell proliferation and
motility and decreased apoptosis [52]. EGFR is also a negative prognostic factor for multiple
1.3.2 Engineered antibodies and drugs for HER2
Based on the function as biomarkers of HER2 and EGFR, especially HER2 without a
natu-ral ligand, a lot of antibodies haven been developed against HER2. Antibodies have therapeutic
function by several pathways. Because HER2 mediates cell signaling pathways such as PI3K and
MAPK (mitogen activated protein kinase) pathways, antibody targeting to HER2 can cause ADCC
effects which make the cancer cells been swallowed by macro cells [65]. At the same time,
an-tibody can inhibit proteolysis of HER2 ECD and inhibition the HER2 DNA repair [35].Regarding
these mechanisms, antibody resistance is also developed by loss of antibody binding, increased
downstream signaling and activation of alternative growth factor pathways.
As shown in Figure 1.3 and Table 3, several targeted drugs such as monoclonal
antibo-dies (Herceptin or Trastuzumab) have been developed to against the ECD domain (which
re-gion) of the epidermal growth factor receptors EGFR and HER2/Neu expressed at the cell
sur-faces of various cancers [66-67]. Based on the function as biomarkers of HER2 and EGFR,
espe-cially HER2 without a natural ligand, a lot of antibodies haven been developed against HER2
(Table 4).
Because HER2 mediates cell signaling pathways such as PI3K and MAPK (mitogen
acti-vated protein kinase) pathways, antibody targeting to HER2 can cause ADCC effects which make
the cancer cells been swallowed by macro cells [65]. At the same time, antibody can inhibit
pro-teolysis of HER2 ECD and inhibition the HER2 DNA repair [35].Regarding these mechanisms,
an-tibody resistance is also developed by loss of anan-tibody binding, increased downstream signaling
Due to antibody resistance, other techniques for curing cancer cell through antibodies
are shown in Figure 1.8. The Fc domains of antibodies have been conjugated with drugs, toxic
proteins, radioisotopes and thermotherapy drugs.
Figure 1.8 Therapeutic effects through antibodies
For antibodies been used as therapeutic reagents, they may kill the cancer cells or get cancer cells apoptosis in different mechanisms [68]. (A) ADCC effects will be triggered by anti-body that helps the macro cells to swallow cancer cells. (B) The antianti-body is conjugated with some predrugs which function as a drug once gets into cytosol by killing the cancer cells. (C) Some toxic proteins which binds to antibody non-covalently will be released in the cytosol and inhibit the cell growth. (D) For those radioactive labeled antibody, the radioactive reagents will break the DNA replication of cancer cells directly. (E) The antibody can also be conjugated with some clinically available chemotherapy medicine. Antibody will provide the specific targeting and help the chemotherapy medicine to locate in the cancer area which will eliminate the harmful effects to normal cells.
1.4 Affibody library and screening
Affibody was selected as our targeted sequence because the suitable size for molecular
imaging of moderate circulation time [69]. Affibody is originated from the “z” domain of
pro-tein A, which contains 58 amino acids (Figure 2.1). A variant of this affibody called ZHER342 can
specifically target to HER2 with the Kd of 22 pM. Because of its small molecular weight (7 KDa), there are more advantages than antibodies for the affibody to penetrate deeper tissue and
tar-get the HER2 positive sites. Affibody is able to penetrate the blood vessel and well distribution
in the tumor mass. Biodistribution in SKOV-3 xenografts indicates that the up-take of reagent in
tumor sites by affibody targeting [70-71].
1.4.1 Affibody derived from z-domain of Protein A and screened by phage display
Affibody is originates from the “z” domain of protein A, which contains 58 amino acids.
Affibody molecules with affinity for HER-2 were selected using phage display. The produced
af-fibody molecules were tested for binding to HER-2 ECD immobilized to a Biacore sensorchip.
Figure 1.9 Structure and Sequences alignment of affibody
Affibody is a phage display library with 13 amino acids in domain 1 and domain 2 to be random. Different affibody variants are screened by specific antigen like HER2 or EGFR. ZHER2:4 is the first generation of affibody against HER2 and ZHER2:342 is the secondary generation which in-crease the binding affinity by changing the Kd from 50 nM to 22 pM. ZEGFR:1907 is a variant specif-ic targets to EGFR.
There are several advantages for the affibody than antibodies as a Her2 targeting
moie-ty. First, it can be quickly diffused in vivo and then target to the biomarkers. Second, the
opti-mized size enables affibody to penetrate cell membrane for endocytosis. The endocytosis
al-lows enough affibody molecules concentrate at the cancer cells, which fulfills the molecular
im-aging of biomarkers. Third, affibody can also be secreted out of the body in shorter time than
antibodies, which will minimize the toxicity. The radioactively labeled affibody was injected
in-to nude mice with SKOV-3 tumor model. Affibody can specifically target in-to the tumor in 24 hr
[75]. Figure 1.10 shows that HER2 affibody ZHER2:342 can bind to cells with high expression level of HER2 and has the endocytosis effects [69]. As a targeting moiety, affibody has several
affi-body is able to penetrate deeper tissue. Third, Biodistribution in SKOV-3 xenografts indicates
the up-take of reagent in tumor sites by affibody targeting.
Figure 1.10 ZHER2:342 is endocytosed into SKBR-3 cancer cells with HER2 over expression. HER2 is a protein on the cell membrane. The cells were stained with fluorescent (Fluo555 with excitation wavelength at 555 nm) conjugated affibody ZHER2:342. Staining in the cell plasma indicates that the ZHER2:342 gets inside of the cancer cells.
1.4.2 ZEGFR:1907 binds to EGFR with highest affinity
Affibody molecules specific for the epidermal growth factor receptor (EGFR) have also
been selected by phage display technology from a combinatorial protein library based on the
selec-tively bind to the extracellular domain of EGFR (EGFR-ECD). Kinetic biosensor analysis revealed
that the three monomeric Affibody molecules bound with similar affinity, ranging from 130 to
185 nM. Head-to-tail dimers of the Affibody molecules were compared for their binding to
re-combinant EGFR-ECD in biosensor analysis and in human epithelial cancer A431 cells. Although
the dimeric Affibody variants were found to bind in a range of 25–50 nM affinities in biosensor
analysis, they were found to be low nanomolar binders in the cellular assays. Competition
as-says using radiolabeled Affibody dimmers confirmed specific EGFR-binding and demonstrated
that the three Affibody molecules competed for the same epitope. Immunofluorescence
micro-scopy demonstrated that the selected Affibody dimers were initially binding to EGFR at the cell
surface of A431, and confocal microscopy analysis showed that the Affibody dimmers could
thereafter be internalized.
1.5 Clinical imaging techniques and the application
Visualization techniques are widely used to determine the exact location of the tumors
before surgery, and also to determine if metastasis is present and to monitor the tumor burden
during therapy. The most widely used imaging techniques include: MRI (Magnetic Resonance
Image), PET (Positron emission tomography), Ultra sound, GFP (Green Fluorescent Proteins),
NIR (Near infra-red) in animals and other radioactive methods.
Based on the function and mechanism, these imaging methods can be classified as two
categories [76]. One is an optical image to detect inner but lower imaging, like NIR and
fluores-cence, has relatively high sensitivity but low resolution. The penetration depth also limits the
the optical image techniques have the limitation in depth. The imaging signal varies due to the
depth change in vivo. Spectrum image techniques are able to show much deeper penetration
(Figure 1-10). However, the spectrum technique like PET using radio isotopes to create
radioac-tive signals, have disadvantages in harmful components.
1.5.1 Magnetic Resonance Imaging and its application
Magnetic resonance imaging (MRI) is one of the most powerful imaging techniques in
preclinical and clinical diagnosis due to its significant advantages in non-invasiveness and no
restrictive limitations [78]. MRI measures the water hydrogen properties and interactions in an
external magnetic field. MRI is able to detect signals in tissues from 1 mm to 1 m in thickness.
The high resolution to distinguish various organs also makes MRI a possible technique in clinical
application [79]. Since the MRI signals are from water molecules, the soft tissue such as brain
tissue, which contains high amount of water, will demonstrate strong MRI signals called
func-tional MRI (fMRI). Funcfunc-tional MRI is based on the increase in blood flow to the local vasculature
that accompanies neural activity in the brain. The hemodynamic response from fMRI is related
to neural activities, so fMRI is widely used in neuroimaging [80-81]. For example, the brain
tu-mor is easier to be identified by identifying the change of brain structure using fMRI. For other
organs especially tumors, their detections are hindered by the low sensitivity and signal to
noise ratio of MRI. Due to the lower proton density, regular tissues demonstrate relatively
low-er signals in the magnetic field comparing with soft tissues. In ordlow-er to make MRI suitable for
various diseases, contrast agent is required for MRI to image different organs except for the
1.5.2 Near Infra-red imaging and in vivo application
Near Infra-red (NIR) imaging is one type of the optical imaging, which detects the
transmission protons, penetrates through the tissue since short wavelength of the red color
enables it transparent of tissues [83]. The emission wavelength of NIR is between 700-1000 nm
[76]. Like all the other optical imaging, the photon transmission from tissue is largely affected
by tissue absorption and scattering. NIR dye can be used for in vivo imaging mainly because of
three advantages. First, NIR imaging has a high sensitivity even in nano molar level of molecules
[84], which benefits a molecular imaging for biomarkers. Second, animal body has relatively low
background fluorescence in near infrared region. Third, compared to other fluorescent dyes like
green fluorescence, NIR imaging has better penetration capability. This enables non-invasive
imaging by NIR dyes.
However, several limitations still hinder the application of NIR imaging in animals. First,
most NIR dyes are organic compounds with a molecular weight less than 1.2 KDa [85]. Since
these small molecules have relatively short circulation time in animal bodies, they are
conju-gated to large molecules like nano-particles and proteins for in vivo imaging [86-87]. The
distri-bution and pharmacokinetics of NIR dyes have been perturbed by the conjugated molecules.
Second, in order to increase the signal to noise ratio (SNR), a filtration wavelength needs to be
appropriately selected to minimize the auto-fluorescence [76]. Besides, low toxicity and
mole-cular stability are also required for the NIR dyes. This problem has been solved by molemole-cular
modification and conjugation [88].
Although NIR dye has high sensitivity and the intensity is linear to the dye concentration,
dif-ficult to distinguish different organs. In a summary, NIR imaging performs is very efficient in
probing the drugs or biomarkers; however, due to low resolution it is not suitable for further
studying tissue structure as well as prognosis.
1.5.3 Other techniques of molecular imaging
The X-ray technique, a 3 dimensional X-ray imaging tool, is used in mammography for
solid organs like bones and CT; however it uses gamma-camera which is radioactive and
inva-sive.
Positron-emission tomography (PET) technology is also commonly used for the clinical
diagnosis. PET is an image generated from radionuclides (tracer). This trace can emit pairs of
gamma rays which will be detected by the PET system and generated as a three dimensional
image [89]. In modern scanners, the PET and CT are combined to demonstrate a comprehensive
image of a whole living body. PET can image the soft tissue, while the CT scans the solid organ
as bones by X-ray. Both PET and CT have been used for many years in clinical diagnosis
be-cause of their high sensitivity and availability [75]. However, the PET imaging is based on the
decay of radioisotopes, which is harmful. Those isotopes with shorter half life times were
se-lected, including: 11C, 13N, 18F, 64Cu, 68Ga, and so on [90]. Short half life time requires a sensitive detector in the PET system or high amount of the tracers to generate an image with enough
resolution.
A tumor tracing molecule, coupled to a suitable radionuclide (gamma-emitting for use in
the gammacamera or positron-emitting for use in PET) is administrated, and when the tracer
glu-cose molecule that visualizes areas with high metabolism, such as tumor and inflammation
areas.
Molecular imaging assists the research, diagnosis or therapy of diseases on a molecular
level. This requires a series of biomarkers for various diseases and a necessary carrier to
facili-tate imaging reagents recognizing the biomarkers. Quantum dot is one of the best carriers for
the molecular imaging. Quantum dot was first introduced to the fluorescent imaging area;
be-cause it solves several problems for the organic fluorophores [88]. The inorganic core and shell
will narrow the emission range of the fluorophores within 25-35 nm. The background will
dra-matically decrease in such a narrow range [88].
1.6 Molecular imaging
Molecular imaging differs from traditional imaging in that probes known as biomarkers
are used to help image particular targets or pathways. Molecular imaging is a prospective
tech-nique in various areas like life science, physical science and neurology. Most diseases involve a
molecular basis; therefore, molecular imaging will facilitate the prognosis and diagnosis. It is
also expected to be applied in monitoring drug treatment via imaging biomarkers [56, 76, 91].
The most widely used imaging techniques include: MRI (Magnetic Resonance Image), PET
(Posi-tron emission tomography), Ultra sound, GFP (Green Fluorescent Proteins), NIR (Near infra-red)
in animals and other radioactive methods. They can be classified as two categories [76]. One is
optical image to detect inner but lower imaging, like NIR and fluorescence. Optical image has
relatively high sensitivity but low resolution. The penetration depth also limits the application
image techniques have the limitation in depth. The imaging signal varies due to the depth
change in vivo. Spectrum image techniques are able to show much deeper penetrations (Figure
1.11). However, the spectrum technique like PET using radio isotopes to create radioactive
sig-nal, have disadvantages either in harmful components.
Since nowadays, molecular imaging is not only used for studying basic biological
process, but also used for understanding the mechanism of disease development in molecular
level, it is expected that the molecular imaging will provide better differentiations in prognosis,
diagnosis and monitoring therapies by using various biomarkers [92].
Molecular imaging assists the research, diagnosis or therapy of diseases on a molecular
level. This requires a series of biomarkers for various diseases and a necessary carrier to
Figure 1.11 Spatial resolution and penetration depth of molecular imaging techniques The x-axis indicates the spatial resolution of different imaging techniques. The y-axis shows the sensitivity in (A) and penetration depth in (B). MRI has the largest spatial resolution comparing with other techniques; however, its sensitivity is very low.
A
1.7 Contrast agents for molecular imaging
Contrast agents in molecular imaging are those reagents which can enhance the signal
of imaging or distinguish the disease organs and non-disease organs [93].
In NIR imaging, NIR dye itself function as a contrast agent. Quantum dot is one of the
popular carriers for the molecular imaging. Quantum dot was first introduced to the fluorescent
imaging area; because it solves several problems for the organic fluorophores [88]. The
inorgan-ic core and shell will narrow the emission range of the fluorophores within 25-35 nm. The
back-ground will dramatically decrease in such a narrow range [88].
Contrast agents in MRI field are more widely used because MRI has high resolution but
low sensitivity. To enhance the sensitivity of imaging, 35% of MRI scans utilize the injection of
MRI contrast agents with paramagnetic, ferromagnetic or super paramagnetic metal ions. In
this dissertation study, we will focus on developing MRI contrast agents.
1.7.1 MRI contrast agents
MRI contrast agents are used to shorten the relaxation time (T1 and T2) of the protons
in the tissue area [82]. Based on the mechanisms, MRI contrast agents can be divided into two
categories: contrast agents which enhance the same level of longitudinal and transverse
relaxa-tion are called T1-weighted contrast agents. Contrast agents with much longer transverse
re-laxation than longitudinal rere-laxation is called T2-weighted contrast agents [94]. The most
com-mon T1 weighted contrast agents are gadolinium (Gd3+) based, since Gd3+ is a lanthanide metal with seven unpaired electrons, high magnetic moment, and long electron spin relaxation time
Gd3+ perturbs the surrounded proton relaxivity. In order to increase the exchanged water num-bers with Gd3+ and prevent the toxicity of Gd3+, an encapsulated chelator is required, such as Gd-DTPA and Gd-DOTA [96].
Gadolinium, Gd3+, a lanthanide metal with seven unpaired electrons, high magnetic moment, and long electron spin relaxation time, is one of the most widely used ions in
T1-weighted MRI contrast agents [97]. Since free Gd3+ is highly toxic with LD50=0.2 mmol/kg in mice [96], it must be encapsulated by chelators. Current FDA approved MRI contrast agents are
based on small chelators (Table 4). Unfortunately, these clinical contrast agents only have a
re-laxivity of about 5 mM-1 s-1. For example, Gd-DTPA, has a r1 relaxivity of 3.8 mM-1 s-1 at 20 MHz.[94, 98] In order to detect contrast changes due to the difference of proton relaxation
time in organs clinically, a relaxation rate change of 0.5 s-1 is required [82]. Thus, a local concen-tration of 100 μM of contrast agent is required [82, 99]. In general, about 0.1-0.3 mM/ kg
injec-tion dose is needed to obtain high contrast in human and small animal tissues.
The high concentration of contrast agent required for contrast is indicative of low
effi-ciency and results in increased risk for certain disorders. Nephrogenic systemic fibrosis (NSF), a
disease found in patients with kidney disease, has been correlated with the use of a
gadoli-nium-based MRI contrast agents and is reported to be related to the release of free Gd3+ [100-103]. Further, small molecular contrast agents have a very short half life time (half-life around
0.5-3 min in the blood vessels of mice and elimination half-life about 1.5 hours in patients
[104-105]) that limits the time window for MRI data collection and often requires repeated dose
in-jections. Moreover, such local concentration and detection limits (~30 µM in mouse skeletal
poten-tial biological targets for molecular imaging. Therefore, there is an urgent need to develop
con-trast agents with significantly improved relaxivity, optimal retention time, and potential
[image:58.612.194.419.158.376.2]target-ing capabilities.
Figure 1.12 Model structure of ProCA1-CD2