www.hydrol-earth-syst-sci.net/21/1741/2017/ doi:10.5194/hess-21-1741-2017
© Author(s) 2017. CC Attribution 3.0 License.
Modelling liquid water transport in snow under rain-on-snow
conditions – considering preferential flow
Sebastian Würzer1,2, Nander Wever2,1, Roman Juras1,3, Michael Lehning1,2, and Tobias Jonas1 1WSL Institute for Snow and Avalanche Research SLF, Flüelastrasse 11, 7260 Davos Dorf, Switzerland
2École Polytechnique Fédérale de Lausanne (EPFL), School of Architecture, Civil and Environmental Engineering, Lausanne, Switzerland
3Faculty of Environmental Sciences, Czech University of Life Sciences Prague, Kamýcká 129, 165 21, Prague, Czech Republic
Correspondence to:Sebastian Würzer ([email protected]) Received: 14 July 2016 – Discussion started: 3 August 2016
Revised: 10 December 2016 – Accepted: 29 January 2017 – Published: 24 March 2017
Abstract. Rain on snow (ROS) has the potential to gener-ate severe floods. Thus, precisely predicting the effect of an approaching ROS event on runoff formation is very impor-tant. Data analyses from past ROS events have shown that a snowpack experiencing ROS can either release runoff im-mediately or delay it considerably. This delay is a result of refreeze of liquid water and water transport, which in turn is dependent on snow grain properties but also on the pres-ence of structures such as ice layers or capillary barriers. During sprinkling experiments, preferential flow was found to be a process that critically impacted the timing of snow-pack runoff. However, current one-dimensional operational snowpack models are not capable of addressing this phe-nomenon. For this study, the detailed physics-based snow-pack model SNOWPACK is extended with a water transport scheme accounting for preferential flow. The implemented Richards equation solver is modified using a dual-domain approach to simulate water transport under preferential flow conditions. To validate the presented approach, we used an extensive dataset of over 100 ROS events from several loca-tions in the European Alps, comprising meteorological and snowpack measurements as well as snow lysimeter runoff data. The model was tested under a variety of initial snow-pack conditions, including cold, ripe, stratified and homo-geneous snow. Results show that the model accounting for preferential flow demonstrated an improved overall perfor-mance, where in particular the onset of snowpack runoff was captured better. While the improvements were ambiguous for experiments on isothermal wet snow, they were pronounced
for experiments on cold snowpacks, where field experiments found preferential flow to be especially prevalent.
1 Introduction
water transport processes is less important than for sub-daily timescales (Wever et al., 2014a). Water transport processes are further usually described for snowmelt conditions, but not for ROS conditions, where high rain intensities may fall onto a cold snowpack below the freezing point. In this study however, we particularly focus on snowpack runoff genera-tion at sub-daily scales with special attengenera-tion to the timing of snowpack runoff which is influenced by preferential flow (PF).
Many studies have shown that flow fingering or PF is an important water transport mechanism in both laboratory ex-periments (Hirashima et al., 2014; Katsushima et al., 2013; Waldner et al., 2004) and under natural conditions, using dye tracer (Gerdel, 1954; Marsh and Woo, 1984; Schnee-beli, 1995), temperature investigations (Conway and Bene-dict, 1994) or by measuring the spatial variability of snow-pack runoff (Kattelmann, 1989; Marsh and Pomeroy, 1993, 1999; Marsh and Woo, 1985). The variability of snowpack runoff is defined by the distribution and size of preferen-tial flow paths (PFPs), which are dependent on the structure of the snowpack and weather conditions (Schneebeli, 1995). Beyond its importance for hydrological implications, PF may also be crucial for wet snow avalanche formation processes, where snow stability can be depending on the exact location of liquid water ponding (Wever et al., 2016a).
Most snow models describe the water flow in snow as a uniform wetting front, thereby implicitly only considering the matrix flow component. The history of quantitative mod-elling of water transport in snow starts with Colbeck (1972), who first described a gravity drainage water transport model for isothermal, homogeneous snow. This was done by apply-ing the general theory of Darcian flow of two-fluid phases flowing through porous media, neglecting capillary forces. Because water transport is not just occurring in isothermal conditions and snow can therefore not be treated as a clas-sical porous medium, Illangasekare et al. (1990) were the first to introduce a 2-D model being able to describe water transport in subfreezing and layered snow. A detailed multi-layer physics-based snow model, where water transport was governed by the gravitational part of the Richards equation (RE) described in Colbeck (1972), was introduced by Jor-dan (1991). With the implementation of the full RE described by Wever et al. (2014a), the influence of capillary forces on the water flow was firstly represented in an operationally used snowpack model.
A model accounting for liquid water transport through multiple flow paths was developed by Marsh and Woo (1985), but was not able to explicitly account for structures like ice layers and capillary barriers. Recently, multi-dimensional water transport models have been de-veloped, which allow for the explicit simulation of PFPs (Hirashima et al., 2014). These models are valuable for describing spatial heterogeneities and persistence of PFPs, but have not yet been shown to be suitable for hydrological or operational purposes. In general, multi-dimensional
models are limited by the fact that they are computationally intensive, thus not thoroughly validated for seasonal snow-packs, and still lack the description of crucial processes such as snow metamorphism and snow settling.
In snowpack models which are used operationally, PFPs are not yet considered. The recently introduced RE solver for SNOWPACK led to a significant improvement of mod-elled sub-daily snowpack runoff rates. For this paper, we fur-ther modified the transport scheme for liquid water by im-plementing a dual-domain approach to represent PFPs. This new approach is validated against snow lysimeter measure-ments which were recorded during both natural and artificial ROS events.
This study aims to better describe snowpack runoff pro-cesses during ROS events within snowpack models that can be used for operational purposes such as avalanche warning and hydrological forecasting. This requires that the model re-sults remain reliable, i.e. that improvements are not realized at the expense of a decreased model performance during pe-riods without ROS, and that the model must not be too com-putationally expensive. This is the first study to test a water transport scheme accounting for PF which has been imple-mented in a snowpack model that meets the above require-ments.
Our analysis of simulations of over 100 ROS events targets the following research questions:
– Is snowpack runoff during ROS in a 1-D model bet-ter reproduced with a dual-domain approach to account for PF than with traditional methods considering matrix flow only?
– Are there certain snowpack or meteorological condi-tions, for which the performance specifically benefits if PF is represented in the model?
This paper is structured as follows: Sect. 2 describes the snowpack model setup, the water transport models, input data and the event definition. Results of the simulations are shown in Sect. 3. This includes data of sprinkling experi-ments of ROS (3.1), natural ROS events (3.2) and the vali-dation of the model on a long-term dataset from two alpine snow measurement sites (3.3). The results are discussed in Sect. 4, followed by the general conclusions found in Sect. 5.
2 Methods
where data were recorded for several natural ROS events. At the same sites, we conducted a set of six sprinkling ex-periments to simulate ROS events for given rain intensities (Sect. 2.4). Furthermore, we conducted simulations for two extensive datasets from the European Alps: Weissfluhjoch (Switzerland, 46.83◦N, 9.81◦E, 2536 m a.s.l., WSL Institute for Snow and Avalanche Research SLF (2015), abbreviated as WFJ in the following) and Col de Porte (France, 45.30◦N, 5.77◦E, 1325 m a.s.l., Morin et al. (2012), abbreviated as CDP in the following). These datasets provide meteorologi-cal input data for running SNOWPACK as well as validation data, including snowpack runoff. Both datasets have already been used for simulations with SNOWPACK (Wever et al., 2014a) and provide data over more than 10 years each.
Below, the SNOWPACK model and the different water transport models are described first, followed by the descrip-tion of the field sites for ROS observadescrip-tion in the vicinity of Davos. Then, we detail the setup of the artificial sprinkling experiments. After summarizing the WFJ and CDP dataset, we finally present the definition of ROS events that is used in this study. Most analyses were performed in R 3.3.0 (R De-velopment Core Team, 2016) and figures were created with base graphics or ggplot2 (Wickham, 2009).
2.1 Snowpack model setup
The setup of the SNOWPACK model is similar to the setup used for simulations in Würzer et al. (2016). For all sim-ulations, snow depth was constrained to observed values, which means that the model interprets an increase in ob-served snow depth at the stations as snowfall (Lehning et al., 1999; Wever et al., 2015). Because the study focuses on the event-scale and snowpack runoff is essentially depen-dent on the properties of the available snow, this approach was chosen such that we have the most accurate initial snow depth at the onset of the events to achieve the best compa-rability between the three water transport models. The tem-perature used to determine whether precipitation should be considered rain (measurements from rain gauges) or snow (from the snow depth sensors) was set to achieve best re-sults for reproducing measured snow height for precipita-tion driven simulaprecipita-tions for the Davos field sites (between 0 and 1.0◦C). For WFJ and CDP, this threshold temperature was set to 1.2◦C, where mixed precipitation occurred pro-portionally between 0.7 and 1.7◦C. Turbulent surface heat fluxes are simulated using a Monin–Obukhov bulk formula-tion with stability correcformula-tion funcformula-tions of Stearns and Wei-dner (1993), as described in Michlmayr et al. (2008). At the Davos field sites (Sect. 2.3) incoming longwave radiative flux is simulated using the parameterization from Unsworth and Monteith (1975), coupled with a clear-sky emissivity follow-ing Dilley and O’Brien (1998), as described in Schmucki et al. (2014). For the roughness length z0, a value of 0.002 m was used for all simulations at the Davos field sites and WFJ, whereas a value of 0.015 was used for CDP. The model was
initialized with a soil depth of 1.4, 2.2 and 2.14 m (for WFJ, CDP and Davos field sites, respectively) divided into layers of varying thickness. For soil, typical values for coarse ma-terial were chosen to avoid ponding inside the snowpack due to soil saturation. The soil heat flux at the lower boundary is set to a constant value of 0.06 W m−2, which is an approxi-mation of the geothermal heat flux.
2.2 Water transport models
The two previously existing methods for simulating vertical liquid water movement within SNOWPACK are either a sim-ple so-called bucket approach (BA) (Bartelt and Lehning, 2002) or solving the RE, a recently introduced method for SNOWPACK (Wever et al., 2014a, b).
The BA represents liquid water dynamics by an empir-ically determined irreducible water content θr which de-fines whether water stays in the corresponding layer or will be transferred to the layer below. This irreducible wa-ter content varies for each layer according to Coléou and Lesaffre (1998). The RE represents the movement of water in unsaturated porous media. Its implementation in SNOW-PACK and a detailed description can be found in Wever et al. (2014a).
The PF model presented in this study is based on the RE model, but follows a dual-domain approach, dividing the pore space of the snowpack into a part representing matrix flow and a part representing PF. For both domains the RE is solved subsequently. The PF model is described by (i) a function for determining the size of the matrix and prefer-ential flow domain, (ii) the initiation of PF (i.e., water move-ment from matrix flow to PF) and (iii) a return flow condition from PF to matrix flow.
The area of the preferential domain (F )is as a function of grain size (Eq. 1), which has been determined by re-sults of laboratory experiments presented by Katsushima et al. (2013):
F =0.0584rg−1.109, (1)
this threshold is exceeded. This threshold is used as a tuning parameter in the model.
Refreezing of liquid water in the snowpack is crucial for modelling water transport in subfreezing snow and may also be important for modelling PF. The presented PF model has also been used to simulate ice layer formation under the pres-ence of PF by Wever et al. (2016b). Thereby, a sensitivity study on the role of refreeze in the PF domain and the re-turn flow condition from PF to matrix flow was conducted. It was found that neglecting refreeze led to the best results for reproducing ice layer formation, but did not significantly af-fect the performance in reproducing measured hourly snow-pack runoff. Therefore, refreeze in the preferential domain is neglected in the presented study. The threshold in satu-ration for PF (return flow condition) was also determined by the sensitivity study described in Wever et al. (2016b). While they determined a threshold in saturation of 0.1 to re-produce ice-layer observations at WFJ best, a value of 0.06 was determined to reproduce observed seasonal runoff best. We therefore used the value of 0.06. In contrast to Wever et al. (2016b), we did not set the hydraulic conductivity in soil to 0, because this can lead to an inaccurate representation of observed lysimeter runoff due to modelled ponding on soil, which is not expected to happen on a snow lysimeter. Fur-ther details on the implementation of the PF model and its performance can be found in Wever et al. (2016b).
In summary, the PF model accelerates liquid water trans-port in the preferential domain by concentrating water mass in a smaller area, representing the area fraction of flow fin-gers in the snowpack. The saturation in the preferential do-main is hence higher and unsaturated conductivity is larger. Further acceleration is achieved by disabling refreeze in the preferential domain.
2.3 Davos field sites
Four field sites have been installed within an elevational range of 950 to 1850 m a.s.l. in the vicinity of Davos, Switzerland, with one meteorological station and 3–4 snow lysimeters each (15 in total, 0.45 m diameter). The meteo-rological stations provided most data necessary for running the SNOWPACK model and missing parameters were esti-mated as described in Sect. 2.1. Lysimeters were installed at ground level with an approximate spacing of 10 m horizon-tal distance. The lysimeters consisted of a funnel attached to a precipitation gauge buried in the ground, which monitored snowpack runoff with a tipping bucket. To block lateral in-flow at the snow-soil interface, each lysimeter was equipped with a rim of 5 cm height around the inlet. The multiple snow lysimeter setups allowed analysing the spatial heterogene-ity of snowpack runoff. Snowpack properties (SWE, LWC, HS, TS) were manually measured directly before each natu-ral ROS event so that the initial conditions of the snowpack are known in detail. LWC was measured with the “Denoth meter”, a device introduced by Denoth (1994). The onset of
runoff was defined as the time when cumulative snowpack runoff (measured and simulated, respectively) has reached 1 mm.
2.4 Sprinkling experiment description
During winter 2014/15, a total of six artificial sprinkling ex-periments were performed on all four Davos field sites de-scribed above to be able to investigate snowpack runoff gen-eration for different snowpack properties (Table 1). For each experiment, a sprinkling device was placed above a snow lysimeter, covered by an undisturbed natural snowpack, i.e. each lysimeter was only used for one experiment. The de-vice used for sprinkling was a refined version of the portable sprinkling device described in Juras et al. (2013, 2016a). The water used for sprinkling was mixed with the dye tracer Bril-liant Blue FCF (concentration 0.4 g L−1) to be able to ob-serve PFPs within the snowpack. Sprinkling was performed in four bursts of 30 min each, interrupted by 30 min breaks. Sprinkling was conducted over a 2×2 m plot centred above the lysimeters, and with an intensity of 24.7 mm h−1, leading to a total of 49.4 mm artificial rain in each of the experiments. The intensities were determined by calibration experiments on lysimeters not covered by snow and are valid for a certain distance between the nozzle and the sprinkled surface and water pressure at the nozzle. Despite the fact that this value still represents a very intense ROS event, it is within range of natural ROS events and similar or much lower compared to previous studies (19 mm h−1; Eiriksson et al., 2013; 48– 100 mm h−1; Singh et al., 1997). For the sprinkling experi-ments, the exact timing of rain and intensities are known and the snowpack runoff measured at 1 min intervals allowed pre-cise analysis of the performance of model simulations. Fig-ure 1 shows a vertical cut of a snowpack after the sprinkling experiment and a top view of the lysimeter after the snow-pack was removed for cold and wet conditions, respectively. The blue colour indicates where water transport took place and where sprinkled water was held by capillary forces or refrozen.
2.5 Extensive dataset for in situ validation
Figure 1. (a)Vertical cut of a snowpack after the sprinkling ex-periment Sertig Ex3 (28 February 2015). Lateral flow and the pres-ence of PFP were observed. PFP were generated at regions with rain water ponding at ice layers and layer boundaries with a change in grain size (creating capillary barriers). (b) Lysimeter area af-ter sprinkling during winaf-ter conditions (Serneus Ex1, 26 Febru-ary 2015): coloured areas indicate the area where water percolated due to PF. (c)Lysimeter area after sprinkling during spring con-ditions (Klosters Ex4, 26 March 2015): coloured area shows that water percolated uniformly, indicating dominating matrix flow.
snowpack produces snowpack runoff more often throughout the entire snow season and ROS events are more frequent than at WFJ. A multi-week snowpack builds up every win-ter season at CDP, but is, in contrast to WFJ, inwin-terrupted by complete melt in some years. The WFJ site is equipped with a 5 m2snow lysimeter, which measures the liquid water runoff from the snowpack. It has a 60 cm high rim to reduce lat-eral flow effects near the soil–snow interface (Wever et al., 2014a). CDP is equipped with both a 5 and a 1 m2 lysime-ter. Here we use data from the 5 m2lysimeter, but include data from the 1 m2lysimeter to discuss the uncertainty asso-ciated with measurements of the snowpack runoff. The stud-ied period for WFJ is from 1 October 1999 to 30 Septem-ber 2013 (14 hydrological years). Because of possible er-rors in the lysimeter data in the winter seasons of 1999/00 and 2004/05 as described in Wever et al. (2014a), these data were excluded from the study. For CDP the studied period is from 1 October 1994 to 31 July 2011 (17 winter sea-sons) according to the data availability from the 5 m2 lysime-ter. The temporal resolution of lysimeter data is 1 h for CDP and 10 min for WFJ. Simulation results for CDP and WFJ as well as lysimeter data for WFJ were aggregated to an hourly timescale.
Figure 2. (a)Example of a ROS event occurring at WFJ. The entire extent of thexaxis refers to the evaluation period; the bar above the xaxis refers to the event length.(b)Cumulative version of the plot.
2.6 CDP+WFJ event definition
As the number and characteristics of ROS events are strongly dependent on the event definition, special care needs to be taken to determine beginning and end of a ROS event. Being interested in the temporal characteristics of snowpack runoff during ROS, we need to include the entire period from the on-set of rain to the end of ROS-induced snowpack runoff. Here we use an event definition according to Würzer et al. (2016) with slightly decreased thresholds to identify ROS events. According to this definition, a ROS event requires a mini-mum amount of 10 mm rainfall to fall within 24 h on a snow-pack with a height of at least 25 cm at the onset of rainfall. While the event is defined to begin once the first 1 mm of rain has fallen, the event ends once there is less than 3 mm of cu-mulative snowpack runoff recorded within the following 5 h. This definition resulted in a selection of 61 events at CDP and 40 events at WFJ. The model simulations were subsequently evaluated over a time window that extends the event length by 5 and 10 h at the beginning and end, respectively (Fig. 2). These extended evaluation periods allowed us to also inves-tigate a possible temporal mismatch between modelled and observed snowpack runoff.
3 Results
3.1 Experimental sprinkling experiments
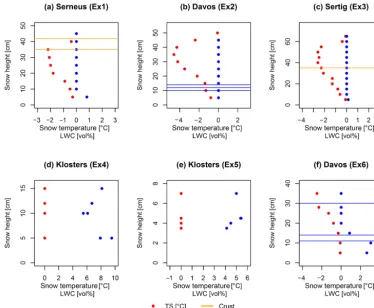
[image:5.612.307.548.65.182.2] [image:5.612.50.286.66.275.2]Figure 3.Snow temperature and LWC profiles measured directly before the sprinkling experiment started. The lines represent observed ice layers (blue) and crusts (orange).
Table 1.Snowpack pre-conditions and execution dates for the sprinkling experiments as well asR2values for the different model simulations. Measured values are snow height (HS), bulk liquid water content (LWC), bulk snow temperature (TS). No snowpack runoff measurements were available for Sertig (Ex3).
Initial snowpack R2of hourly runoff conditions of the simulations
Experiment HS LWC TS Date RE PF BA
[cm] [% vol] [◦C]
Serneus (Ex1) 48.5 0.1 −1.3 26-Feb-15 0.14 0.59 0.09 Davos (Ex2) 54.5 0.4 −2.5 27-Feb-15 0.24 0.62 0.08
Sertig (Ex3) 71.5 0 −1.6 28-Feb-15 – – –
Klosters (Ex4) 15.7 6.9 0 26-Mar-15 0.75 0.96 0.86 Klosters (Ex5) 7 4.9 0 8-Apr-15 0.70 0.84 0.88 Davos (Ex6) 39.3 0.9 −0.6 10-Apr-15 0.58 0.83 0.36
separated into two cases: the first three experiments were conducted on dry and cold (i.e. below the freezing point) snow and will be called winter experiments. The snowpack of Ex4 and Ex5 was isothermal and in a wet state. At the on-set of Ex6 however, part of the snowpack was below freezing and had just little LWC. Nevertheless, the snowpack already passed peak SWE and was in its ablation phase. Therefore
the later three experiments (Ex4–Ex6) will be referred to as spring experiments in the following.
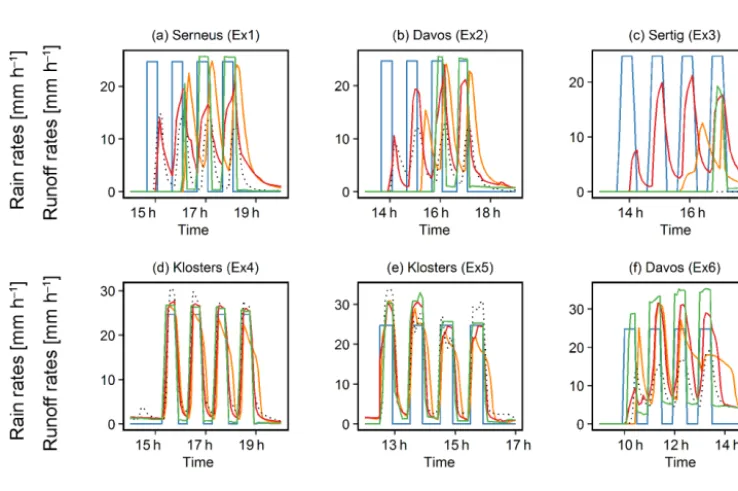
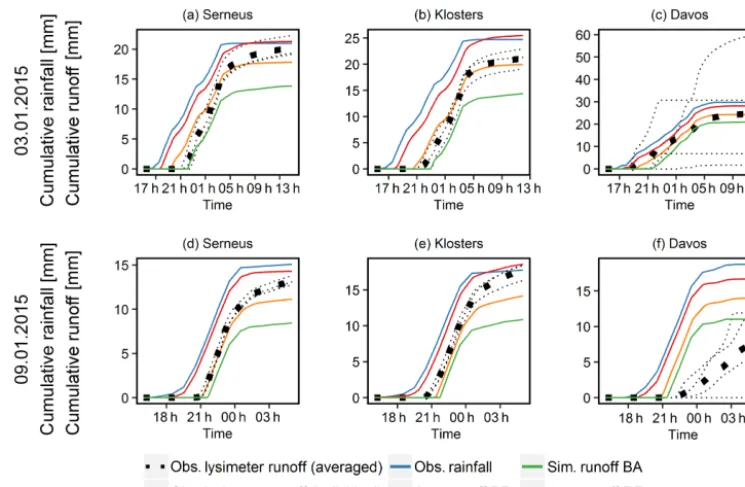
[image:6.612.149.446.464.592.2]sprin-kled rain was retained as LWC at the end of the experi-ments. During Ex3 no snowpack runoff was observed, vi-sual inspection afterwards revealed an impermeable ice layer covering both the lysimeter and the adjacent ground. During spring conditions, on the other hand, snowmelt (5.1, 8.4 and 27.4 mm respectively) led to snowpack runoff exceeding to-tal sprinkling input, except for measured snowpack runoff in Ex6 (Figs. 4 and 5d, e, f).
Additionally, Fig. 5 shows that only the PF model was able to reproduce all four peaks of observed snowpack runoff for winter conditions (Ex1+2), and even the magnitude of the first peak of Ex1 was captured well. For spring condi-tions however, all three models managed to represent four peaks corresponding to the four sprinkling bursts, but the PF model showed best correspondence with observed snowpack runoff (Figs. 4 and 5d, e, f; Table 1). Regarding the onset of snowpack runoff, the PF model especially led to faster snow-pack runoff for the first two winter experiments, where the RE and BA models showed delayed snowpack runoff onset. For spring conditions the faster snowpack runoff response of the PF model led to a slightly early snowpack runoff. Maxi-mal snowpack runoff rates for dry and cold conditions were generally overestimated by all models, whereas wetter condi-tions led to a minor underestimation (except for Ex3, where no snowpack was measured).
Regarding the overall correlation between measured and simulated snowpack runoff, PF outperformed the other mod-els (Table 1), in particular during winter conditions. Summa-rizing, this initial assessment suggests that the PF approach has potential advantages in particular (a) as to the timing of snowpack runoff and (b) for cold snowpacks which are not yet entirely ripened.
3.2 Natural occurring ROS events
In January 2015, two ROS events occurred in the vicinity of Davos. They were observed over an elevational range of 950 to 1560 m a.s.l. on the same sites on which also the sprinkling experiments were conducted. Figure 6 shows the course of cumulative rainfall and snowpack runoff for both dates and all sites. Pre-event conditions (HS, LWC, TS) were measured shortly before the onset of rain for both events and are shown together with coefficients of determination (R2)for hourly snowpack runoff of the different models Table 2.
For the event of 3 January 2015 (Fig. 6, upper row) the lower sites Serneus and Klosters (950 and 1200 m a.s.l.) showed a similar snowpack runoff dynamics regarding the delayed onset and the total amount (cumulative sum averaged over the three corresponding lysimeters: 20.3 and 21.1 mm, respectively). Also, the heterogeneity between data from the individual lysimeters was relatively low (Range of 3.1 and 3.9 mm, respectively). For the highest located site (Davos), however, the snowpack runoff measured by all four lysime-ters showed a greater variability (Fig. 6c) in the delayed on-set of snowpack runoff (0 to 7 h) and the total amount of
snowpack runoff (mean 24.7 mm; range of 57.9 mm). The snow cover mostly built up within 1 week before the event. Cold temperatures led to a light melt refreeze crust at the top, but no distinct ice layers were observed. For the lower sites (Serneus and Klosters), the PF and RE models gener-ated snowpack runoff too early (PF: approx. 3 h; RE: 0.2 to 1.4 h). The BA model generated snowpack runoff rather too late (1.3 to 2 h), but still within range of the variabil-ity of observed snowpack runoff for Serneus. However, the cumulative lysimeter snowpack runoff showed good accor-dance with modelled PF and RE snowpack runoff at Serneus, whereas PF led to an overestimation at Klosters and BA to an underestimation of cumulative snowpack runoff at all sites. At the higher-elevation site Davos, the RE model led to a better representation of mean observed snowpack runoff amount, when compared with BA and PF. The mean ob-served snowpack runoff onset however was represented best by the PF model (0.3 h early) when compared to the BA (3.4 h delay) and RE (1.1 h delay).
For the event of 9 January 2015 (Fig. 6, bottom row) the lower sites showed again little temporal and spatial heterogeneity in lysimeter runoff (range of 1 and 2.2 mm, respectively), whereas this was more the case for Davos again (range of 13.3 mm) probably owing to ice layers that were formed after the event on 3 January. Observed mean event snowpack runoff was more diverse for all elevations, where Klosters had the highest cumulative snowpack runoff (Serneus 13.3 mm; Klosters 17.7 mm; Davos 7.8 mm). If compared to observed total snowpack runoff, the PF model overestimated snowpack runoff for Serneus and Klosters, whereas the RE and especially the BA model underestimate event snowpack runoff for both sites. For Davos, all models were overestimating event snowpack runoff and led to early snowpack runoff. Apart from the RE model, which repre-sented onset of snowpack runoff correctly for Serneus, none of the models were able to model snowpack runoff onset cor-rectly for any of the sites.
3.3 Validation on an long-term dataset
3.3.1 Modelled and observed snowpack runoff for the whole dataset
Given the partly contradictory findings on the performance of the three model variants based on the above assessment for artificial ROS simulations under controlled conditions (Sect. 3.1), as well as natural ROS events (Sect. 3.2), further more systematic model tests were needed. Therefore we val-idate the different models based on extensive datasets from the two sites WFJ and CDP, as described in Sect. 2.4.
Figure 4.Cumulative rain and snowpack runoff displayed for the six sprinkling events. Ex1(a)–Ex3 (c)were conducted during winter conditions, Ex4(d)–Ex6(f)were conducted during spring conditions.
Figure 5.Rain and snowpack runoff displayed as hydrographs for the six sprinkling events. Ex1(a)–Ex3(c)were conducted during winter conditions, Ex4(d)–Ex6(f)were conducted during spring conditions.
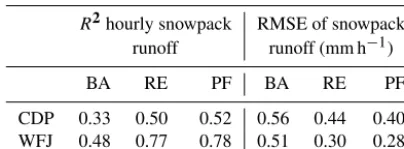
provided snow heights exceeded 10 cm to ensure that lysime-ter runoff was caused by snowpack runoff and not rainfall. For both sites, R2 values for PF were slightly higher than for RE (Table 3), which both clearly outperformed the BA. The root mean squared errors (RMSEs) of the PF model were also lower compared to RE and BA. We can therefore
[image:8.612.112.481.351.596.2]Figure 6.Natural ROS events on 3 and 9 January 2015 in(a, d)Serneus,(b, e)Klosters and(c, f)Davos.
Table 2.Snowpack pre-conditions andR2for hourly snowpack runoff for natural events on 3 and 9 January.
Site Pre-event snowpack R2for hourly conditions snowpack runoff
HS LWC TS RE PF BA
(cm) (% vol) (◦C)
03-Jan-2015 Serneus 19 0 0 0.63 0.35 0.83 Klosters 24 0 −0.1 0.72 0.39 0.78 Davos 20 0 −0.4 0.27 0.33 0.17
09-Jan-2015 Serneus 14.5 0.1 −0.2 0.94 0.57 0.79 Klosters 18 0.1 −0.2 0.84 0.73 0.73 Davos 19.5 0.1 −0.6 0.00 0.04 0.00
3.3.2 ROS event characteristics of the extensive dataset
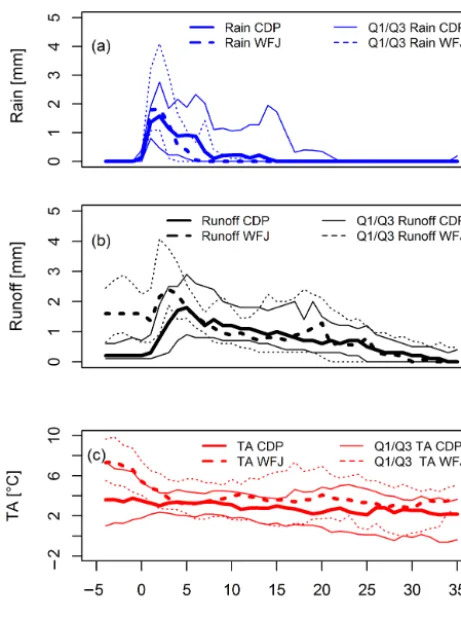
Median characteristics of the individual ROS events at CDP and WFJ are summarized in Fig. 7. The temporal course of median rain and snowpack runoff rates of all events at WFJ (40 individual events) and CDP (61 individual events) are shown in Fig. 7a, b. ROS events at WFJ showed gener-ally higher maximum rain intensities than at CDP, leading to higher median snowpack runoff intensities at the begin-ning of the events. Whereas at WFJ, ROS events tended to be short and intense, at CDP the event rainfall extended over a longer period of time. Interestingly, we observed relatively high initial snowpack runoff rates before the actual beginning of the ROS event, especially for WFJ, which suggests that many ROS events at this site occurred during the snowmelt period. Median snowpack runoff reached a peak after 1 and
[image:9.612.158.439.369.501.2]Figure 7.Temporal course of median rain(a), measured snowpack runoff(b)and air temperature(c)for WFJ (dotted) and CDP (solid) aggregated over all 40 and 61 events respectively. The thinner lines represent the lower and upper quartiles, respectively. The displayed period is extended by 5 h prior to event commencement according to the event definition (0 h).
3.3.3 Modelled and observed snowpack runoff at the event scale
Below we investigate the performance of the three water transport schemes at the event scale. Modelled snowpack runoff was assessed against observations by the coefficient of determination (R2) and the RMSEs. To further analyse the representation of snowpack runoff timing, we defined an absolute time lag error (TLE) as the difference between the onsets of modelled and observed snowpack runoff in hours. The onset of snowpack runoff is defined as the time when cumulative snowpack runoff has reached 10 % of total event-snowpack runoff.
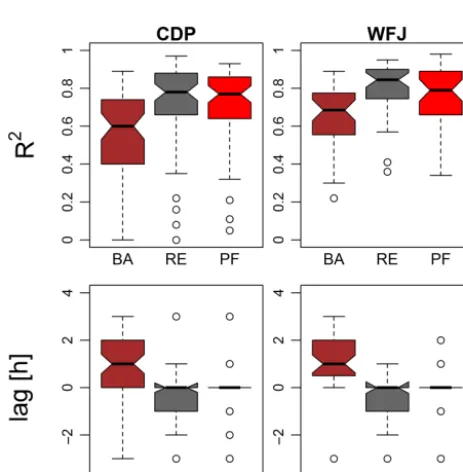
Figure 8 shows box plots of R2(a, d), RMSE (b, e) and absolute TLE (c, f) for all 40 ROS events at WFJ (a, b, c) and 61 events at CDP (d, e, f), respectively. For both sites, R2values show that the BA model performance was inferior to the RE model which was in turn slightly outperformed by the PF model. The interquartile range ofR2values for CDP was generally higher than for WFJ and increased from BA to RE, whereas it was decreasing for PF. The PF also led to a
re-duction in RMSE by approximately 50 % if compared to the BA, but less (9 % for WFJ and 25 % for CDP) if compared to the RE model. Whereas the median of TLEs for all mod-els at WFJ was 0 and therefore all modmod-els reproduced the onset of snowpack runoff very well, the interquartile range decreased from BA to the RE and PF models. The same be-haviour in interquartile range decrease could be observed for CDP, where the magnitude of TLE was higher than for WFJ and mostly negative. The median TLE was again 0 for the PF and−1 h in the case of BA and RE, indicating that for these models, snowpack runoff was on average a bit delayed com-pared to the observations. For WFJ, TLE for BA was more often positive (early modelled snowpack runoff), which led to a very good median for BA, but also a larger interquartile range. Hence, the PF model showed the most consistent re-sults, especially if regarding the interquartile range. For CDP we added the comparison between the 1 and 5 m2lysimeters installed at CDP (Sect. 2.5) as a reference to Fig. 8, referred to as RL. This comparison can be seen as a benchmark per-formance, as it represents the measurement uncertainty of the validation dataset. As expected, RL shows the highest over-all performance measures, but while the results for both PF and RE were reasonably close to those of RL, the BA model performed considerably worse.
The results shown in Fig. 8 may be influenced by both a time lag as well as the degree of reproduction of temporal dynamics. To separate both effects, we conducted a cross-correlation analysis, allowing a shift of up to 3 h to find the bestR2value. Figure 9 shows both the time lag, as well as the bestR2value achieved. Interestingly, the BA model showed best correlations if the modelled snowpack runoff was shifted by 1 or 2 h (consistently too early compared to observations). The RE model, on the other hand, showed best correlations for a shift in the other direction (consistently too late com-pared to observations). Neither was the case for PF with lags centred around 0.
TheR2of the cross-correlation analysis gives some indi-cation of how well the temporal dynamics of the observed snowpack runoff can be reproduced, neglecting a possible time lag. The results in Fig. 9 show an improvement inR2 values for both sites and all models if a time lag is applied. Greatest improvements were observed for the BA model for both sites. The good timing with the PF model is confirmed by almost no lag for WFJ and only a small lag for CDP needed to maximizeR2. For CDP, both RE and PF had max-imizedR2values in range of the lysimeter comparison (RL).
4 Discussion
trans-Figure 8.RMSE,R2and TLE for simulations of 61 ROS events at the CDP site and of 40 ROS events at the WFJ site for all models (BA, RE, PF) and the reference lysimeter (RL) available only for CDP.
Figure 9. Best R2 values and corresponding lags using a cross-correlation function allowing a time shift (lag) of max±3 h.
port scheme can improve the prediction of snowpack runoff dynamics for individual ROS events as well as for the snow-pack runoff of entire snow seasons. Moreover, the
represen-tation of the onset of snowpack runoff is improved. This is particularly important at the catchment scale, where a delay of snowpack runoff relative to the start of rain may affect the catchment runoff generation, especially if the time lag varies across a given catchment.
[image:11.612.51.283.391.627.2]Table 3.R2and mean absolute errors for hourly snowpack runoff for 17 and 14 years, for CDP and WFJ, respectively.
R2hourly snowpack RMSE of snowpack runoff runoff (mm h−1)
BA RE PF BA RE PF
CDP 0.33 0.50 0.52 0.56 0.44 0.40 WFJ 0.48 0.77 0.78 0.51 0.30 0.28
and Ex2), and missed approx. 10 mm of snowpack runoff within the first hour of observed runoff. This can partly be explained by the fact that BA and RE need to heat up the subfreezing snowpack before they can generate snowpack runoff, whereas refreezing is neglected in the preferential do-main of the PF model and runoff can occur even in a not yet isothermal snowpack. Adjusting parameters like the irre-ducible water content θr for the BA model could probably lead to earlier runoff under these conditions, but thereby lead to earlier runoff, for example for WFJ events, where TLE al-ready is positive for several events.
Despite the improved representation of the temporal runoff dynamics of the PF model (Table 1), the total event runoff of both RE and PF models is very similar for most conditions. Notably, the total event runoff for dry snowpacks is mostly overestimated by all models, suggesting an underestimation of water held in the capillarities. In cold snowpacks, dendric-ity of snow grains may still be high, such that water reten-tion curves developed for rounded grains underestimate the suction. Additionally, high lateral flow was observed during the experiment for those conditions (Fig. 1a). This leads to an effective loss of sprinkling water per surface area of the lysimeter, which of course cannot be reproduced by the mod-els. Therefore, observed snowpack runoff likely underesti-mates the snowpack runoff that would have resulted from an equivalent natural ROS event and we assume that the perfor-mance of the PF and RE models to capture the event runoff is probably better than reported in Table 1. Note that neglect-ing refreeze in the PF model should not be accountable for differences in the total event runoff between the RE and PF model, if we assume that the cold content is depleted by the end of the event.
Interestingly, despite having the coldest snowpack, time lag for the first natural ROS event at Davos was shorter than for the other two sites. This relationship where a cold and non-ripe snowpack with low bulk density led to smaller lag times was also found during sprinkling experiments con-ducted by Juras et al. (2016b). We assume that this is an in-dication for the presence of pronounced PFPs under those conditions, which is also supported by the high spatial vari-ability of snowpack runoff. Glass et al. (1989) state that the fraction of PF per area is decreasing with increasing perme-ability, which itself was found to be increasing with porosity
(Calonne et al., 2012). Therefore, with a decreasing PF area due to lower densities, the cold content of a snowpack loses importance, but saturated hydraulic conductivity is reached faster within the PFPs. The combination of those effects then is suspected to lead to earlier runoff. This behaviour should be ideally reproduced by the PF model and indeed the on-set of runoff is caught well for this event. Here, our multi-lysimeter setup raises the awareness that the observed pro-cesses can show considerably spatial heterogeneity as docu-mented, for example, in Fig. 6. The formation of ice layers also underlies spatial heterogeneity. Moreover, the creation of PFPs is strongly dependent on structural features like grain size transitions leading to capillary barriers. Unfortunately, no detailed information about grain size is available in the observations to verify this.
The PF model led to improvements in reproducing hourly runoff rates at CDP and WFJ for a dataset comprising several years of runoff measurements. This is an important finding, demonstrating that the new water transport scheme aimed at a better representation of PF during ROS events, did not neg-atively impact on the overall robustness of the model. To the contrary, the overall performance over entire seasons could even be improved. All three models represent the overall sea-sonal runoff better for WFJ than for CDP (Table 3), which was also found on the event scale (Fig. 8). Moreover, the CDP simulations exhibit a larger interquartile range in R2 values and are therefore generally less reliable. The observed differences in model performance between both sites may ei-ther be caused by differences in snowpack or meteorological conditions or by issues with the observational data. More-over, SNOWPACK developments have in the past often been tested with WFJ data, which could lead to an unintended cal-ibration favouring model applications at this site. Despite an obvious contrast in the elevation of both sites, the average conditions during ROS events seem to vary. Figure 7 sug-gests that at WFJ short and rather intense rain events domi-nate. The higher maximum rain intensities at WFJ, compared to CDP, are probably due to the later occurrence of ROS at this site (May–June), where air temperatures and therefore rain intensities are usually higher than earlier in the season (Molnar et al., 2015). Regarding mean intensities over the event scale, data shown in Fig. 7 further imply that short and intense ROS events typically attenuate the rain input (ratio runoff to rain < 1), whereas long ROS events rather lead to additional runoff from snowmelt, which is in line with results presented in Würzer et al. (2016).
Table 4.Pearson correlation coefficients between event-R2and stratigraphic features at WFJ and CDP. Stratigraphic features are marked grain size changes (bigger than 0.5 mm) and density changes (bigger than 100 kg m−3) in two adjacent simulated layers as well as the wet layer ratio (percentage of layers exceeding 1 % vol over layers below 1 % vol) and the percentage of melt forms.
Pearson correlation coefficient between eventR2and the following: no. of grain no. of ratio of wetting size changes density changes melt forms ratio
WFJ PF −0.44 −0.45 −0.16 −0.20
RE −0.54 −0.47 0.17 0.13
BA −0.56 0.16 −0.11 −0.09
CDP PF −0.14 0.07 0.37 0.39
RE −0.19 0.12 0.57 0.66
BA −0.11 −0.26 0.15 0.14
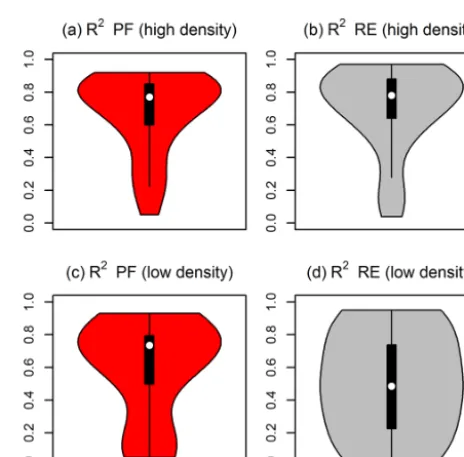
450–500 kg m−3, whereas for CDP densities are spread from around 200 kg m−3up to 500 kg m−3. This suggests that the variable performance of all models at CDP (Fig. 8d) may be associated with early season ROS events. At CDP, a lin-ear regression fit suggests a positive, albeit weak correlation between snowpack bulk densities and event-R2for the RE (R2of 0.2), but no correlation for both the PF and the BA model. It seems that the RE model had some difficulties with low-density snow, which was not the case for the PF model (Fig. 10). This may explain why PF outperformed RE at CDP, but not for WFJ.
Remaining inaccuracies in the representation of runoff for low densities for both models applying the RE may be ex-plained by the fact that the water retention curve have been derived by laboratory measurements with high-density snow samples (Yamaguchi et al., 2012). The parameters defining the PF area (F )have also been developed from snow sam-ples with a density mostly above 380 kg m−3(Katsushima et al., 2013).
We further analysed snowpack stratigraphy derived from the SNOWPACK simulations, such as marked grain size changes (bigger than 0.5 mm) and density changes (bigger than 100 kg m−3)in two adjacent simulated layers as well as the wet layer ratio (percentage of layers exceeding 1 % vol over layers below 1 % vol) and the percentage of melt forms (Table 4). These stratigraphy measures represent possible capillary barriers having implications on the single event-R2 and might help understanding the advantages and disadvan-tages of the different models. Any considerable correlation between the abundance of stratigraphy features and event-R2would be indicative of potential errors in the respective model. Negative albeit small correlations could be found be-tween the number of grain size changes and the event-R2 for WFJ. Similar correlations were noted with regards to the number of changes in density between layers for the RE and PF model. In both cases correlations were less negative for the PF model indicating a more balanced and ultimately less degraded performance with increasing number of potential capillary barriers. While at WFJ most events occurred with
Figure 10.Distribution of event-R2for CDP events for the PF(a, c)and RE(b, d)model. The sample is split into initial bulk snow densities above 350 kg m−3(a, b)and below 350 kg m−3(c, d).
ripe snow this was not the case for CDP. There, positive cor-relations were found between the ratio of melt forms and the wet layer ratio with event-R2for the RE model (Pearson’sR of 0.57 and 0.66) and for the PF model (Pearson’sRof 0.37 and 0.39). In this case the PF model also showed more bal-anced results that were less influenced by the initial LWC, which is in line with our findings of the sprinkling experi-ments.
[image:13.612.312.544.251.480.2]from Katsushima et al. (2013), these rates still exceeded what seems representative of natural ROS events. We therefore analysed the effect of system input rates on the performance of our water transport models. Positive, albeit weak correla-tions (R2of 0.07 to 0.21) could be observed between event-R2and system input rates for all models, suggesting that they generally performed (slightly) better for higher influx rates. For the PF model this could probably be explained by the PF parameters depending on laboratory measurements with high influx rates.
In combination with the hydraulic properties for lower-density snow samples, additional laboratory experiments might be able to determine the number and size of PFPs for lower input intensities and snow densities. Especially the calibrated parameters threshold for saturation (2th)and the number of PFPs for refreeze (N) could benefit from such experimental studies. Even though CDP and WFJ provide long-term measurements on an adequate temporal resolu-tion, these data give little information about spatial variabil-ity of snowpack runoff limiting further validation opportu-nities. Large area multi-compartment lysimeter setups might help to improve estimating size, amount and spatial hetero-geneity of flow fingers. Sprinkling experiments with prefer-ably low sprinkling intensities on such a device could fill a knowledge gap about water transport in snow under naturally occurring conditions.
5 Conclusions
A new water transport model is presented that accounts for PF of liquid water within a snowpack. The model de-ploys a dual-domain approach based on solving the Richards equation for each domain separately (matrix and preferential flow). It has been implemented as part of the physics-based snowpack model SNOWPACK which enables us for the first time to account for PFPs within a model framework that is used operationally for avalanche warning purposes and snow melt forecasting.
The new model was tested for sprinkling experiments over a natural snowpack, dedicated measurements during natural ROS events, and an extensive evaluation over 101 historic ROS events recorded at two different alpine long-term re-search sites. This assessment led to the following main con-clusions.
Compared to alternative approaches, the model accounting for preferential flow (PF) demonstrated an improved overall performance, particularly for lower densities and initially dry snow conditions. This led to smallest interquartile ranges for R2 values and considerably decreased RMSEs for a set of more than 100 ROS events. When evaluated over entire win-ter seasons, the performance statistics were superior to those of a single domain approach (RE), even if the differences were small. Both PF and RE models, however, outperformed the model using a bucket approach (BA) by a large margin
(increasing medianR2 by 0.49 and 0.48 for WFJ and 0.53 and 0.48 for CDP). In sprinkling experiments with 30 min bursts of rain at high intensity, the PF model showed a sub-stantially improved temporal correspondence to the observed snowpack runoff, in direct comparison to the RE and BA models. While the improvements were small for experiments on isothermal wet snow, they were pronounced for experi-ments on cold snowpacks.
Model assessments for over 100 ROS events recorded at two long-term research sites in the European Alps revealed rather variable performance measures on an event-by-event basis between the three models tested. The BA model tended to predict too early onset of snowpack runoff for wet snow-packs and a delayed onset of runoff for cold snowsnow-packs, whereas RE was generally too late, especially for CDP. Com-bined with results from a separate cross-correlation analysis, results suggested the PF model to provide the best perfor-mance concerning the timing of the predicted runoff.
While there is certainly room for improvements of our ap-proach to account for PF of liquid water through a snowpack, this study provides a first implementation within a model framework that is used for operational applications. Adding complexity to the water transport module did not negatively impact on the overall performance and could be done without compromising the robustness of the model results.
Improving the capabilities of a snowmelt model to accu-rately predict the onset of snowpack runoff during a ROS event is particularly relevant in the context of flood forecast-ing. In mountainous watersheds with variable snowpack con-ditions, it may be decisive if snowpack runoff occurs syn-chronously across the entire catchment, or if the delay be-tween onset of rain and snowpack runoff is spatially variable, e.g. with elevation. In this regard, accounting for PF is a nec-essary step to improve snowmelt models, as shown in this study.
Data availability. Meteorological driving data for the SNOW-PACK model as well as the lysimeter data are accessible via doi:10.16904/1 (WSL Institute for Snow and Avalanche Research SLF, 2015) for WFJ and under doi:10.5194/essd-4-13-2012 (Morin et al., 2012) for CDP. All other meteorological and lysimeter data are available on request. The SNOWPACK model is available under a LGPLv3 licence at http://models.slf.ch. The version used in this study corresponds to revision 1249 of /branches/dev.
Competing interests. The authors declare that they have no conflict of interest.
of ideas during the experiments. We would also like to thank Timea Mareková and Pascal Egli for their help during the experiments. Finally, we acknowledge the two anonymous referees for their the helpful comments, which helped to improve the paper.
Edited by: C. De Michele
Reviewed by: two anonymous referees
References
Badoux, A., Hofer, M., and Jonas, T.: Hydrometeorologis-che Analyse des Hochwasserereignisses vom 10. Okto-ber 2011, Tech. Rep., WSL/SLF/MeteoSwiss, available at: http://www.wsl.ch/fe/gebirgshydrologie/wildbaeche/projekte/ unwetter2011/Ereignisanalyse_Hochwasser_Oktober_2011.pdf (last access: 6 February 2017), 92 pp., 2013 (in German). Bartelt, P. and Lehning, M.: A physical SNOWPACK model for
the Swiss avalanche warning Part I: numerical model, Cold Reg. Sci. Technol., 35, 123–145, doi:10.1016/S0165-232x(02)00074-5, 2002.
Calonne, N., Geindreau, C., Flin, F., Morin, S., Lesaffre, B., Rol-land du Roscoat, S., and Charrier, P.: 3-D image-based numeri-cal computations of snow permeability: links to specific surface area, density, and microstructural anisotropy, The Cryosphere, 6, 939–951, doi:10.5194/tc-6-939-2012, 2012.
Colbeck, S. C.: A theory of water percolation in snow, J. Glaciol., 11, 369–385, 1972.
Coléou, C. and Lesaffre, B.: Irreducible water saturation in snow: experimental results in a cold laboratory, Ann. Glaciol., 26, 64– 68, 1998.
Conway, H. and Benedict, R.: Infiltration of water into snow, Water Resour. Res., 30, 641–649, doi:10.1029/93WR03247, 1994. Denoth, A.: An electronic device for long-term snow wetness
recording, Ann. Glaciol., 19, 104–106, 1994.
DiCarlo, D. A.: Stability of gravity-driven multiphase flow in porous media: 40 Years of advancements, Water Resour. Res., 49, 4531–4544, doi:10.1002/wrcr.20359, 2013.
Dilley, A. and O’Brien, D.: Estimating downward clear sky long-wave irradiance at the surface from screen temperature and precipitable water, Q. J. Roy. Meteor. Soc., 124, 1391–1401, doi:10.1002/qj.49712454903, 1998.
Eiriksson, D., Whitson, M., Luce, C. H., Marshall, H. P., Bradford, J., Benner, S. G., Black, T., Hetrick, H., and McNamara, J. P.: An evaluation of the hydrologic relevance of lateral flow in snow at hillslope and catchment scales, Hydrol. Process., 27, 640–654, doi:10.1002/hyp.9666, 2013.
Freudiger, D., Kohn, I., Stahl, K., and Weiler, M.: Large-scale anal-ysis of changing frequencies of rain-on-snow events with flood-generation potential, Hydrol. Earth Syst. Sci., 18, 2695–2709, doi:10.5194/hess-18-2695-2014, 2014.
Gerdel, R. W.: The transmission of water through snow, EOS T. AGU, 35, 475–485, 1954.
Glass, R., Steenhuis, T., and Parlange, J.: Wetting Front Instability, 2, Experimental Determination of Relationships Between Sys-tem Parameters and Two-Dimensional Unstable Flow Field Be-havior in Initially Dry Porous Media, Water Resour. Res., 25, 1195–1207, doi:10.1029/WR025i006p01195, 1989.
Hirashima, H., Yamaguchi, S., and Katsushima, T.: A multi-dimensional water transport model to reproduce preferential flow in the snowpack, Cold. Reg. Sci. Technol., 108, 80–90, doi:10.1016/j.coldregions.2014.09.004, 2014.
Illangasekare, T. H., Walter, R. J., Meier, M. F., and Pfeffer, W. T.: Modeling of meltwater infiltration in subfreezing snow, Water Resour. Res., 26, 1001–1012, 1990.
Jordan, R.: A one-dimensional temperature model for a snow cover, Technical documentation for SNTHERM, No. CRREL-SR-91-16, Cold Regions Research and Engineering Lab Hanover NH, 89, DTIC Document, 1991.
Juras, R., Pavlásek, J., Dˇed, P., Tomášek, V., and Máca, P.: A portable simulator for investigating rain-on-snow events, Z. Ge-omorphol. Supp., 57, 73–89, 2013.
Juras, R., Pavlásek, J., Vitvar, T., Šanda, M., Holub, J., Jankovec, J., and Linda, M.: Isotopic tracing of the outflow during artificial rain-on-snow event, J. Hydrol., 541, 1145–1154, doi:10.1016/j.jhydrol.2016.08.018, 2016a.
Juras, R., Würzer, S., Pavlásek, J., Vitvar, T., and Jonas, T.: Rainwa-ter propagation through snow pack during rain-on-snow events under different snow condition, Hydrol. Earth Syst. Sci. Discuss., doi:10.5194/hess-2016-612, in review, 2016b.
Katsushima, T., Yamaguchi, S., Kumakura, T., and Sato, A.: Experimental analysis of preferential flow in dry snowpack, Cold Reg. Sci. Technol., 85, 206–216, doi:10.1016/j.coldregions.2012.09.012, 2013.
Kattelmann, R.: Spatial Variability of Snow-Pack Outflow at a Site in Sierra Nevada, U.S.A., Ann. Glaciol., 13, 124–128, 1989. Kattelmann, R.: Flooding from rain-on-snow events in the Sierra
Nevada, IAHS-AISH P., 239, 59–66, 1997.
Kroczynski, S.: A comparison of two rain-on-snow events and the subsequent hydrologic responses in three small river basins in Central Pennsylvania, Eastern Region Technical Attachment, 4, 1–21, 2004.
Leathers, D. J., Kluck, D. R., and Kroczynski, S.: The severe flooding event of January 1996 across north-central Pennsyl-vania, B. Am. Meteorol. Soc., 79, 785–797, doi:10.1175/1520-0477(1998)079<0785:TSFEOJ>2.0.CO;2, 1998.
Lehning, M., Bartelt, P., Brown, B., Russi, T., Stockli, U., and Zimmerli, M.: SNOWPACK model calculations for avalanche warning based upon a new network of weather and snow sta-tions, Cold Reg. Sci. Technol., 30, 145–157, doi:10.1016/S0165-232X(99)00022-1, 1999.
Lehning, M., Bartelt, P., Brown, B., and Fierz, C.: A physi-cal SNOWPACK model for the Swiss avalanche warning Part III: Meteorological forcing, thin layer formation and evalua-tion, Cold Reg. Sci. Tech., 35, 169–184, doi:10.1016/S0165-232x(02)00072-1, 2002a.
Lehning, M., Bartelt, P., Brown, B., Fierz, C., and Satyawali, P.: A physical SNOWPACK model for the Swiss avalanche warning Part II: Snow microstructure, Cold Reg. Sci. Technol., 35, 147– 167, doi:10.1016/S0165-232x(02)00073-3, 2002b.
Marks, D., Link, T., Winstral, A., and Garen, D.: Simu-lating snowmelt processes during rain-on-snow over a semi-arid mountain basin, Ann. Glaciol., 32, 195–202, doi:10.3189/172756401781819751, 2001.
Marsh, P. and Woo, M. K.: Meltwater movement in natural hetero-geneous snow covers, Water Resour. Res., 21, 1710–1716, 1985. Marsh, P. and Pomeroy, J.: The impact of heterogeneous flow paths on snowmelt runoff chemistry, Proc. East. Snow. Conf, 1993, 231–238, 1993.
Marsh, P., and Pomeroy, J.: Spatial and temporal variations in snowmelt runoff chemistry, Northwest Territories, Canada, Wa-ter Resour. Res., 35, 1559–1567, 1999.
McCabe, G. J., Clark, M. P., and Hay, L. E.: Rain-on-Snow Events in the Western United States, B. Am. Meteorol. Soc., 88, 319– 328, doi:10.1175/bams-88-3-319, 2007.
Merz, R. and Blöschl, G.: A process typology of regional floods, Water Resour. Res., 39, 1340, doi:10.1029/2002wr001952, 2003. Michlmayr, G., Lehning, M., Koboltschnig, G., Holzmann, H., Zappa, M., Mott, R., and Schöner, W.: Application of the Alpine 3D model for glacier mass balance and glacier runoff stud-ies at Goldbergkees, Austria, Hydrol. Process., 22, 3941–3949, doi:10.1002/hyp.7102, 2008.
Molnar, P., Fatichi, S., Gaál, L., Szolgay, J., and Burlando, P.: Storm type effects on super Clausius-Clapeyron scaling of intense rain-storm properties with air temperature, Hydrol. Earth Syst. Sci., 19, 1753–1766, doi:10.5194/hess-19-1753-2015, 2015. Morin, S., Lejeune, Y., Lesaffre, B., Panel, J.-M., Poncet, D., David,
P., and Sudul, M.: An 18-yr long (1993–2011) snow and meteo-rological dataset from a mid-altitude mountain site (Col de Porte, France, 1325 m alt.) for driving and evaluating snowpack mod-els, Earth Syst. Sci. Data, 4, 13–21, doi:10.5194/essd-4-13-2012, 2012.
Osterhuber, R.: Precipitation intensity during rain-on-snow, in: Pro-ceedings of the 67th Annual Western Snow Conference, 67th An-nual Western Snow Conference, South Lake Tahoe California, 1999, 153–155, 1999.
R Development Core Team: R: A Language and Environment for Statistical Computing, Vienna, Austria, R Foundation for Sta-tistical Computing, available at: http://www.R-project.org/ (last access: 6 February 2017), 2016.
Rössler, O., Froidevaux, P., Börst, U., Rickli, R., Martius, O., and Weingartner, R.: Retrospective analysis of a nonforecasted rain-on-snow flood in the Alps – a matter of model limitations or unpredictable nature?, Hydrol. Earth Syst. Sci., 18, 2265–2285, doi:10.5194/hess-18-2265-2014, 2014.
Schmucki, E., Marty, C., Fierz, C., and Lehning, M.: Evalua-tion of modelled snow depth and snow water equivalent at three contrasting sites in Switzerland using SNOWPACK sim-ulations driven by different meteorological data input, Cold Reg. Sci. Technol., 99, 27–37, doi:10.1016/j.coldregions.2013.12.004, 2014.
Schneebeli, M.: Development and stability of preferential flow paths in a layered snowpack, in: Biogeochemistry of Season-ally Snow-Covered Catchments, Proceedings of a Boulder Sym-posium July 1995, edited by: Tonnessen, K., Williams, M., and Tranter, M., 89–96, 1995.
Singh, P., Spitzbart, G., Hübl, H., and Weinmeister, H.: Hydrolog-ical response of snowpack under rain-on-snow events: a field study, J. Hydrol., 202, 1–20, doi:10.1016/S0022-1694(97)00004-8, 1997.
Stearns, C. R. and Weidner, G. A.: Sensible and Latent Heat Flux Estimates in Antarctica, in: Antarctic Meteorology and Clima-tology: Studies Based on Automatic Weather Stations, edited by: Bromwich, D. H. and Stearns, C. R., Antarctic Research Series, Vol. 61, American Geophysical Union, 109–138, 1993. Sui, J. and Koehler, G.: Rain-on-snow induced flood
events in Southern Germany, J. Hydrol., 252, 205–220, doi:10.1016/S0022-1694(01)00460-7, 2001.
Surfleet, C. G. and Tullos, D.: Variability in effect of climate change on rain-on-snow peak flow events in a temperate climate, J. Hy-drol., 479, 24–34, doi:10.1016/j.jhydrol.2012.11.021, 2013. Unsworth, M. H. and Monteith, J.: Long-wave radiation at the
ground I. Angular distribution of incoming radiation, Q. J. Roy. Meteor. Soc., 101, 13–24, doi:10.1002/qj.49710142703, 1975. Waldner, P. A., Schneebeli, M., Schultze-Zimmermann, U.,
and Flühler, H.: Effect of snow structure on water flow and solute transport, Hydrol. Process., 18, 1271–1290, doi:10.1002/hyp.1401, 2004.
Wever, N., Fierz, C., Mitterer, C., Hirashima, H., and Lehning, M.: Solving Richards Equation for snow improves snowpack melt-water runoff estimations in detailed multi-layer snowpack model, The Cryosphere, 8, 257–274, doi:10.5194/tc-8-257-2014, 2014a. Wever, N., Jonas, T., Fierz, C., and Lehning, M.: Model sim-ulations of the modulating effect of the snow cover in a rain-on-snow event, Hydrol. Earth Syst. Sci., 18, 4657–4669, doi:10.5194/hess-18-4657-2014, 2014b.
Wever, N., Schmid, L., Heilig, A., Eisen, O., Fierz, C., and Lehning, M.: Verification of the multi-layer SNOWPACK model with dif-ferent water transport schemes, The Cryosphere, 9, 2271–2293, doi:10.5194/tc-9-2271-2015, 2015.
Wever, N., Vera Valero, C., and Fierz, C.: Assessing wet snow avalanche activity using detailed physics based snow-pack simulations, Geophys. Res. Lett., 43, 5732–5740, doi:10.1002/2016GL068428, 2016a.
Wever, N., Würzer, S., Fierz, C., and Lehning, M.: Simulating ice layer formation under the presence of preferential flow in layered snowpacks, The Cryosphere, 10, 2731–2744, doi:10.5194/tc-10-2731-2016, 2016b.
Wickham, H.: ggplot2: Elegant Graphics for Data Analysis, Use R!, Springer-Verlag New York, VIII, 213 pp., 2009.
WSL Institute for Snow and Avalanche Research SLF: Meteoro-logical and snowpack measurements from Weissfluhjoch, Davos, Switzerland, doi:10.16904/1, 2015.
Würzer, S., Jonas, T., Wever, N., and Lehning, M.: Influ-ence of initial snowpack properties on runoff formation dur-ing rain-on-snow events, J. Hydrometeorol., 17, 1801–1815, doi:10.1175/JHM-D-15-0181.1, 2016.
Yamaguchi, S., Watanabe, K., Katsushima, T., Sato, A., and Kumakura, T.: Dependence of the water retention curve of snow on snow characteristics, Ann. Glaciol., 53, 6–12, doi:10.3189/2012AoG61A001, 2012.