Engineering Faculty Students’ Perceptions
on Climate Change
Ebru Bakaç
Department of Educational Sciences, Faculty of Education, Sinop University, Turkey
Copyright©2018 by authors, all rights reserved. Authors agree that this article remains permanently open access under the terms of the Creative Commons Attribution License 4.0 International License
Abstract
This research aims to determine how engineering faculty students perceive climate change. Such perceptions of climate change were also investigated according to gender. Participants included 23 engineering faculty students who are continuing their education at a university in Turkey’s Northwest Black Sea Region during the second semester of the 2016-2017 academic year. Data were collected through a climate change perception scale developed by the researcher. At the end of the study, it was determined that engineering faculty students had a high level of awareness of climate change. Further, it was found that climate change perceptions of engineering faculty students did not differ across genders.Keywords
Climate Change, Perception, Engineering Faculty Students, Scale Development1. Introduction
Seen as an interdisciplinary subject in recent times, climate change has garnered interest from different fields of science. Change in the climate usually takes place over periods of at least 150 years, and which may permanently affect the ecosystem [3]. Climate records show that large and widespread climate changes have occurred repeatedly throughout the geological era [48] [49] [50]. Climate change is generally dependent on natural causes and human impact [42]. Natural causes of climate change can be classified into astronomical and extra-terrestrial factors. Astronomical factors include changes in the eccentricity of the earth’s orbit, changes in the obliquity of the ecliptic plane and changes in orbital procession. While, extra-terrestrial factors can be comprised of solar radiation quantity and quality among others [26].
Human impact is also seen as a significant contributing factor to climate change. Among different human attitudes about the perceived causes of global climate change, environmental apathy was the most prominent [21]. One of the first studies in the literature found increased levels of greenhouse gases (CH4, CO2, etc.) in the atmosphere; this
was from data collected from a measuring station at Hawaii’s Mauna Loa volcano in 1959, which monitors CO2 and other emissions in the atmosphere [43]. Another study, pointed out that a tropospheric ozone and black carbon (ВС) both help degrade air quality and thus contribute to global warming [40].
Investigations on climate change also include a significant number of scientific studies that demonstrate its increasingly dramatic impacts on ecological and social systems [26]. Natural scientists report many potential unfavourable environmental changes as a consequence of climate change, such as rising sea levels, increasing drought and the destruction of ecosystems on a world scale [1] [21]. Climate change appears to pose a risk to human security principally through its potentially negative effects (such as access to natural resources) on human quality of life [4].The general effects of climate change on health are also likely to be negative, and populations in low-income countries and rural areas are likely to be most vulnerable to its adverse effects [20] [22]. Almost 5 million people live in coastal areas and in some countries, urbanisation appears to cause the more population to move towards the coasts in recent years [35]. Aside from sea level rise, storms that occur in many coastal areas increase the risk of erosion and flooding [19].
To cope with climate change, various actions need to be taken by authorities. Reducing the risk of disasters related to climate change requires a combination of mitigation, migration and settlement modifications [35]. Climate change mitigation can be achieved by reducing the use of fossil fuels and increasing the use of renewable energy technologies, which is thought to improve human health by reducing air pollution [20].
against climate change that societies adopt should include practices which will move the mechanisms of coping with it [28].
1.1. Background
The studies on climate change would reveal that they involve students of different education levels. Some of these were designed towards elementary school students [6] [30] [34], some towards secondary school students [5] [13] [32] [39], some towards high school students [2] [33] [36] and some towards university students [8] [12] [23] [37] [38] [44]. For instance, [12] expressed that college students show a relatively high level of concern about global warming, with 80% of them stating that it is an important environmental problem. [37] stated that in their study, there is an important perception differences between American and Botswana university students in favor of college students living in Botswana. Students who living in Botswana think that their country will be more affected by climate change.The preservice teachers who live in Turkey stated that climate change is still happening according to [23]. Beside the author indicated that the same research most preservice teachers have heard of climate change, but they are undecided about the concept. Meanwhile, [38] showed that preservice teachers are unaware of the proper precautions to decelerate climate change.
These studies generally examined the knowledge levels and attitudes of participants towards global warming, climate change and greenhouse gas emission, and they have attempted to evaluate the causes of climate change, its consequences, its impact on the environment, and its possible implications on future literature. In this context, it is important to investigate how university students perceive climate change, which has become a primary issue today, and how to develop a measurement tool to detect these perceptions. In this study, the researcher first developed a measurement tool for university students, and the perception level of engineering faculty students about climate change was determined using this tool. Engineering faculty students are considered to be in a good knowledge level when it comes to scientific concepts, so these students were chosen as a study group. In this context, the purpose of the research is to determine the perceptions of engineering faculty students towards climate change. Within the scope of the research, the following questions were asked:
1. What is the distribution of climate change perceptions of engineering faculty students? 2. Do climate change perceptions of engineering
faculty students differ across genders?
2. Materials and Methods
2.1. Research Approach
This study is a descriptive study in order to determine
how the engineering faculty students perceive climate change. In our investigation, we also considered gender as a factor.
2.2. Participants
The participants consisted of 23 engineering faculty students who are pursuing their education at a university in Turkey’s Northwest Black Sea Region during the second semester of the 2016-2017 academic year. Categorised by gender, the group was composed of (n = 3) females and (n = 20) males. When these students were evaluated in terms of age, it was found that (n = 17) were 21 years old, (n = 2) were 20 years old and (n = 2) were 22 years old. Finally, (n = 2) students did not specify their age.
2.3. Data Analysis
The study followed a two-step route. Explanatory and confirmatory factor analyses were carried out during the development of the climate change perception scale. The SPSS 22 package programme was used for exploratory factor analysis, and the Lisrel 8.51 package programme was used for confirmatory factor analysis. Descriptive statistics were used to Engineering faculty students’ perceptions of climate change level and t-test were used to determine students’ climate change perception scores according to gender.
3. Results
3.1. Instrument Development
Evaluation of university students’ climate change perceptions was conducted through a survey. Some surveys have been found in the literature, but only a few scales [46] examined comprehensive of climate change. Thus, a scale was developed to identify university students’ perceptions. At the end of the revised literature, a scale was prepared which had 42 items with climate change and were examined by seven field experts. Therefore, the survey’s content validation was achieved at the end of this initiative, and the pilot measuring tool consisting of 38 items was prepared to examine factor structure.
3.1.1. Exploratory Factor Analysis
To conduct exploratory factor analysis, the draft measurement instrument was given to 303 university students who attended various faculties (faculty of arts and sciences, faculty of education and vocational school) of a university in the Northwest Black Sea Region of Turkey during the second semester of 2016–2017. Sample size was a significant issue for the factor analysis. According to [10], sample sizes of 100 are rated as poor, 200 as fair, 300 as good, 500 as very good and 1,000 or more as excellent.
determine the data structure’s suitability for factor analysis in terms of sample size. When the KMO value was examined in the study, it was found that the data structure of the scale was sufficient to perform descriptive factor analysis. Since the KMO index was 0.89, the data set is appropriate for exploratory factor analysis, as it is greater than 0.50 [17] [41]. In this study, Bartlett’s test of sphericity was (χ2
(231) = 1799; p = 0.00).
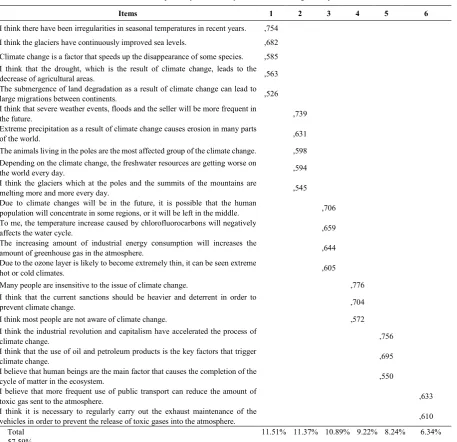
As a result of the exploratory factor analysis, a six-factor structure was achieved consisting of 22 items. The
calculated total variance for the complete scale was 57.59%. As [29] pointed out, the higher the variance explained, the better the relevant concept or structure is measured (see Table 1).
[image:3.595.72.530.222.664.2]Pearson correlation analysis was performed to determine whether a significant relationship exists between the scale factors. When the correlation matrix of the climate change perception scale was examined, a moderate and positive correlation between the six factors of the scale was found (see Table 2).
Table 1. Results of Exploratory Factor Analysis of Climate Change Perception Scale
Items 1 2 3 4 5 6
I think there have been irregularities in seasonal temperatures in recent years. ,754
I think the glaciers have continuously improved sea levels. ,682
Climate change is a factor that speeds up the disappearance of some species. ,585 I think that the drought, which is the result of climate change, leads to the
decrease of agricultural areas. ,563
The submergence of land degradation as a result of climate change can lead to
large migrations between continents. ,526
I think that severe weather events, floods and the seller will be more frequent in
the future. ,739
Extreme precipitation as a result of climate change causes erosion in many parts
of the world. ,631
The animals living in the poles are the most affected group of the climate change. ,598 Depending on the climate change, the freshwater resources are getting worse on
the world every day. ,594
I think the glaciers which at the poles and the summits of the mountains are
melting more and more every day. ,545
Due to climate changes will be in the future, it is possible that the human
population will concentrate in some regions, or it will be left in the middle. ,706 To me, the temperature increase caused by chlorofluorocarbons will negatively
affects the water cycle. ,659
The increasing amount of industrial energy consumption will increases the
amount of greenhouse gas in the atmosphere. ,644
Due to the ozone layer is likely to become extremely thin, it can be seen extreme
hot or cold climates. ,605
Many people are insensitive to the issue of climate change. ,776
I think that the current sanctions should be heavier and deterrent in order to
prevent climate change. ,704
I think most people are not aware of climate change. ,572
I think the industrial revolution and capitalism have accelerated the process of
climate change. ,756
I think that the use of oil and petroleum products is the key factors that trigger
climate change. ,695
I believe that human beings are the main factor that causes the completion of the
cycle of matter in the ecosystem. ,550
I believe that more frequent use of public transport can reduce the amount of
toxic gas sent to the atmosphere. ,633
I think it is necessary to regularly carry out the exhaust maintenance of the
vehicles in order to prevent the release of toxic gases into the atmosphere. ,610
Table 2. Correlation Matrix of the Climate Change Perception Scale
Reasons Consciousness Level of Future Scenario Environmental Impact Results Cautions
Reasons - -
Level of Consciousness ,493** - -
Future Scenario ,462** ,526** - -
Environmental Impact ,491** ,377** ,477** -
Results ,458** ,457** ,456** ,361** -
Caution ,441** ,429** ,449** ,273** ,325** -
** Correlation is significant at the 0.01 level (two-tailed).
3.1.2. Confirmatory Factor Analysis
To conduct confirmatory factor analysis, the draft scale was given to 300 university students who attended different faculties of a university (faculty of arts and sciences, faculty of education and vocational school). The 22 items were further analysed via confirmatory factor analysis using Lisrel 8.51. This six-factor model revealed a satisfactory model fit for survey (χ2 = 340.59, N = 300, SD = 194,
χ2/df = 1.54, GFI = 0.90, CFI = 0.92, RMSEA = 0.052, AGFI = 0.87, NFI = 0.83, NNFI = 0.90, RMR = 0.036). The degree of model fit for the climate change perception scale was assessed as follows: χ2/df = 1.54 ≤ 2 = perfect fit [41], GFI ≥ 90 = good fit [24], CFI ≥ 90 = good fit [41] [25], RMSEA ≤ 0.05 = excellent fit [27], AGFI ≥ 95 = good fit [24], NFI/NNFI ≥ 90 = good fit [25] and RMR ≤ 0.05 = excellent fit [9] [16].
3.1.3. Reliability
The climate change perception scale’s Cronbach’s alpha values (0.88) were obtained for the whole scale by the researcher. The Cronbach’s alpha value of the ‘reasons’ subscale is α = 0.76; ‘level of consciousness’, α = 0.71; ‘future scenario’, α = 0.73, ‘environmental impact’, α = 0.65; ‘results’, α = 0.62; and ‘cautions’, α = 0.46.
3.2. Descriptive Statistics and t-test Results about Engineering Faculty Students’ Perceptions of Climate Change
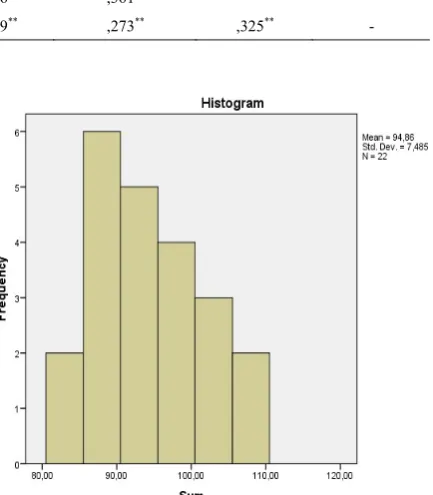
Engineering faculty students’ perceptions of climate change were investigated using descriptive statistics. An examination of the histogram, which showed the distribution of the students’ total scores from the climate change perception scale, showed an arithmetic mean of scores of 94.86 and a standard deviation of 7.48, and the participants’ total scores were normally distributed (see Figure 1).
Figure 1. Histogram showing the climate change scores of engineering faculty students
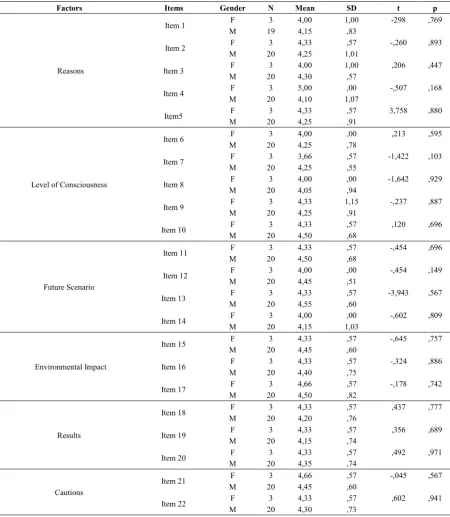
[image:4.595.71.529.92.199.2] [image:4.595.309.526.179.427.2]Analysis of the ‘future scenario’ subscale showed that all items’ arithmetic means were higher in favour of male students, giving the impression that the male students are more knowledgeable and more interested in issues such as energy consumption and the media. It has also been determined that there no difference exists in the environmental effects of climate change according to gender. When factors associated with possible consequences of climate change were examined by gender,
[image:5.595.73.524.217.735.2]it revealed no significant difference between the perception scores of the female and male students. Thus, engineering faculty students, regardless of gender, have similar ideas about possible climate change outcomes. Finally, when the ‘cautions’ subscale of the scale was inspected, all items’ arithmetic means were revealed to be higher in favour of female students. This leads to the interpretation that the female students are trying to be vigilant and are working towards a more habitable world (see Table 3).
Table 3. Engineering Faculty Students’ Climate Change Perception Scores According to Gender
Factors Items Gender N Mean SD t p
Reasons
Item 1 F 3 4,00 1,00 -298 ,769
M 19 4,15 ,83
Item 2 F 3 4,33 ,57 -,260 ,893
M 20 4,25 1,01
Item 3 F 3 4,00 1,00 ,206 ,447
M 20 4,30 ,57
Item 4 F 3 5,00 ,00 -,507 ,168
M 20 4,10 1,07
Item5 F 3 4,33 ,57 3,758 ,880
M 20 4,25 ,91
Level of Consciousness
Item 6 F 3 4,00 ,00 ,213 ,595
M 20 4,25 ,78
Item 7 F 3 3,66 ,57 -1,422 ,103
M 20 4,25 ,55
Item 8 F 3 4,00 ,00 -1,642 ,929
M 20 4,05 ,94
Item 9 F 3 4,33 1,15 -,237 ,887
M 20 4,25 ,91
Item 10 F 3 4,33 ,57 ,120 ,696
M 20 4,50 ,68
Future Scenario
Item 11 F 3 4,33 ,57 -,454 ,696
M 20 4,50 ,68
Item 12 F 3 4,00 ,00 -,454 ,149
M 20 4,45 ,51
Item 13 F 3 4,33 ,57 -3,943 ,567
M 20 4,55 ,60
Item 14 F 3 4,00 ,00 -,602 ,809
M 20 4,15 1,03
Environmental Impact
Item 15 F 3 4,33 ,57 -,645 ,757
M 20 4,45 ,60
Item 16 F 3 4,33 ,57 -,324 ,886
M 20 4,40 ,75
Item 17 F 3 4,66 ,57 -,178 ,742
M 20 4,50 ,82
Results
Item 18 F 3 4,33 ,57 ,437 ,777
M 20 4,20 ,76
Item 19 F 3 4,33 ,57 ,356 ,689
M 20 4,15 ,74
Item 20 F 3 4,33 ,57 ,492 ,971
M 20 4,35 ,74
Cautions
Item 21 F 3 4,66 ,57 -,045 ,567
M 20 4,45 ,60
Item 22 F 3 4,33 ,57 ,602 ,941
4. Discussion
This research seeks to determine the climate change perceptions of engineering faculty students. It also investigated whether such perceptions differ according to gender. At the end of the study, it was determined that engineering faculty students are highly aware of climate change and that they have also developed a high level of familiarity of its causes, environmental effects and relevant situations in the future. Moreover, the climate change perceptions of engineering faculty students did not differ according to gender.
The engineering faculty students’ high level of awareness of climate change means they believe it is an important problem in today’s world. In the literature, [18] evaluated public knowledge about climate change and people’s willingness to act on global warming, and they found that people could confirm the occurrence of climate change as well as its possible effects on the environment. [38] also pointed out that university students perceived climate change as a danger that may arise in the near future.
[31] found that the American public perceived climate
change as a medium-sized risk that will mostly affect geographically and temporally distant communities and countries. Conversely, [44] noted university students’ misconceptions about the causes and consequences of climate change. Similarly, [47] stated that public expressed uncertainty about the existence of climate change, and their views have remained highly consistent between 2003 and 2008. In another study, [45] found a mismatch between public opinion and political rhetoric on climate change and that the measures being taken are inadequate for the public. Finally, with regard to argumentation, [11] stated that students always had an improved understanding of scientific literature, and it is possible for them to acquire new knowledge and skills about the subject and thus positively affect other people’s attitudes and perspectives on climate change.
No significant difference was found between female and male university students in relation to their perception about climate change. This suggests that no disagreement about climate change perceptions exists in terms of gender. According to [45], there is no separation between men’s and women’s opinions about climate change. [46] also noted that gender had no significant effect in the public’s perception of threats of climate change. Finally, [7] expressed that gender does not predict Norwegian and Spanish university students’ epistemic beliefs concerning climate change. Thus, male and female students clearly have similar thoughts about climate change, and gender does not appear to be significant in climate change–related issues. In the literature, [14] stated that the low number of women placed in decision-making mechanisms at all levels of society leads to the same policies in climate change– related issues, implying that this situation should be corrected through addressing sexist attitudes.
5. Conclusions
Studies on perceived certainty of climate change not only have implications on public opinion; they also involve perceptions, attitudes, beliefs and knowledge of students at every level. The first studies on climate change pointed out the public’s and students’ uncertainty of the presence of climate change, which has changed over time. In recent studies, an increase in students’ awareness about climate change, the atmospheric release of greenhouse gases and global warming has been seen. However, as this study also puts it, students have not reached the desired level of consciousness, so educational curriculums on climate change need to be designed and should positively affect students’ perceptions about the environment. Meanwhile, these educational curriculums are expected to improve university students’ scientific knowledge, attitudes and beliefs.
Acknowledgement
I would like to thank the faculty members who shared their views in the study and the students who helped in data collection.
REFERENCES
[1] Alley et al. 2003. “Abrupt Climate Change.” Science 299 (5615): 2005-2010.
[2] Andersson, B., and Wallin, A. 2000. “Students' Understanding of the Greenhouse Effect, the Societal Consequences of Reducing CO2 Emissions and the Problem of Ozone Layer Depletion.” Journal of Research in Science Teaching 37 (10): 1096-1111.
[3] Ayoade, J.O. 2003. Climate Change: Synopsis of Its Nature, Causes, Effects and Management. Ibadan: Vantage Publishers.
[4] Barnett, J., and Adger, W. N. 2007. “Climate Change, Human Security and Violent Conflict.” Political Geography 26 (6): 639-655.
[5] Boon, H. J. 2010. “Climate Change? Who Knows? A Comparison of Secondary Students and Pre-Service Teachers.” Australian Journal of Teacher Education 35: 104-120.
[6] Boylan, C. 2017. “Exploring Elementary Students’ Understanding of Energy and Climate Change.” International Electronic Journal of Elementary Education 1 (1): 1-15.
[8] Bråten, I., Strømsø, H. I., and Salmerón, L. 2011. “Trust and Mistrust When Students Read Multiple Information Sources About Climate Change.” Learning and Instruction 21 (2): 180-192.
[9] Byrne, B.M. 1998. Structural Equation Modeling with Lisrel, Prelıs and Sımplıs: Basic Concepts, Applications and Programming. Mahwah, New Jersey: Lawrence Erlbaum Associates.
[10] Comrey, A. L. 1973. A First Course in Factor Analysis. New York, NY: Academic Press.
[11] Cordero, E. 2001. “Misconceptions in Australian Students Understanding of Ozone Depletion.” Melbourne Stud. Educ 41: 85-97.
[12] Cordero, E. C., Marie Todd, A., and Abellera, D. 2008. “Climate Change Education and the Ecological Footprint.” Bulletin of the American Meteorological Society 89 (6): 865-872.
[13] Dawson, V., and Carson, K. 2013. “Australian Secondary School Students' Understanding of Climate Change.” Teaching Science 59 (3): 9-14.
[14] Denton, F. 2002. “Climate Change Vulnerability, İmpacts, and Adaptation: Why Does Gender Matter?.” Gender and Development 10 (2): 10-20.
[15] Department of the Environment, T. T. R. 2000. “Building a Better Quality of Life–A Strategy for More Sustainable Construction.”
[16] Diamantopoulos, A. and Siguaw, J.A. 2000. Introducing Lisrel. London: Sage Publications.
[17] Field, A. 2000. Discovering Statistics Using Spss for Windows. New Delhi: Sage publications.
[18] Fortner, R. W., Lee, J.Y., Romanello, S., Bonnell, J., Luthy, B., Figuerido, C., and Ntsiko, N. 2000. “Public understanding of Climate Change; Certainty and Willingness to Act.” Environmental Education Research 6: 127–141.
[19] US Global Change Research Program 2009. Global climate change impacts in the United States. Cambridge University Press.
[20] Haines, A., Kovats, R. S., Campbell-Lendrum, D., and Corvalán, C. 2006. “Climate Change and Human Health: Impacts, Vulnerability and Public Health.” Public Health 120 (7): 585-596.
[21] Heath, Y., and Gifford, R. 2006. “Free-market Ideology and Environmental Degradation: The Case of Belief in Global Climate Change.” Environment and Behavior 38 (1): 48-71.
[22] Heltberg, Rasmus, Paul Bennett Siegel, and Steen Lau Jorgensen. 2009. "Addressing human vulnerability to climate change: toward a ‘no-regrets’ approach." Global Environmental Change 19 (1):89-99.
[23] Higde, E., Oztekin, C., and Sahin, E. 2017. “Turkish Pre-Service Science Teachers' Awareness, Beliefs, Values, and Behaviours Pertinent to Climate Change.” International Research in Geographical and Environmental Education 26 (3): 253-263.
[24] Hooper, D., Coughlan, J. and Mullen, M. R 2008.
“Structural Equation Modelling: Guidelines for Determining Model Fit.” The Electronic Journal of Business Research Methods 6 (1): 53 – 60.
[25] Hu, L.T. and Bentler, P.M. 1999. “Cut off Criteria for Fit Indexes in Covariance Structure Analysis: Conventional Criteria Versus New Alternatives.” Structural Equation Modeling 6 (1): 1-55.
[26] Intergovernmental Panel on Climate Change (IPCC). 2007. Climate change 2007: Synthesis report. Contribution of working groups I, II, and III to the fourth assessment report of the intergovernmental panel on climate change. Cambridge: Cambridge University Press.
[27] Jöreskog, K. and Sörbom, D. 1993. Lısrel 8: Structural Equation Modeling with the Sımplıs Command Language. Chicago, IL: Scientific Software International Inc.
[28] Khan et al. 2011. “Drinking Water Salinity and Maternal Health in Coastal Bangladesh: Implications of Climate Change.” Environmental Health Perspectives 119 (9): 1328-1332.
[29] Kline, P. 1994. An Easy Guide to Factor Analysis. New York: Routledge.
[30] Lambert, J. L., Lindgren, J., and Bleicher, R. 2012. “Assessing Elementary Science Methods Students' Understanding about Global Climate Change.” International Journal of Science Education 34 (8): 1167-1187.
[31] Leiserowitz, A. A. 2005. “American Risk Perceptions: Is Climate Change Dangerous?.” Risk Analysis 25 (6): 1433-1442.
[32] Liarakou, G., Athanasiadis, I., and Gavrilakis, C. 2011. “What Greek Secondary School Students Believe About Climate Change?.” International Journal of Environmental and Science Education 6 (1): 79-98.
[33] Lombardi, D., and Sinatra, G. M. 2012. “College Students’ Perceptions about the Plausibility of Human Induced Climate Change.” Research in Science Education 42 (2): 201-217.
[34] Matkins, J. J., and Bell, R. L. 2007. “Awakening the Scientist Inside: Global Climate Change and the Nature of Science in An Elementary Science Methods Course.” Journal of Science Teacher Education 18 (2): 137-163. [35] McGranahan, G., Balk, D., and Anderson, B. 2007. “The
Rising Tide: Assessing the Risks of Climate Change and Human Settlements in Low Elevation Coastal Zones.” Environment and Urbanization 19 (1): 17-37.
[36] McNeill, K. L., and Vaughn, M. H. 2012. “Urban High School Students’ Critical Science Agency: Conceptual Understandings and Environmental Actions around Climate Change.” Research in Science Education 42 (2): 373-399.
[37] Moswete, N. N., Manwa, H. and Purki, H. 2017. “Perceptions of College Students towards Climate Change, Environmental and Tourism Issues: A Comparative Study in Botswana and The US.” Internatıonal Journal of Envıronmental & Scıence Educatıon 12 (5): 1175-1193. [38] Papadimitriou, V. 2004. “Prospective Primary Teachers'
Ozone Layer Depletion.” Journal of Science Education and Technology 13 (2): 299-307.
[39] Punter, P., Ochando - Pardo, M., and Garcia, J. 2011. “Spanish Secondary School Students' Notions on the Causes and Consequences of Climate Change.” International Journal of Science Education 33 (3): 447-464.
[40] Shindell et al. 2012. “Simultaneously mitigating near-term climate change and improving human health and food security.” Science 335 (6065): 183-189.
[41] Tabachnick, B. G., and Fidell, L. S. 2001. Using Multivariate Statistics. Boston: Allyn and Bacon.
[42] The United Nations Framework Convention on Climate Changes 2003. Retrieved from https://unfccc.int/resource/d ocs/publications/caring_en.pdf on 25.04.2018
[43] Urry, J. 2015. "Climate change and society." Why the social sciences matter. London: Palgrave Macmillan. [44] Wachholz, S., Artz, N., and Chene, D. 2014. “Warming to
the Idea: University Students' Knowledge and Attitudes about Climate Change.” International Journal of Sustainability in Higher Education 15 (2): 128-141.
[45] Whitmarsh, L. 2005. A study of public understanding of
and response to climate change in the South of England (Published doctoral dissertation). Department of Psychology, University of Bath, Bath, UK.
[46] Whitmarsh, L. 2008. “Are Flood Victims More Concerned About Climate Change Than Other People? The Role of Direct Experience in Risk Perception and Behavioural Response.” Journal of Risk Research 11 (3): 351-374. [47] Whitmarsh, L. 2011. “Scepticism and Uncertainty about
Climate Change: Dimensions, Determinants and Change over Time.” Global Environmental Change 21 (2): 690-700.
[48] Willis, K. J., Bailey, R. M., Bhagwat, S. A., and Birks, H. J. B. 2010. “Biodiversity Baselines, Thresholds and Resilience: Testing Predictions and Assumptions Using Palaeoecological Data.” Trends in ecology & evolution 25(10): 583-591.
[49] Zachos, J., Pagani, M., Sloan, L., Thomas, E., and Billups, K. 2001. “Trends, Rhythms, and Aberrations in Global Climate 65 Ma To Present.” Science 292(5517): 686-693. [50] Zillén, L., Conley, D. J., Andrén, T., Andrén, E., and