http://dx.doi.org/10.4236/ojms.2016.62026
How to cite this paper: Deilami-Tarifi, M., Behdarvandi-Askar, M., Chegini, V. and Haghighi-Pour, S. (2016) Modeling of the Changes in Flow Velocity on Seawalls under Different Conditions Using FLOW-3D Software. Open Journal of Marine Science, 6, 317-322. http://dx.doi.org/10.4236/ojms.2016.62026
Modeling of the Changes in Flow Velocity on
Seawalls under Different Conditions Using
FLOW-3D Software
Maryam Deilami-Tarifi
1, Mehdi Behdarvandi-Askar
2*, Vahid Chegini
3,
Sadegh Haghighi-Pour
41Department of Coastal Engineering, Khorramshahr University of Marine Science and Technology,
Khorramshahr, Iran
2Department of Marine Structures, Khorramshahr University of Marine Science and Technology, Khorramshahr,
Iran
3Iran National Center for Oceanography and Atmospheric Sciences, Tehran, Iran
4Department of Civil Engineering, Excellence in Education Center of Jihad University of Khuzestan, Ahvaz, Iran
Received 12 March 2016; accepted 23 April 2016; published 26 April 2016 Copyright © 2016 by authors and Scientific Research Publishing Inc.
This work is licensed under the Creative Commons Attribution International License (CC BY).
http://creativecommons.org/licenses/by/4.0/
Abstract
Seawalls are among protective structures that are constructed for decreasing the level of wave force and/or protecting from other structures. In this regard, more accurate investigation of these structures takes great importance from different perspectives. This research investigates the change of the velocity on seawall crown by considering the obstacles in different layouts and slopes. FLOW-3D has been used in this research for modeling. The results of the modeling show that the existence of obstacles has a determinative role in decreasing flow rate in the crown of seawalls. Also, as it was expected, the slope factor on upstream seawalls is very determinative in decreasing this rate such that the lowest velocity on the wall occurs in D-state layout and the slope of 45˚.
Keywords
Flow Velocity, Seawall Crown, Modeling, FLOW-3D
1. Introduction
Seawalls are among the protective structures that are constructed for decreasing the rate of wave force and/or protecting other structures. Lighthouses are among the structures that are usually protected by seawalls.
fore, in addition to the importance of the volume of passing-water upon seawalls, the velocity rate of passing- flow on crown for this structure is very important because of the importance of velocity factor in creating mo-mentum and impulse on the structure behind these walls. Basically, the creation of obstacle in upstream slope and the rate of upstream slope can be very effective in decreasing the amount of this velocity. However, this is-sue must be accurately investigated by modeling to reach an optimum layout of obstacles in a specific slope. In this research, three-dimensional model of FLOW-3D is used for investigating the mentioned issue [1].
2. Research History
Several studies have focused on waves overtopping marine structures. These methods have consistently correct-ly predicted overtopping of structures to protect the coast against sea waves. By 2002, nearcorrect-ly 6500 tests had been conducted; physical models of regular waves have also been carried out in the USA [2]. The most complete set of random waves was completed by Owen (1980). Owen carried out a number of physical model tests to study overtopping and the relationship between the height of the sea wall and degree of overtopping [3]. He showed that the degree of overtopping depends on environmental conditions such as wave height and wave pe-riod, as well as on the geometry and type of structural material. The combination of these factors should be in-vestigated. Von Meyer and Duval (1992) carried out another series of studies [4].
3. Materials and Methods
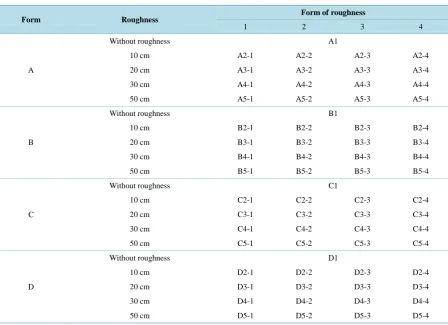
[image:2.595.87.536.397.722.2]In this research, 68 different geometries are given to the software for the modeling and they are briefly intro-duced in the following Table 1. These 68 different geometries include 4 different slopes, 4 different layouts and 4 different heights of obstacles and also 4 states without obstacle and only under different slopes [5]. Then, these different geometries and states are evaluated and analyzed under the same conditions using FLOW-3D three- dimensional model.
Table 1. Designation of variables.
Form Roughness Form of roughness
1 2 3 4
A
Without roughness A1
10 cm A2-1 A2-2 A2-3 A2-4
20 cm A3-1 A3-2 A3-3 A3-4
30 cm A4-1 A4-2 A4-3 A4-4
50 cm A5-1 A5-2 A5-3 A5-4
B
Without roughness B1
10 cm B2-1 B2-2 B2-3 B2-4
20 cm B3-1 B3-2 B3-3 B3-4
30 cm B4-1 B4-2 B4-3 B4-4
50 cm B5-1 B5-2 B5-3 B5-4
C
Without roughness C1
10 cm C2-1 C2-2 C2-3 C2-4
20 cm C3-1 C3-2 C3-3 C3-4
30 cm C4-1 C4-2 C4-3 C4-4
50 cm C5-1 C5-2 C5-3 C5-4
D
Without roughness D1
10 cm D2-1 D2-2 D2-3 D2-4
20 cm D3-1 D3-2 D3-3 D3-4
30 cm D4-1 D4-2 D4-3 D4-4
4. Numerical Models
The FLOW-3D software is a powerful hydraulic simulator application in the field of fluid dynamics with three- dimensional flow field analysis. The equations governing in the model, like other similar models, are Navier- Stokes equations and the conservation of mass equation [6].
In order to model the channel in this application, we need to define the General Conditions (including the si-mulation of all systems), physical conditions, geometry and model-solving network, adjusting the outputs and its related options. Celsius Degrees was chosen for system units, SI, and temperature.
In physical terms, the software allows that, according to the principles of the physics governing the pheno-menon, the relevant conditions are chosen. The physical conditions governing this study are gravity and viscos-ity and turbulence. The turbulence in this software is stimulated by five models and the model used in this re-search was Re-Normalisation Group (RNG). In this model of turbulence, constant values which were experi-mentally calculated in K-model are implicitly derived [7].
After that, the fluid should be defined. The selected fluid of this study is the 20-degree-Celsius water [8]. The next step is to define the geometry and resolve network, which is of importance in simulation [9]. The FLOW3D enables the user to depict a lot of fluid phenomena with the tools available in the software. Defining the channel geometry, resolve network should be defined. The defined resolve network of the software is in the form of regular (cubic) resolve network including network size, number of cells and their dimensions in three coordinates of X, Y, and Z and boundary conditions. The smaller the size of network cell dimensions and the greater their number, the higher the capability and precision of the program for simulation will be [10].
5. Results
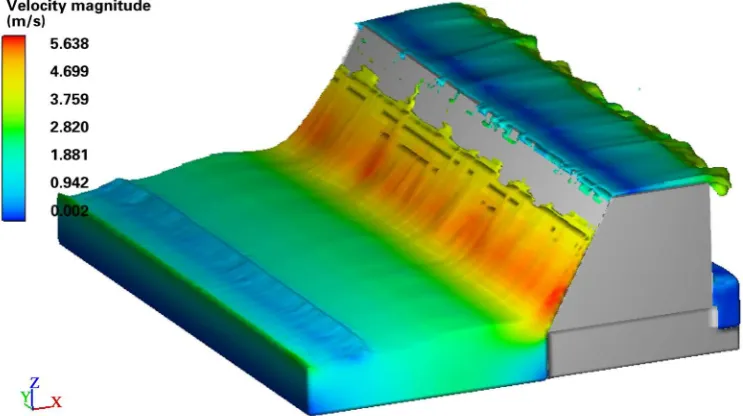
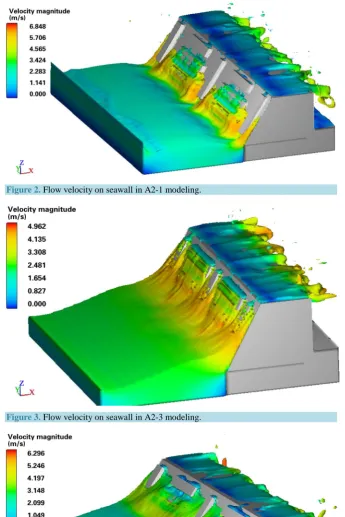
As it can be observed in the different figures, the diagrams are in two types: first, direct output from software that includes the Figures 1-4 and the other the Figures 5-7 as the diagrams of the process of the changes. How-ever, it must be mentioned that in the Figures 1-4, outputs from one of the slopes, as an example, are directly brought from software output.
With regard to the mentioned figures, it can be understood that the highest velocity rate is occurred in up-stream slope of seawall while these velocities are maximum in upup-stream slope of the state without obstacle. The interesting point is that the lowest velocity usually exists on seawall crown.
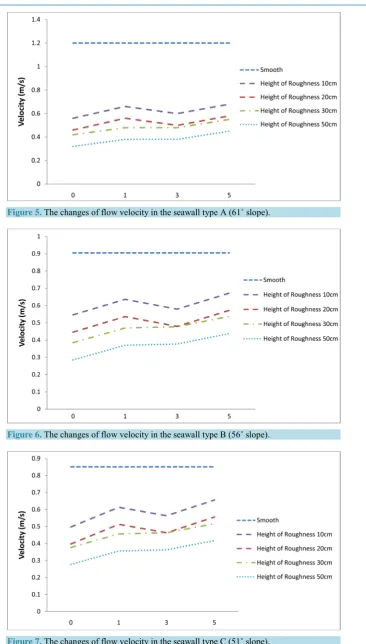
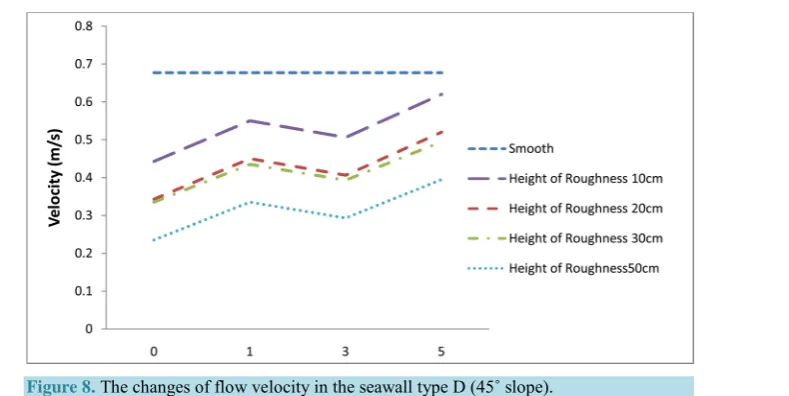
[image:3.595.130.502.493.701.2]As it can be seen from the Figures 5-8, in all the different slope states of upstream seawall, the highest flow velocity is related to the obstacle with 10 cm height and lowest velocity is related to the obstacle with 50 cm height. The reason is that the value of flow kinetic energy which is converted to potential energy because of the collision with obstacles increases by increasing the height of the obstacles. Therefore, when the height of
Figure 2. Flow velocity on seawall in A2-1 modeling.
[image:4.595.146.483.509.701.2]Figure 3. Flow velocity on seawall in A2-3 modeling.
Figure 5.The changes of flow velocity in the seawall type A (61˚ slope).
Figure 6.The changes of flow velocity in the seawall type B (56˚ slope).
[image:5.595.144.483.441.708.2]Figure 8. The changes of flow velocity in the seawall type D (45˚ slope).
corresponding flow kinetic energy in a moment is converted to the corresponding height of potential energy in the collision of flow to each obstacle, it causes flow velocity to be zero for a moment and then its velocity is in-creased after crossing the obstacle. Whatever the height of the obstacle is lower, there would be fewer momen-tary zero velocity states and the flow continues its moving with higher velocity.
6. Conclusion
Also, as it can be observed, the highest difference of velocity in all the figures is between the obstacles with 10 cm height and the obstacles with 50 cm height. Also, this amount of difference in velocity for difference be-tween the obstacles with 10 cm and 20 cm heights is higher than that of the differences in the obstacles with 20 cm and 30 cm heights which can be related to the special conditions in flow hydraulic in that range of height.
References
[1] Owen, M.W. (1980) Design of Seawalls Allowing for Wave Overtopping. Rep. EX924, Hydraulics Research Walling-ford, England.
[2] van der Meer, J.W. and Janssen, J.P.F.M. (1995) Wave Run-Up and Wave Overtopping at Dikes. In: Kobayashi, N. and Demirbilek, Z., Eds., Wave Forces on Inclined and Vertical Wall Structures, ASCE, New York.
[3] CIRIA/CUR (1995) Manual on the Use of Rock in Hydraulic Engineering. CUR/RWS Report 169, A.A. Balkema, Rotterdam.
[4] Pullen, T., Allsop, N.W.H., Bruce, T., Kortenhaus, A., Schuttrumpf, H. and van der Meer, J.W. (2007) EurOtop— Wave Overtopping of Seadefences and Related Structures Assessment Manual.
http://www.overtopping-manual.com/manual.htmlæ
[5] De Wall, J.P. and Van der Meer, J.W. (1992) Wave Run-Up and Overtopping at Coastal Structures. ASCE, Proceeding of 23rd ICCE, Venice, 1758-1771.
[6] De Gerloni, M., Franco, L. and Passoni, G. (1991) The Safety of Breakwaters against Wave Overtopping. Proceedings of ICE Conference on Breakwaters and Coastal Structures, Thomas Telford, London.
[7] Fenton, J.D. (1988) The Numerical Solution of Steady Water Wave Problems. Computers & Geosciences, 14.
http://dx.doi.org/10.1016/0098-3004(88)90066-0
[8] Owen, M.W. (1982) Design of Seawalls Allowing for Wave Overtopping. Rep. EX924, Hydraulics Research Walling-ford, England.
[9] Allsop, W., Bruce, T., Pearson, J. and Besley, P. (2006) Wave Overtopping at Vertical and Steep Seawall.