http://dx.doi.org/10.4236/nr.2016.77035
How to cite this paper: Reid, C.X., Sparks, D.L., Williams, W.P. and Brown, A.E. (2016) Single Corn Kernel Aflatoxin B1 Ex-traction and Analysis Method. Natural Resources, 7, 405-410. http://dx.doi.org/10.4236/nr.2016.77035
Single Corn Kernel Aflatoxin B
1
Extraction
and Analysis Method
Cedric X. Reid1, Darrel L. Sparks1,2*, W. Paul Williams3, Ashli E. Brown1,2*
1Department of Biochemistry, Molecular Biology, Entomology, and Plant Pathology, Mississippi State University,
Oktibbeha County, USA
2Mississippi State Chemical Laboratory, Mississippi State University, Oktibbeha County, USA
3Corn Host Plant Resistance Research Unit, United States Department of Agriculture-Agricultural Research
Service, Oktibbeha County, USA
Received 30 May 2016; accepted 2 July 2016; published 5 July 2016
Copyright © 2016 by authors and Scientific Research Publishing Inc.
This work is licensed under the Creative Commons Attribution International License (CC BY).
http://creativecommons.org/licenses/by/4.0/
Abstract
Aflatoxins are highly carcinogenic compounds produced by the fungus Aspergillus flavus. Asper-gillus flavus is a phytopathogenic fungus that commonly infects crops such as cotton, peanuts, and maize. The goal of this research was to design an effective method for sample preparation and analysis of aflatoxin B1 from Aspergillus flavus infected maize kernels. The method involves liquid extraction with a methanol/water solution. The samples were analyzed by liquid chromatography coupled to an electrospray ionization tandem mass spectrometry (LC-ESI-MS/MS) operating in positive ion multiple reaction monitoring (MRM) mode. The spiked levels for the recovery expe-riment were 4 ppb and 20 ppb, respectively. Recoveries ranged between 72% and 113% (90.8% average), with Relative Standard Deviation below 15% (10.6% on average).
Keywords
Aspergillus flavus, Aflatoxin, Maize, HPLC, MS/MS, Extraction
1. Introduction
Aspergillus flavus (A. flavus) is a fungus that commonly grows in the soil and is known to infect a variety of crops including cotton, peanuts, and corn. A. flavus can cause ear rot in maize, aflaroot in peanuts, and yellow spot disease in cotton [1]-[3]. Environmental conditions such as high temperatures, high humidity, drought stress, and poor crop storage can cause A. flavus to start producing aflatoxins [4]. Aflatoxins are secondary metabolites
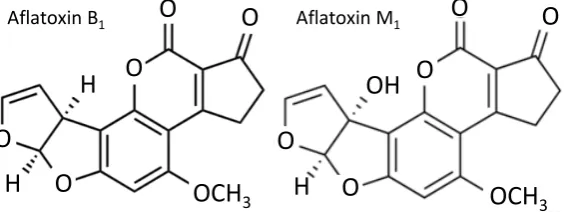
of the fungus and are extremely carcinogenic. The four major types of aflatoxins are aflatoxin B1, B2, G1, and G2. Aflatoxin B1 and B2 fluoresce blue under UV light while aflatoxin G1 and G2 fluoresce green in the presence of UV light. Aflatoxin B1 can also be metabolized to aflatoxin M1 which would be found in the milk of lactating mammals. Aflatoxin B1 is the most common and carcinogenic of these compounds as seen in Figure 1. Afla-toxin B1 is converted in vivo to an aflaAfla-toxin B1-exo-8, 9-epoxide by the liver enzyme cytochrome p450 oxidase [5]. The epoxide that is formed is a highly reactive electrophile and has an extremely high regiospecificity for the N7 position of the guanine residue in DNA [6]. It specifically binds to the p53 encoding region to form a DNA adduct [7]. This results in nonfunctioning p53 proteins which are important tumor suppressors in humans. In 1988 the International Agency for Research on Cancer classified aflatoxin B1 as a Class 1 human carcino-gen [8]. Therefore, the U.S. Food and Drug Administration (FDA) has restricted the amount of aflatoxin in food for human consumption to 20 parts per billion (ppb) in the United States. The European Commission (EC) limits aflatoxins in food for human consumption to 4 ppb in the European Union [9] [10]. The Council of Agricultural Science and Technology has estimated that the US has an annual loss of almost a billion dollars due to crop damage from mycotoxins. An estimated $225 million of that are due to aflatoxin contamination in maize crops [11]. Study of the maize genome has increased in recent years in hopes to discover genes that are involved with aflatoxin resistance in corn. The DNA from a single corn kernel can be used to analyze the gene expression that occurs in Aspergillus flavus inoculated maize. In order to compliment this procedure, aflatoxin extraction should be equally versatile. Aflatoxin extraction methods normally require several (10 - 250) grams of ground maize which may not be feasible in determining aflatoxin accumulation for a smaller region of the A. flavus infected ear. A single kernel extraction method is needed in order to accurately track aflatoxin concentration and maize gene expression at specific A. flavus infected sites on the cob.
2. Materials and Methods
2.1. Reagents and ChemicalsAll solvents and reagents were Optima LC/MS grade. Methanol, water, formic acid, and ammonium acetate were obtained from Fisher Scientific (Fair Lawn, NJ, USA). Purified aflatoxin B1 and M1 standards were ac-quired from Sigma Aldrich (St. Louis, MO, USA).
2.2. Sample Preparation
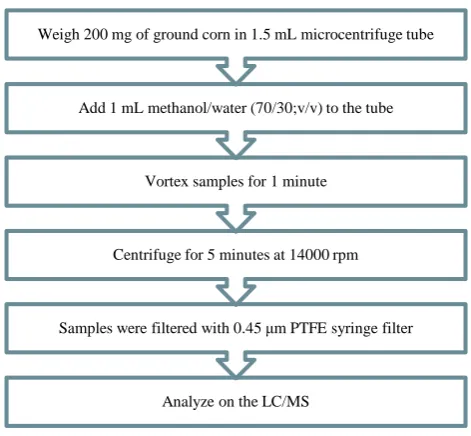
Maize kernels were flash frozen in liquid nitrogen. The kernels were ground into a fine powder with a mortar and pestle. 200 mg of each ground sample was placed into a 1.5 mL micro-centrifuge tube. Aflatoxin free ground maize was spiked with aflatoxin B1 to yield two levels of spiked samples (4 ppb and 20 ppb) of aflatoxin B1 for recovery. These concentrations were chosen because they are the limit for aflatoxin in food for human consumption in the European Union and the United States, respectively.
A solution of 1 mL (70/30, v/v) methanol/water was added to each 1.5 mL microcentrifuge tube. The samples were mixed for 1 minute and then centrifuged for 5 minutes at 14,000 rpm. Polytetrafluoroethylene (PTFE) sy-ringe filters (0.45 µm) were used to remove any large particles from the samples after centrifugation as shown in
[image:2.595.174.459.598.704.2]Figure 2. The liquid extracts were transferred to auto-sampler vials and analyzed using an Agilent 6460 LC/MS/MS Triple Quadrupole with electrospray ionization. Aflatoxin M1 was added as an internal standard at a concentration of 10 ppb. The calibration curve was matrix-matched with extracted aflatoxin-free maize solution.
Figure 1. Structures of aflatoxin B1 and aflatoxin M1 (ISTD).
Aflatoxin B1 Aflatoxin M1
H
H
OCH
3
O
O
O
O
O
O
O
O
O
O
OH
Figure 2. Sample Preparation workflow detailing single kernel aflatoxin extraction.
3. Experimental
The samples were analyzed using an Agilent 6460 LC/MS/MS Triple Quadrupole Mass Spectrometer with ESI, using an Agilent 1200 Series High Performance Liquid Chromatography (HPLC). The HPLC system consists of a binary pump (G1312B), infinity high performance degasser (G1379B), high performance autosampler (G1367E), thermostatted column compartment (G1316B), sampler thermostat (G1330B), and Mass Hunter data software. Aflatoxin B1 and M1 were optimized using the Agilent Optimization software. Aflatoxin M1 was used as an internal standard (ISTD) at 10 ppb. The Agilent Optimization software produces the ideal fragmentor vol-tage and collision energy for each MRM transition of aflatoxin B1 and M1 as listed inTable 1.
4. Instrumentation
4.1. HPLC Method Conditions
An Agilent 6460 LC/MS Triple Quadrupole Mass Spectrometer equipped with electrospray ionization (ESI) was used to analyze the aflatoxin concentration of the samples. The autosampler temperature was set to 4˚C. The HPLC used a Zorbax Eclipse Plus-C18 Narrow Bore 2.1 × 50 mm, 5 µm column with a temperature of 50˚C. The mobile phase consisted of 5 mM ammonium acetate with 0.1% formic acid in HPLC-grade water and 5 mM ammonium acetate with 0.1% formic acid in methanol. The flow rate of the mobile phase during the analysis was consistently 0.6 mL/min. The mobile phase gradient was transitioned from 95% water to 100% methanol during the six minutes of the analysis time. Then for the final three minutes of the run, the mobile phase re-versed from 100% methanol back to 95% water. The total run time of the method was nine minutes which in-cludes a six minute analysis time and an additional three minutes for the system to get back to equilibrium. The calibration curve was matrix-matched in order to reduce matrix effects. The six point calibration curve consisted of the concentrations 1 ppb, 5 ppb, 10 ppb, 25 ppb, 50 ppb, and 100 ppb as shown inFigure 3.
4.2. MS Method Conditions
The parameters for the mass spectrometer were the following. The Agilent 6460 Triple Quadrupole Mass Spec-trometer (MS/MS) system coupled to an electrospray analyzed the samples while in positive mode. The drying gas temperature was 325˚C while the gas flow was set to 10 liters per minute. The nebulizer gas pressure was set to 50 psi and the capillary voltage was 4000V. The Sheath Gas Flow had an output of 11 liters per minute and the sheath gas temperature reached temperatures of 350˚C. The delta electron multiplier voltage (EMV) was
Analyze on the LC/MS
Samples were filtered with 0.45 μm PTFE syringe filter Centrifuge for 5 minutes at 14000 rpm
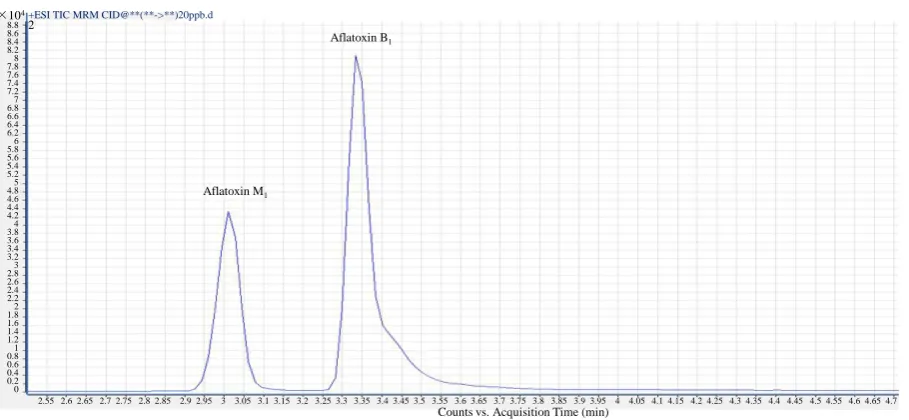
800V and the dwell time lasted for 200 msec. The precursor ion for aflatoxin B1 was 313.1 m/z and 329.1 m/z for aflatoxin M1. While in multiple reaction monitoring (MRM) mode, the mass spectrometer was set to look for the daughter ions after the precursor ion entered the collision cell. The transitions for aflatoxin B1 included 313.1 > 285.1 m/z with a collision energy of 20kEV, 313.1 > 269.1 m/z with a collision energy of 25 kEV, and 313.1 > 241.1 m/z with a collision energy of 35 kEV. The fragmentor value was 166 for aflatoxin B1 and for af-latoxin M1 was 131. The cell accelerator (7) values were the same for both afaf-latoxin transitions. The two transi-tions used for identifying aflatoxin M1 are 329.1 > 273.1 m/z and 329.1 > 229.1 m/z. The retention time of afla-toxin M1 was 3.0 minutes and 3.4 minutes for aflaafla-toxin B1 as shown inFigure 4. Agilent MassHunter Quantita-tive Analysis Workstation Software v. B.04.0.225.19 was used to analyze the quantitaQuantita-tive data obtained from the samples and the calibration curve.
Table 1. MRM transitions for aflatoxin B1 and the internal standard, aflatoxin M1.
Compound (Aflatoxin) Retention Time (min) Fragmentor Voltage (V) Collision Energy (eV) Precursor Ion (m/z) Product Ion (m/z)
B1 3.4 166 21 313.1 285.1
B1 3.4 166 33 313.1 269.1
B1 3.4 166 41 313.1 241.1
M1 (ISTD) 3.0 131 25 329.1 273.1
[image:4.595.90.538.225.479.2]M1 (ISTD) 3.0 131 41 329.1 229.1
Figure 3. Matrix matched calibration curve for aflatoxin B1 from concentration of 1.0 ppb to 100 ppb.
Figure 4. Chromatogram of aflatoxin B1 standard at 20 ppb with aflatoxin M1 as the internal standard at 10 ppb. y=4728.332647*x-9486.959111
R^2=0.99639722
Concentration (ng/ml) −5 0 5 10 15 20 25 30 35 40 45 50 55 60 65 70 75 80 85 90 95 100 105
×105
4.5 4 3.5 3 2.5 2 1.5 1 0.5 0
Aflatoxin B1
Aflatoxin M1
+ESI TIC MRM CID@**(**->**)20ppb.d
×104
Counts vs. Acquisition Time (min)
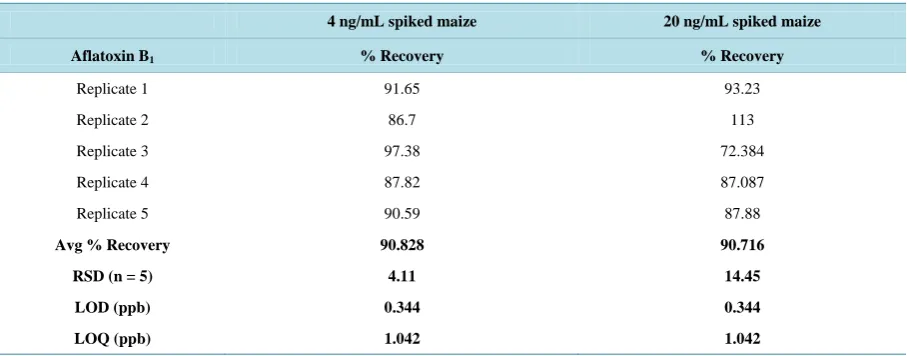
[image:4.595.89.544.496.706.2]Table 2. Average percent recoveries and RSD values obtained from spiked corn samples.
4 ng/mL spiked maize 20 ng/mL spiked maize
Aflatoxin B1 % Recovery % Recovery
Replicate 1 91.65 93.23
Replicate 2 86.7 113
Replicate 3 97.38 72.384
Replicate 4 87.82 87.087
Replicate 5 90.59 87.88
Avg % Recovery 90.828 90.716
RSD (n = 5) 4.11 14.45
LOD (ppb) 0.344 0.344
LOQ (ppb) 1.042 1.042
5. Results and Discussion
Table 2 demonstrates the average percent recoveries and relative standard deviation (RSD) values obtained from the spiked corn samples after performing the single maize kernel aflatoxin extraction. The analysis was performed in replicates of five at each of the two levels. The average percent recoveries for the 4 ppb and the 20 ppb aflatoxin B1 spiked maize were 90.83% with a RSD of 4.11% and 90.72% with a RSD value of 14.45% re-spectively. Calibration standards were matrix matched with a range from 1 ppb to 100 ppb with a linear correla-tion (R2) of 0.996 as shown inFigure 3. In The limit of detection (LOD) and limit of quantification (LOQ) were estimated from the concentration of aflatoxin B1 required to give a signal to noise ratio of 3:1 and 10:1 respec-tively. The LOD was determined to be 0.344 ppb and the LOQ was calculated to be 1.042 ppb. The internal standard, aflatoxin M1, injected at 10 ppb accounts for possible instrument variation. Aflatoxin M1 was chosen to be the internal standard because it has a structure similar to aflatoxin B1 but is not produced by A. flavus. Af-latoxin M1 is also less expensive and more readily available commercially than the radiolabeled form of afla-toxin B1. Methanol was the preferred solvent for aflaafla-toxin extraction due to its compatibility with the ELISA testing and the cost effectiveness over other solvents like acetone and acetonitrile [12] [13]. This simplified af-latoxin extraction method is analogous to other extractions methods in terms of afaf-latoxin recovery without the need for solid phase extraction or clean up columns [14]. The single maize kernel extraction method was needed in order to more accurately determine the changes in aflatoxin production, gene transcription, and protein pro-duction between inoculated and control maize kernels.
6. Conclusion
This process demonstrates a fast, simple, and effective analytical method for determining aflatoxin concentra-tions in a single maize kernel using an Agilent 6460 Triple Quadruple Mass Spectrometer. The detection levels for aflatoxin B1 were below both the limit set by the FDA in the United States and the limit set by the EC in the European Union. The recovery percentages for aflatoxin B1 were 90.83% for 4 ppb and 90.72% for 20 ppb with a satisfactory average RSD less than 15%. The single kernel extraction method will be a useful technique in de-termining how aflatoxin producing Aspergillus flavus affects infected maize.
Acknowledgements
References
[1] Smart, M.G., Shotwell, O.L. and Caldwell, R.W. (1990) Pathogenesis in Aspergillus Ear Rot of Maize: Aflatoxin B1 Levels in Grains Around Wound Inoculation Sites. Phytopathology, 80, 1283-1286.
http://dx.doi.org/10.1094/Phyto-80-1283
[2] Guchi, E. (2015) Implication of Aflatoxin Contamination in Agricultural Products. American Journal of Food and Nu-trition, 3, 12-20.
[3] Zeringue, H.J., Shih, B.Y., Maskos, K. and Grimm, D. (1999) Identification of the Bright-Greenish-Yellow-Fluorescence (BGY-F) Compound on Cotton Lint Associated with Aflatoxin Contamination in Cottonseed. Phytochemistry, 52, 1391-1397. http://dx.doi.org/10.1016/S0031-9422(99)00432-X
[4] Trenk, H.L. and Hartman, P.A. (1970) Effects of Moisture Content and Temperature on Aflatoxin Production in Corn.
Applied Microbiology, 19, 781-784.
[5] Smela, M.E., Currier, S.S., Bailey, E.A. and Essigmann, J.M. (2001) The Chemistry and Biology of Aflatoxin B1: From Mutational Spectrometry to Carcinogenesis. Carcinogensis, 22, 535-545.
http://dx.doi.org/10.1093/carcin/22.4.535
[6] Greenblatt, M.S., Bennett, W.P., Hollstein, M. and Harris, C.C. (1994) Mutations in the p53 Tumor Suppressor Gene: Clues to Cancer Etiology and Molecular Pathogenesis. Cancer Research, 54, 4855-4878.
[7] Clewell, R.A., Sun, B., Adeleye, Y., Carmichael, P., Efremenko, A., McMullen, P.D., Pendse, S., Trask, O.J., White, A. and Andersen, M.E. (2014) Profiling Dose-Dependent Activation of p53-Mediated Signaling Pathways by Chemicals with Distinct Mechanisms of DNA Damage. Toxicological Sciences, 142, 56-73.
http://dx.doi.org/10.1093/toxsci/kfu153
[8] Vainio, H. and Wilbourn, J. (1992) Identification of Carcinogens within the IARC Monograph Program. Scandinavian Journal of Work, Environment & Health, 18, 64-73.
[9] Otsuki, T., Wilson, J.S. and Sewadeh, M. (2001) Saving Two in a Billion: Quantifying the Trade Effect of European Food Safety Standards on African Exports. Food Policy, 26, 495-514.
http://dx.doi.org/10.1016/S0306-9192(01)00018-5
[10] Wu, F. and Guclu, H. (2012) Aflatoxin Regulations in a Network of Global Maize Trade. PLoS ONE, 7, e45151.
http://dx.doi.org/10.1371/journal.pone.0045151
[11] Robens, J. and Cardwell, K. (2003) The Costs of Mycotoxin Management to the USA: Management of Aflatoxins in the United States. Journal of Toxicology: Toxin Reviews, 22, 139-152. http://dx.doi.org/10.1081/txr-120024089
[12] Bertuzzi, T., Rastelli, S., Mulazzi, A. and Pietri, A. (2011) Evaluation and Improvement of Extraction Methods for the Analysis of Aflatoxins B1, B2, G1 and G2 from Naturally Contaminated Maize. Food Analytical Methods, 5, 512-519.
http://dx.doi.org/10.1007/s12161-011-9274-5
[13] Spanjer, M.C., Rensen, P.M. and Scholten, J.M. (2008) LC–MS/MS Multi-Method for Mycotoxins after Single Extrac-tion, with Validation Data for Peanut, Pistachio, Wheat, Maize, Cornflakes, Raisins and Figs. Food Additives & Con-taminants: Part A, 25, 472-489. http://dx.doi.org/10.1080/02652030701552964
[14] Khayoon, W.S., Sadd, B., Yan, C.B., Hashim, N.H., Ali, A.S.M., Salleh, M.I. and Salleh, B. (2010) Determination of Aflatoxins in Animal Feeds by HPLC with Multifunctional Column Clean-Up. Food Chemistry, 118, 882-836.
http://dx.doi.org/10.1016/j.foodchem.2009.05.082