’ r~ ECONo~41C , ~ESEARCH 8,,5;D-LTE
NENO,.ANDUN SgR.B~S
By C. E. V. Leser.
re is much discussion in progress about
industrialisation and about developing countries, but it
is not self-evident what exactly these mean. Conceptually
the most useful indicator of a country’s state of
industrialisation may be the value added in manufacturing
per heed of total population, reduced to a common currency
and to constant prices as required. This has been estimated
by the U.N. Statistical Office for a large number of
countries with ro~ard to 1958 and other bench-mark yea~s,
expressed in 19S3 U.S. dollars. Only "market economies"
are covered; comparisons with the U.S.S.R. and Eastern
Europe are only possible on the basiG of industrial
activity as a whole (incl.mining, electricity and gas),
and comparable data are lacking for mainland China and
several other countries.
On the-basis of manufacturing value added per
capita of population in 1958, countries were classified
as industrialised or less industrialised; more recently,
a somewhat different classification into developed and
developing countries came into use. Neithor of these
classifications are satisfactory as they create anomalies
in border line cases. However, the per capita value
added in ~anufacturing provides an obvious criterion for
dividing ~e countries of the world into three groups~ as
there are two clearly marked breaks in the series. The
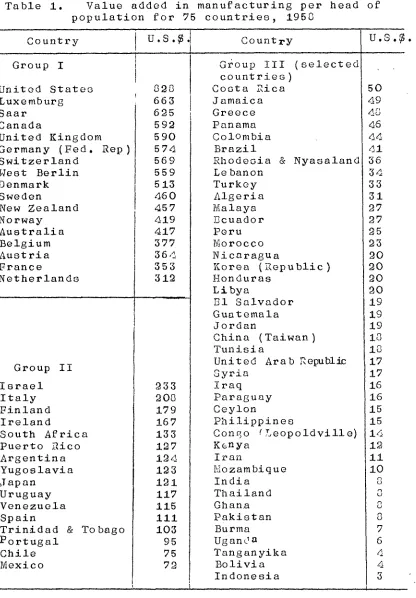
three groups of countries are shown in Table i: most of
the major countries not individually shown, apart from
the centrally planned economies , belong to the third
category. There were thus,in 1958, 17 countries in
Group I and 16 countries in Group II; 42 Group III countries
are listed.Ireland is clearly in the middle group though
2
-Table i. Value added in manufacturing per head population for 75 countries, 1958
Country Group I United States Luxemburg Saar Canada United Kingdom Germany (Fed. Switzerland West Berlin Denmark Sweden New Zealand Norway Australia Belgium Austria France Netherlands Rep ) U.S.~. Country Group III countries) Costa Xica Jamaica Greece Panama ColOmbia Brazil Rhodesia & Lebanon Turkey Algeria Malaya Ecuador Peru Morocco Nicaragua 828 663 625 592 590 574 569 559 513 460 457 619 417 377 3 6 ,i
(selected Nyasaland 353 312 Korea (Republic) Honduras Libya 91 Salvador Group Ii Israel Italy Finland Ireland South Africa Puerto Rico Argentina Yugoslavia Japan Uruguay Venezuela Spain Trinidad & Portugal Chile Mexico To bags 233 208 179 167 133 127 126 123 121 117 115 111 103 95 75 72 Guatemala Jordan China (Taiwan) Tunisia
United Arab ~epublic Syria Iraq Paraguay Ceylon Philippines Con~o ~Leopoldville) Kenya Iran ~,~ozambique India Thailand Ghana Pakistan Burma Ugan@a Tanganyika Bolivia Indonesia
u.s .~.
5O 69 48 66 d4 dl 36 34 33 31 27 97 95 23 90 2O 9O 20 19 19 19 18 18 17 17 16 16 15 15 16 12 iiIo
8 3 8 8 7 6 4 4 3 [image:2.576.90.506.78.676.2]A low per capita manufacturing output may
indicate either that the proportion of the total population
engaged in manufacturing is low, or that output per person
engaged is low; generally it will reflect both. This
may be shown by computing,~ for the 75 countries listed
in Table i, a double-logarithmic, regression of manufacturing
employment L on output P. Herein, P represents the
values given in Table i, and L the number of persons
engaged in manufacturing per 1,000 inhabitants obtained
from the same ~ource. , The resulting equation for the computed value Lc is
lOglo Lc = 0.554 + 0.573 loglo P (R2 = .817)
(0.032)
0.573
or L = 3.58 x P
c
Output per person engaged in ~ is then represented by
the expression I,OOO P/L, and we have
II,O00 ~ = 279 x P0"427L c
Thus manpower in manufacturing tends to rise slightly
faster than output per head with rising industrial
production.
A similar relationship, though referring not
to a point in time but to changes over time, is the
"Verdoorn Law" recently quoted by Kaldor (1966), who
applies it to annual exponential growth rates between
1953-4 and 1963-4 in 12 industrial countries. The
result obtained is a O.516~ increase in employment and
a 0.~84~ increase in productivity asGociated with a i~
increase in manufacturing output, apart from an autonomous
4
-However, the deviations from the relationship
are as important as the relationship itself and may be
studied for the 75 countrie~ analysed here. Table 2
shows that there is a systematic regional element in
these deviations which cuts across the grouping of
countries by level of industrialisation. The averages
shown hero represent unweighted geometric means.
Table 2. Actual and expected number of persons engaged in manufacturing by group of
of countries and region, 1956.
Number Average Average persons engaged
of value __ per 1,000 inhabitants
Countries countries added per
inhabitant Actual ~xpoctod Actual on basis of(expected
regression = 100)
Group I
America &
Oceania 4 553 91.2 133 .d 63
Europe 13 478 139.8 122.8 114
Total 17 494
125.. -
101Group II l
America
I
7 102 43.2 50.8 85Europe
Others I
6 142 73.3 61.2 120
3 155 62.1 64.6 96
Total " 16 ’12 5
56.4
57.0 99J Group III
Africa 12 14 10.9 16 .2 67
America 13 25 96 .6 22.4 119
E & S.E. Asia
Middle Eas~
11 11 18 .I 14.1
!28
& Europe 6 26 22.3 22.9 97
,, Total <~2
I 17
1~. 1
1’~’. 1, , L, 10035.9
i00
Sourcs: Derived from U.N. ,
1930 - 1961.
Thus in the European countries of groups I and
II, employment makes a relatively large contribution and
output per head a relatively small contribution to the
level of manufacturing output attained, whilst the
opposite is tile case with regard to North America and
Oceania in group I and the Latin American countries
of group II. Similarly, the Asian and Latin American
group III countries are characterised by relatively
high employment and low output per head, whilst the opposite
effect is very marked for the African countries.
These differences are clearly not accidental
but in response to conditions such as population
pressure or sparsity. One may therefore surmise that
manpower shortage need not be an effective obstacle to
industrial growth and may in fact facilitate rises in
productivity. Of course, in most developing countries
this is not a major issue.
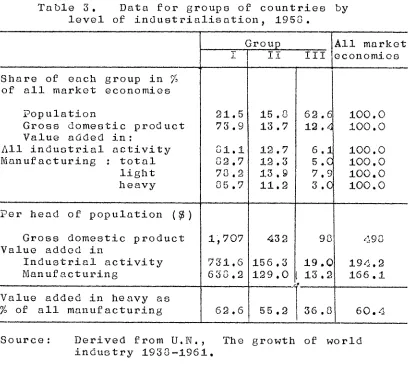
Some further characteristics of the three
groups of countries as a whole are presented in Table
3, which is based on totals, group III including countries
not listed in Table I~ in contrast to Table 2, the
per head figures and proportions of heavy industries
in total manufacturing thus represent weighted arithmetic
means of individual country data. In accordance with
the U.N. definition, light manufacturing includes food,
beverag~ and tobacco; textiles; clothing, footwear and
made-up textiles; wood products and furniture; printing
and publishing; leather and leather products; rubber
products; miscellaneous manufactures. Heavy
manufact-uring consists of: paper and paper products; chemicals
and chemical, petroleum and coal products; non-metallic
6
-Table 3. Data for groups of countries by level of industrialisation~ 1958.
Share of each group in % of all market economies
Population
Gross domestic product Value added in:
All industrial activity Manufacturing : total
light heavy
Per head of population ($)
Gross domestic product Value added in
Industrial activity Manufacturing
Value added in heavy as of all manufacturing
1; 707
731,5 033.2
Group
z i ii
21.5 15.8 73.9 13.7
31.1 12.7 ~2.7 12.3 78.~ 13.9 05.7 11.2
432
62 .f 19.,<
6.1 5.0 7.9 3.0
98
156.3 19.0 129.0:13.2
I 62.6
All market !II economies
I00.0 i00.0
i00.0 i00.0 i00.0 i00.0
4:93
194.2 166.1
60.4
Source: Derived ffrom U.N., The growth off world industry 1933-1961.
The discrepancy between the distribution of
population and that of productive capacity is striking.
In 1958~ about five people lived in group III countries
for every three in groups I and II countries. On the
other hand,almost three-qUarters of the value of goods
and services produced in the countries studied here
originated in group I countries alone. The degree of
concentration becomes successively more marked when
attention is confined first to industrial activity~ then
to manufacturing and finally to heavy manufacturing.
To put it in a different way~ gross domestic
product per capita is more than 17 times as high in group
I than in group III countries: but the disparity is loss
than with regard to manufacturing value added~ for which
the corresponding ratio is more than 48:1. Thus as
industrialisation proceeds~ growth in the non-manufacturing
[image:6.576.101.510.66.434.2]manufacturing, though at a lower rate. It is a matter
of definition whether this is interpreted as "balanced"
or’hnbalanced"growth.
This relationship between growth of different
economic sectors does not say anything about cause and
effect. Manufacturing may well be considered as the
leading sector in many instances~ but this need not be
universally true; in some countries, manufacturing growth
may be a secondary phenomenon following an expansion
of oil production or other mining. In relation to
agriculture, however, manufacturing is more likely to
be leading tham the converse¯ This is so because in
the less developed countries~ many industries are based
on domestic agricultural products and their expansion
will stimulate output. The linkage from agriculture
to industry is generally weaker, as in these countries
increased demand for farm machinery and fertilisers may
largely be met by imports.
Another striking feature of Table 3 is the
difference in composition off manufacturing output between
countries of dufferent levels of industrialisation.
For the market economies as a whole~ light industries
account for about two-fifths and heavy industries for
about three-fifths of the output value. Similar
proportions are found for groups I and II as a whole~
but in group III the emphasis is very heavily on light
manufacturing¯
Nithin each group, however~ there are
considerable variations in composition of manufacturing
output. The proportion accounted for by heavy
manuf-acturing varies from ~B2.97~ for Luxemburg to 40.97~ for
O
-for Ireland An group II, and from 86.87 -for Iran to 8.5)~
for Honduras in the specified group III countries.
A partial explanation of the variations in
broad manufacturing pattern is provided by the following
regression, estimated on the basis of 75 observations
for 1958.
H = - 11.44 + 21.545 log c
(2.2 i)
+ 0.3675 z (0.0736)
in which H
i0 P + 9.426 lOglo (2.354)
= .59s)
I’!
indicates the computed percentage of heavy c
manufacturing, P per capita manufacturing value added
in ~, N ~otal population in millions, and z the
percentage of mining in value added by all industrial
activity; z is used to indicate, even though
im-perfectly, the character of natural resources.
All the regression coefficients are highly
significant, The first two coefficients may be
interpreted when transformed into elasticity form,
together with complementary results for light manufacturing.
It is then found that, on the average, a 17~ higher total
manufacturing value is accompanied by a 0.~/~ higher
value of light manufacturing and a 1,23~ higher value
of heavy manufacturing. Similarly a i~ greater population
tends to be accompanied by a 0.93~< higher light
manuf-acturing output and a I.i0~ higher heavy manufmanuf-acturing
output.
These findings tally with those of studies
by Chenery (1960) and U.N. (1963), which go into greater
detail as regards manufacturing groups analysed but
did not eotablish an influence o£ natural resources.
associated not only with greater industrialisation but
also with larger population size for countries of equal
per capita manufacturing output. This is in accordance
with expectation as most heavy industries require a
minimum scale of output and thus a minimum size of market ~r
economic production.
The last regression coefficient shows that
heavy industries, ceteris paribus, play a larger role
in countries with substantial mining resources and
activity than in others. This is also what one should
expect to find.
Of course, the differences in level of
industrial output act as a statistical but not as a
logical explanation of differences in industrial pettern.
The low share of heavy industries in one of the less
developed countries could conceivably result from a
demand pattern in which capital goods and durable
consumer goods play a relatively minor role. This is
true to some extent but not sufficiently to account for
the large variations in the proportions of light and
heavy manufacturing. Their main explanation must be
sought in the greater difficulties with which the
establishment of most heavy industries is faced in the
initial stages of industrialisation.
Indeed, Hoffman (1950) uses a similar measure
the ratio of consumer goods output to capital goods output
-as a criterion to determine the stage of industrialisation
which the presently developed countries had reached at
any given time. Rigid application loads to somewhat
paradoxical results such as Britain still having been
in the first stage of industrialised by 1870. As a
general rule, however, it seems true that the majority
10
-of heavy industries at a late stage -of industrialisation.
So far the discussion has been in static terms,
describing the position at a particular point of time.
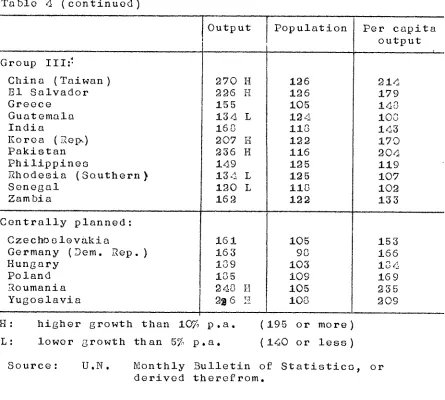
It may now be supplemented by a brief analysis of recent
trends~ taking 1958 as the starting point. Table 4
shows the growth of manufacturing production between
that date and 1965~ contrasted with population growth,
for those countries for which estimates in the form of
production index numbers are available.
Table 4. Increase in manufacturing output and population, 43 countries, 1950 to 1965.
Count
Group I :
Australia Austria Belgium Canada France
Table 4 (continued)
Output Population Per capita
output f Group III:~
China (Taiwan) 270 H 126 214
~i Salvador 226 H 126 179
Greece 155 105 143
Guatemala 134 L 124 100
India 16°O 118 143
Korea (~e~,) 207 H 122 170
Pakistan 236 H 116 204
Philippines 149 125 119
~hodesia (Southern} 134 L 125 107
Senegal 120 L 118 102
Zambia 122 133
Centrally planned:
Czechoslovakia 161 105 153
Germany (Dem. Rep. ) 163 98 166
Hungary 109 103 1u _.
Poland 135 109
~oumania
169
248 H 105 ~35
Yugoslavia 108 209
H:
L:
higher growth than 10[~ p.a.
lower growth than 5~ p.a.
(195 or more)
(140 or less)
Source: U.N. Nonthly Bulletin of Statistics, or derived therefrom.
The most striking feature of Table 4 is the
contrast between the high degree of uniformity observed
for the group I countries and the wide variety of
experiences in group III countries. In most of the
highly industrialised countries, the average annual
growth in manufacturing production between 1950 and 1965
was a little above 5%. But out of 11 countries lis~ed
which belong to the least industrialised group~
manufacturing growth rates exceeded 10% in 4 and fell
short of 5~ in 3 countries.
The countries in the intermediate group, to
which the centrally planned economies may be added,
also occupy an intermediate position as far as variations
between individual countries are concerned. In most
[image:11.576.96.541.87.487.2]12
-somewhat higher than the group I norm, the chief exception
being the Argentine which experienced a very severe
depression in the early 1960s.
~opulation growth tends to be in inverse relation
with level of industrialisation~ and the experience of
the group II and group III countries does not appear in
the same favourable light if manufacturing output per
head of population is considered instead of total volume.
Indeed in some countries~ the greater part of the output
growth is absorbed by population increase~ though this
appears to be the exception rather than the rule on the
limited basis of listed countries.
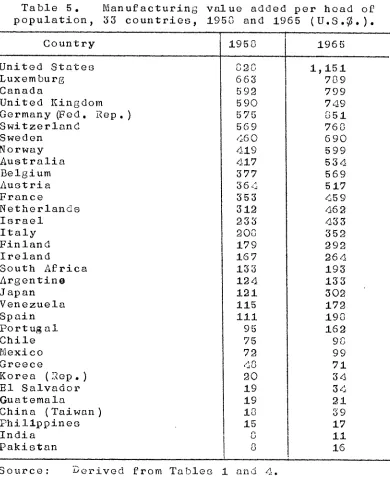
Furthermore, the impact of a high manufacturing
growth rate iG necessarily limited if it applies to a
very narrow initial base, and it should be viewed in
connection with the level of manufacturing output which
results. Assuming the industrial production indices
given in Table 4 to be applicable to the Table I value
added figures for 195C, a similar set of figures may
Table 5. Manufacturing value added per head of population, 33 countries, 1956 and 1965 (U.S.~.).
Country 1958 1965
United States Luxemburg Canada
United Kingdom Germany (Fed. Rep.) Switzerland Sweden Norway Australia Belgium Austria France Netherlands Israel Italy Finland Ireland South Africa Argentine Japan Venezuela Spain Portugal Chile Mexico Greece Korea (2ep.) E1 Salvador Guatemala China (Taiwan) Phillppines India Pakistan u~o~ 663 592 590 575 569 /60 419 117 377 353 312 23’5 208 179 167 1’53 124 121 115 Iii 95 1,151 789 799 749 851 768 690 599 5’54 569 517 459 462 433 352 292 264 193 133 302 172 190 162 75 72 ,sO 20 19 19 18 15 5 8 i 99 71 34 34 21 ,59 17 11 16
Source: Derived from Tables 1 and 4.
The grouping of countries which was based on
1958 still appears to be applicable in 1965, though the
break between groups I and Ii has become less marked
and one might be inclined to draw the boundary further
down the scale. Within the groups there have boon
some changes in position, the most spectacular one
being the upward movement of Japan. However, it is
clear that differences between industrialisation levels
achieved in rich and poor countries remain as large
as ever. For the countries shown in Table 5, the
whilst in 1965 they are ~ 58~ and ~ 8.4.5 respectively
their ratio is about 7:1 in both years. There is
thus no really substantial movement towards greater
equality.
When assessing the prospects of developing
countries, one has to specify clearly what kind of
developing country one is thinking of. Broadly speaking,
countries in group II appear to have passed the
"take-off stage", and continued industrial progress appears
to be reasonably well assured. For countries in group
III sustained progress seems to be less certain and
depending on their government policy and its effectiveness
as well as on aid from abroad. There are disadvantages
as well as advantages for countries which experience or
t~ to promote an industrial revolution much later than
the countries of the Western world.
Industrialisation is not an end in itself,
but current thinking seems to be to the effect that it is
indispensable for a sustained rise in living standards ~
if only to develop exports which are less v ulaarable
to demand and supply fluctuations than primary products
and which are necessary to pay for imports. The old
division of labou, between primary producer countries
and workshops of the world is bound to disappear or
at least to become blurred. A new international
division of labour, with industries which to some extent
follow the pattern of natural rosourcos~ still remains
References,
Chenery, H. B. (1960), "Patterns of industrial , growth" American ~conomic Review vol 5©9 pp. 624-65‘4
Hoffman, W. G. (1958). The growth of industrial economies. ~anchester: University Press.
Kaldor, ~. (1966), Cau~es of the slow rate of economic growth of the United Kingdom. Cambridge: University Press.
United ~ations (1963), New York: U. N.