Munich Personal RePEc Archive
Economic Graphical Modeling from
2-Dimensional Graphs to
Multi-Dimensional Graphs
Ruiz Estrada, M.A.
University of Malaya
28 October 2010
Online at
https://mpra.ub.uni-muenchen.de/40563/
Economic Graphical Modeling from 2-Dimensional Graphs
to Multi-Dimensional Graphs
Mario Arturo Ruiz Estrada
Faculty of Economics and Administration, University of Malaya, 50603 Kuala Lumpur, MALAYSIA
Email: [email protected]
Website: www.econonographication.com
Tel: +006012-6850293
Abstract
This paper is interested to show the limitations that the 2-Dimensional and 3-Dimensional graphs
are showing when we try to visualize the behavior of large number of variables, equations and
functions in the same graphical space. Therefore, we suggest the application of
multi-dimensional graphs under the application of Econographicology. The Econographicology is
available to offer a large number of multi-dimensional graphs to economists, academics and
policy makers to observe the behavior of a large number of variables, equations and functions in
the same graphical space.
Keywords: Econographicology, Multi-dimensional graphs, Cartesian Spaces.
JEL: E6
Since economists and academics start to use graphs to visualize the behavior of simple (static) or
complex (dynamic) economic data in different periods of time in the same graphical space. The
most common graphs applied on the economic analysis are the 2-Dimensional graphs to
visualize historical data, micro-macroeconomics theories and final results from econometrics
models. For example, the graphical visualization of any economic variable behavior such as the
G.D.P. rates, inflation rates, exports/imports, etc… It is based on the application of the 2-Dimensional graphs. Usually, economists always try to interpret a group of points located in
different places into the first quadrant of the 2-Dimensional Cartesian plane into a fixed period of
time. All these points are connected by strait lines to visualize the historical trends from the past
until today or possible results from forecasting models. Additionally, this research paper try to
find some reasons about “WHY” economists continue using 2-Dimensional graphs and 3-Dimensional graphs in the graphical visualization of a group of variables behavior, these reasons
1. The 2-Dimensional graph modeling is established for long time, since the introduction of
the Dimensional Cartesian plane by Descartes until today. The application of
2-Dimensional graphs in the economic graphical analysis became by “Tradition”.
2. The 2-Dimensional space is “easy to apply” for visualize basic trends or values in the same graphical space. According to our research through 5,000 documents (JSTOR and
DIRECT SCIENCES -ELSEVIER-, 2008) were selected by random from different
reputable journals and text books in economics, econometrics, business, statistic,
mathematic and sciences. The 99.50 % of all these documents were used 2-Dimensional
graphs and only 0.05% was used 3-Dimensional graphs. The logic explanation about the
common uses of the 2-Dimensional graphs, it can be originated by the easy way to plot
and draw and visualize any economic variable(s) behavior. Therefore, 2-dimensional
graphs can generate a clear visual and mental refraction to understand a group of
variables behavior in the same space and time.
3. Difficulty to find “ alternative and suitable multi-dimensional graphical models” to generate the transition from 2-Dimensional space graphical modeling to
Multi-dimensional graphical modeling. This research paper found some difficulties to generate
this crucial visual and mental transition from 2-Dimensional graphs to Multi-dimensional
graphs. It can be by some difficulties in the process to plot, draw and visualization of new
type of graphs.
On the other hand, the main proposition of this research paper is that the 2-Dimensional and
3-Dimensional graphs are not available to catch up the behavior of large number of economic
variables simultaneously in the same graphical space. We can observe that in complex behavior
of a group of variables always they are changing constantly and unlimited all the time. To test
this proposition, this research paper concern that multi-dimensional graphs can show “n” number of economic variables behavior into the same graphical space. Moreover, the idea about space
and time in the case of multi-dimensional graphs is totally different from the 2-Dimensional or
3-Dimensional graphs, because the 2-3-Dimensional or 3-3-Dimensional graphs is only available to
show graphically a micro-slice of the behavior of a serial of economic variables, equations and
The Multi-Dimensional (MD) graphs in the process to visualize the behavior of a group of
variables through a period of time in the same graphical space. Therefore, this paper will suggest
the review of the “n-Dimensional Space“ to support the uses of MD graphs in economics. The initial idea about n-dimensional space was originated by Greeks thinkers, philosophers and
mathematians such as Socrates, Plato, Heraclitus and Euclid (father of the geometry). The great
contribution of Euclid in geometry was the design of the plane geometry under the
2-Dimensional Euclidean geometry and the solid geometry under the 3-2-Dimensional Euclidean
geometry.
However, the n-dimensional space can be defined as a mental refraction through the optical
visualization and brain stimulation by several lines in a logic order by length, width, height and
colors to represent the behavior of simple or complex behavior of a group of economic variables,
equations and functions in different periods of time in the same graphical space. The study of
n-dimensional space can be classified by 2-Dimensional space, 3-Dimensional and MD-graphs.
Usually, the study of n-dimensional space is based on the application of the “coordinate system“.
The role of coordinate system is crucial in the analysis of n-dimensional space because it can
show clearly the location and interaction between two or more variables: Exogenous variable (s)
and Endogenous variable (s) on the same graphical space.
It is perhaps fitting to mention here that the 2-Dimensional Cartesian coordinate system was
introduced in 1637 by René Descartes (Lafleur, 1960), whose contributions to different scientific
disciplines, of which economics was one, were substantial. The 2-Dimensional Cartesian
coordinate system opened a new era in economic analysis by providing for the analysis of a
single economic phenomenon. In fact, the 2-Dimensional Cartesian coordinate system is
available to visualize the relationship between the exogenous variable (under the vertical axis =
Y-coordinate) and the endogenous variable (under the horizontal axis = X-coordinate) in the first
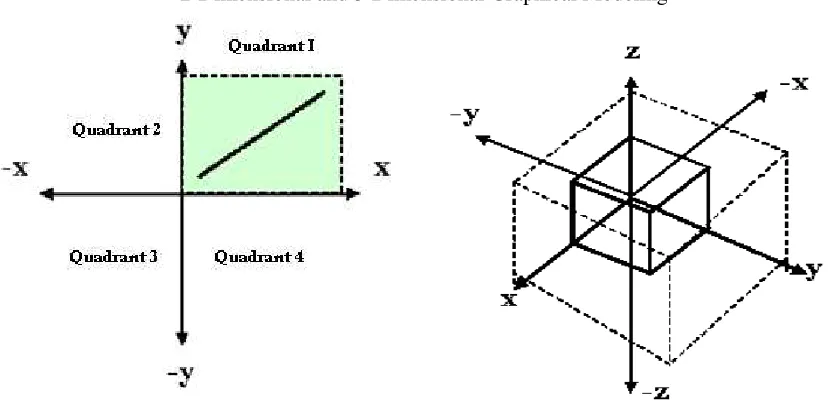
quadrant in the Cartesian coordinate system (See Figure 1). Or the observation of the trend of a
single economic variable (e.g. exports, imports, unemployment, GDP, inflation rate etc.) within a
time frame (per decade, annually, monthly, weekly or daily), it is based on the uses of
histograms, line graphs and scatter-plots. In the case of 3-Dimensional Cartesian coordinate
system (X,Y,Z) support the construction of surfaces and 3-D manifolds, it is based on the uses of
exogenous variable) and the “Z-coordinate“ (or endogenous variable). Usually, the
3-Dimensional Cartesian coordinate system work under the Euclidean geometry theoretical
framework. The main objective of the 3-Dimensions Cartesian coordinate system (See Figure 1)
in economics is to study the behavior of two exogenous variables (X,Y) can affect directly on the
[image:5.612.94.509.208.418.2]endogenous variable (Z).
Figure 1
2-Dimensional and 3-Dimensional Graphical Modeling
Finally, the construction of Multi-dimensional graphs is based on the traditional 3-Dimensional
space concept, but they can represent 4-Dimensional, 5-Dimensional, 8-Dimensional,
9-Dimensional until Infinity-9-Dimensional spaces. The Multi-9-Dimensional graphs can facilitate the
easy understanding of complex economic phenomena under the visualization of large amount of
exogenous variables can affect directly on the endogenous variable (s).
However, the multi-dimensional graphs have different quadrants are distributed “n” number of
variables that they are moving constantly and generating different graphical representations. At
the same time, each quadrant into the multi-dimensional graphs shows the behavior of all
variables that moving at different speeds of time. Hence, we assume that exist different types of
time; these times are following by the general time, partial times and constant times. Initially, the
general time is running in all multi-dimensional graph quadrants. For the partial time, it is the
present time that it is running now in each quadrant into the multi-dimensional graphs but always
Moreover, it is important to be mentioned about the role of the Euclidian geometry (Dodge,
2004) and Minkowski’s 4-Dimensional space (Einstein, 1951) to support our proposition. These
two geometrical modeling frameworks are supported by its formal mathematical theoretical
frameworks. In fact, these two geometrical modeling frameworks don’t show any graphical
modeling to facilitate the visualization of 4-Dimensional until Infinity Dimensional graphs. In
our case Econographicology proposes a set of new multi-dimensional graphs that is missing in
the Euclidian geometry and Minkowski’s 4-Dimensional graphical modeling.
The rationale of Econographicology revolves around the efficacy of multi-dimensional (MD)
graphs as the most effective analytical tool for visualization of any economic phenomena. The
main motivation behind the creation of Econographicology is to evaluate graphs evolved so far
in economics and to develop new type of graphs to facilitate the study of economics, as well as
finance and business. Thereby, the mission of Econographicology is to offer academics,
researchers and policy maker’s alternative analytical tool in the research and teaching-learning process of economics, finance, sciences and business. At the inception of Econographicology,
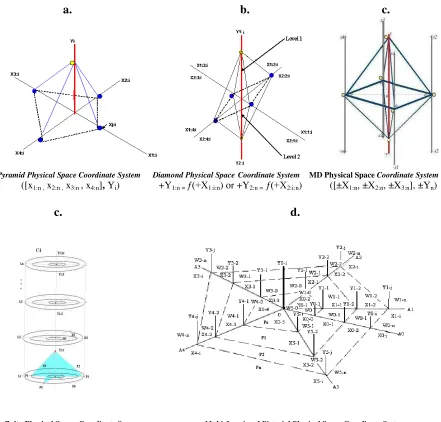
the following new types of graphs are presented: Pyramid Physical Space (See Figure 2, Picture
a.), Diamond Physical Space (See Figure 2, Picture b.), Multi-Dimensional Physical Space (See
Figure 2, Picture c.), Infinity Physical Space (See Figure 2, Picture d.) and Multi-functional
Pictorial Physical Space (See Figure 2, Picture d.). These Multi-dimensional graphs are
constructed based on the traditional 3-D space concept, but they represent 4-D, 5-D, 8-D, 9-D
and Infinity-Dimension. The multiple-dimensional representations are to facilitate easy
understanding of economic phenomena from a general view.
Finally, we can observe in the large number of multi-dimensional graphs offer by
Econographicology (Ruiz, 2007), it is possible to plot and visualize large number of economic
variables, equation and functions simultaneously in the same graphical space that is not possible
to be visualized on the 2-Dimensional and 3-Dimensional graphs. Hence, the idea of economic
Figure 2:
Pyramid Physical Space, Diamond Physical Space, Multi-Dimensional Physical Space, Infinity Physical Space and Multi-functional Pictorial Physical Space.
a. b. c.
Pyramid Physical Space Coordinate System Diamond Physical SpaceCoordinate System MD Physical Space Coordinate System ([x1:n , x2:n , x3:n , x4:n], Yi) +Y1:n = ƒ(+X1:i:n) or +Y2:n = ƒ(+X2:i:n) ([±X1:n, ±X2:n, ±X3:n], ±Yn)
c. d.
Infinity Physical SpaceCoordinate System Multi-functional Pictorial Physical Space Coordinate System
Conclusion
From now economists, academics and policy makers are available to have an alternative multi-dimensional graphical modeling to visualize a large number of variables, equations and functions join together into the same graphical space and study economics such as a whole, without any graphical limitation.
References
Dodge, C. (2004). Euclidean Geometry and Transformations. New York: Courier Dover Publications. PP. 304
Einstein, A. (1952). Relativity: The Special and the General Theory. New York: Three Rivers Press. PP. 188
JSTOR. Journal of Economics Section. http://www.elsevier.com (accessed 2009).
Lafleur, L. (1960). Discourse on Method, Optics, Geometry, and Meteorology (translation French to English from Rene Descartes -1637-). New York: The Liberal Arts Press.
Ruiz Estrada, M. A. (2007). “Econographicology”, International Journal of Economics Research (IJER), Volume No. 4/1.