http://dx.doi.org/10.4236/jbnb.2013.44A001
Cell Surface Determinants Important for Biofilm-Based
Solid Substrate Degradation
Jitka Dostálková1*, Vladimír Jirků1, Gita Procházková1, Lucie Křiklavová2, Tomáš Lederer2,
Tomáš Brányik1
1Institute of Chemical Technology in Prague, Prague, Czech Republic; 2Technical University of Liberec, Liberec, Czech Republic.
Email:*[email protected]
Received September 11th, 2013; revised October 25th, 2013; accepted November 26th, 2013
Copyright © 2013 Jitka Dostálková et al. This is an open access article distributed under the Creative Commons Attribution License, which permits unrestricted use, distribution, and reproduction in any medium, provided the original work is properly cited. In accor-dance of the Creative Commons Attribution License all Copyrights © 2013 are reserved for SCIRP and the owner of the intellectual property Jitka Dostálková et al. All Copyright © 2013 are guarded by law and by SCIRP as a guardian.
ABSTRACT
The study links targeted cell surface characterization to the quantified capacity of cellulose degrading Pseudomonas fluorescens cells to colonize a (similarly characterized) cellulosic carrier. The experiments were conducted to clarify the effect of cultivation conditions on the achieved state of this carrier colonization. The suggested approach seems to be sufficient to verify the right choice of cultivation medium as a major factor determining the binding complementarity between microbial cells and solid cellulose.
Keywords: Cellulose Biodegradation; Biofilm Formation; Microbial Cell Adhesion; Pseudomonas fluorescens
1. Introduction
Cellulosic wastes represent a solid, persistent substrate due to their cellulose component, which is of heteroge- neous structure and insoluble. Nevertheless, bacterial and fungal cellulases are capable of enzymatic hydrolysis resulting in simple saccharides that can be further proc- essed into useful products [1-3].
The R & D in the field of cellulose biodegradation aims now at the cellulose accessibility and the condi- tioning of continuous enzymatic action at the surface of this insoluble substrate; there is distinguished connection between cellulolytic cell-solid surface binding interaction and hydrolytic action of enzymes [1,4]. In other words, the fact that some cellulolytic microorganisms can form cellulolytic biofilms [5-7] may be very useful for techno- logical solubilization of some cellulosic wastes.
Pseudomonas sp. was described as producers of cellu- lolytic (endo-β-1,4-D-glucanases, exo-β-1,4-D-glucanase,
β-1,4-D-glucosidase and/or aryl-β-glucosidase II) and other enzymes participating on the lignocellulose hy- drolysis such as xylanase, cellodextrinase or arabinofu- ranosidase [8-10]. Unlike fungi (all components of the cellulase complex are released into the culture medium),
bacteria seem to release only endoglucanases to cultiva- tion media [8]. Capability of the strain Pseudomonas to colonize various substrata/surfaces was proved as well [11-16]; however, there is a lack of information known about cellulose colonization by P. fluorescens. Some studies on colonization of cellulosic substrates produced by rumen bacteria have been reported [17-20].
Nevertheless, the process of microbial cell adhesion followed by biofilm formation is very complex, having a profound physiological and physicochemical dependency [5,17,21-26]. In order to predict/control the formation of such cellulose-associated microbial communities, a veri- fied cell marker as well as a method evaluating the colo- nization of solid cellulose is needed. In this context, the present study links the induced changes in selected phys- icochemical properties (surface determinants) of the very outer surface of the cellulolytic bacteria Pseudomonas fluorescens with their capability to colonize a model cel- lulosic carrier (cellophane).
2. Materials and Methods
2.1. Bacterial Strain and Growth Conditions
Pseudomonas fluorescens,a verified cellulose degrader, was obtained from the collection of microorganisms of
the Department of Biotechnology (ITC Prague). Cultiva- tions were performed using a rotary shaker (100 rpm, 28˚C) and complex medium (further NB): 24 g·L−1 nu-
trient broth (Roth, Germany), pH 7.4, or alternatively minimum essential medium (further M5) (g·L−1 distilled
water): 0.17 KH2PO4, 0.13 K2HPO4, 0.71 (NH4)2SO4,
0.34 MgCl2·6 H2O, 0.000196 CaCl2, 0.0006 FeSO4·7
H2O, 0.001 MnCl2·4 H2O, 0.002 Na2MoO4·2H2O, pH 6.5,
or on the other hand, a rich bacterial medium (further M1) (g·L−1 50 mM phosphate buffer of pH 7): 5.0 yeast ex-
tract, 1.2 (NH4)SO4, 0.5 NaCl, 0.7 MgCl2. 6 H2O, 1.0
KH2PO4, 0.05 FeCl3. 6H2O, 0.1 CaCl2, supplemented
with 1% (w/v) carboxymethyl cellulose sodium salt (Sigma Aldrich, Czech Republic), omitted in the pres- ence of cellophane. Three types of cellophanes were used: C1—covered with nitrocellulose lacquer (Pemar Ltd, Czech Republic); C2—a common wrapping material with a hydrophobic surface (Pas Ltd, Czech Republic); C3—without surface adjustment (Innovia films, USA).
2.2. X-Ray Photoelectron Spectroscopy Analysis (XPS)
The pellets of washed cells were resuspended in 2 mL of cold demineralised water, deposited in a plastic flask and frozen immediately at −80˚C. The specimens were freeze-dried overnight at −55˚C (Heto Power Dry LL3000, Thermo Fisher Scientific, USA). Subsequently, the flasks were stoppered and stored at room temperature in a desiccator. The dehydrated cell powder was gently homogenized with a spatula and analyzed using X-ray photoelectron spectroscopy (ESCAProbeP, Omicron Na- notechnology GmbH, Germany). The cell wall composi- tion was calculated according to [27] and expressed as atomic surface concentration ratios related to total car- bon.
2.3. Contact Angle (CA)
Cell surfaces for measuring contact angles were prepared by collecting washed (0.85% w/v NaCl) cells on cellu- lose nitrate filter (pore size 0.4 µm, Pragopor, Prago- chema Ltd, Czech Republic). The microbial lawns ob- tained were then deposited on agar plates to stabilize moisture content, fixed to a glass slide and allowed to dry in air for 60 min. The CA was measured using the CAM 200 goniometer (KSV Instruments, Finland) according to [27]. Readings were performed for each liquid at equilib- rium stage, i.e. 1 second after the drop was placed on the studied surface [28]. Ten values of CA per sample were measured and results expressed as mean values (± stan- dard deviation). Cellophanes were cut into pieces (2.5 × 7.5 cm), boiled 20 min in distilled water and subjected to the same CA measurements.
2.4. Surface Tension/Total Free Energy
The total surface tension (TOT) of the tested solid sur-
faces and their components (LW, + and −) were calcu-
lated from CA by using Young’s equation [27]. The val- ues of total free energy of adhesion between solid sur- faces in water (ΔGTOT) were calculated using the ther-
modynamic approach [29].
2.5. Microbial Adhesion to Solvents (MATS)
The adhesion of bacterial cells to solvents was performed and calculated according to [30] using the following pairs of chemicals: chloroform (electron acceptor solvent) and hexadecane (nonpolar solvent), diethyl ether (strong electron donor solvent) and hexane (nonpolar solvent). The cell suspension (3 mL) was shaken for 1 min. with each solvent (0.5 mL), respectively, and left to stand (15 min). To express the cell surface properties, the percent- age of bound cells was calculated. All values are the mean of three independent determinations (± standard deviation).
2.6. Cell Adhesion Assay
The cells were harvested in the middle of exponential phase and in the early stationary phase (10 min, 4˚C, 10,000 g), resuspended in the M1/M5/NB medium and standardized to the optical density of 0.60 ± 0.01 (400 nm). Sterilized cellophane pieces (2 × 3 cm, 20 min boiled in distilled water) were under standard conditions immersed in the preformed cell suspension (6 mL). Ini- tial cell adhesion to substratum was allowed to occur for 1 h at 28˚C on a rotary shaker at 70 rpm. The cellophane pieces were gently transferred into 50 mL of sterile phosphate buffer pH 7 and shaken at 50 rpm for 1 min in order to remove any loosely attached cells. The cells ad- hered on the substratum were monitored using phase- contrast microscopy (Eclipse E400, NIKON). Ten im- ages per each substratum (at 40× objective) were cap- tured randomly (PowerShot A620, Canon) to obtain a representative area covered by cells. Each image was analyzed using the MATLAB 2012 software (The MathWorks, Inc., USA). In order to detect significant discrepancies among results obtained, statistical com- parisons were performed using Discriminant Analysis, K-means clustering and Principal Component Analysis (Microsoft Excel 2007, Microsoft, USA). Adhesion as- says were performed in triplicate. Furthermore, the ob- tained data were statistically analyzed with a one-way analysis of variance (ANOVA, MS Excel) and reported as p-values. Differences with p-values of less than 0.05 were considered statistically significant.
2.7. Biofilm Formation Assay
lapse phase-contrast microscopy (Eclipse E400, Nikon), using the FC 81 transmission flow cell (Biosurface Technologies Corporation, USA), inserted cellophane as a transparent carrier, and preformed cell suspension (see 2.6) recycling the cell at a flow rate of 5 mL·min−1. The
viewing window of the cell was divided into three sec- tions (inflow, middle, and outflow). Twenty cellophane surface images were randomly captured in the middle section (PowerShot A620, Canon; software Zoom- Browser EX 5.5) and analysed using the image analysis method according to [31].
2.8. Biofilm Structure
In order to extract/quantify structural features from im- ages of biofilms, the MATLAB 2012 software (The MathWorks, Inc., USA) was used for visual evaluation of areal parameters [30,32,33]. The parameters are briefly defined in the Results and discussion section; their de- tailed definitions and calculation procedures are reported by [31].
3. Results and Discussion
3.1. XPS Analysis of P. fluorescens Cells
The elemental composition of the bacterial surface that resulted from integrating C1s, O1s, N1s peaks from the survey scan spectrum and ratios of N/C, O/C, polysac- charides, proteins and hydrocarbon-like compounds are listed in Table 1.
Carbon is the most abundant surface element in the cells grown in all media and in the exponential and sta- tionary phase. The cell surface nitrogen was detected in the cells cultivated in all media as well. Induced changes in the level of proteins, polysaccharides and hydrocar- bon-like compounds are almost uniform and independent on the growth phase with exception medium M1. The data processed through quantitative methodology of Rouxhet et al. [34] show that the surface of the cells cul- tivated in various media contains 29 - 42 percent of pro- teins, 32 - 49 percent of polysaccharides and 12 - 43 percent of hydrocarbon-like compounds. The surface of
the cells exponentially growing in M1 medium contains more hydrocarbon-like compounds (e.g. lipids) than the cells in stationary phase. This result is in accordance with higher hydrophobicity of the exponentially growing cells.
There is no difference in the cell wall composition between the cells cultivated in NB in the exponential and stationary phase. High content of cell wall polysaccha- rides is probably related to the fact that P. fluorescens
produces a great amount of exopolysaccharides [35,36]. On the other hand, the results obtained are in contradic- tion with Noghabi et al. [37] who established that maxi- mum extracellular biopolymer production occurred in the early stationary growth phase.
3.2. Physicochemical Properties of Cell and Cellophane Surface
The impact of media and growth phase on the contact angle changes demonstrates that the lawns of cells grown in a complex (NB) medium show lower (for polar liquids —w, f) and similar (for nonpolar liquids—b) values as compared with cells grown on minimal and less richer M5 and M1 media (Table 2). The effect of the cell population’s growth phase on microbial surface proper- ties was in most cases (NB and M5) less apparent com- pared to the effect of culture media composition. The surface of cells grown in poorer media (M5 and M1) is apparently more hydrophobic than the surface of the cells grown in complex medium (NB) independently of the growth phase. Our results were in accordance with these reported by Jana et al. [38]. Their study demonstrates that hydrophobicity of P. fluorescens isolates is influ- enced by medium constituents and growth conditions which can strongly influence adhesion efficiency, e.g. early to mid-log exponential phase cells were more hy- drophobic than stationary phase cells.
Moreover, the cultivation in all three media brings a higher − value (as compared to +), what suggests an
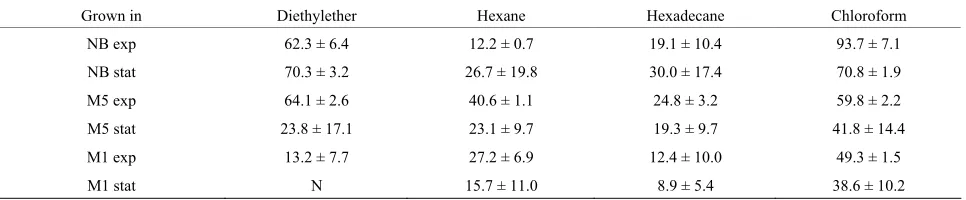
[image:3.595.57.540.610.715.2]electron-donating character of the cell surface. In the majority of media and growth phases tested, the adhesion of P. fluorescens cells to solvents (Table 3) was found to be higher to chloroform (electron acceptor) than to
Table 1. XPS atomic ratios for P. fluorescens cells.
grown in O/C N/C C-(C,H)/C C-(O,N)/C C=O/C (CPr/C) (CPs/C) (CHC/C)
NB exp 0.41 0.11 0.75 0.24 0.002 0.40 0.34 0.26
NB stat 0.40 0.12 0.80 0.20 0.002 0.42 0.32 0.26
M5 exp 0.34 0.10 0.45 0.12 0.01 0.35 0.27 0.39
M5 stat 0.33 0.08 0.40 0.11 0.01 0.29 0.28 0.43
M1 exp 0.50 0.09 0.41 0.14 0.01 0.30 0.49 0.21
M1 stat 0.52 0.12 0.41 0.14 0.01 0.42 0.46 0.12
Proteins (CPr/C), polysaccharides (CPs/C), hydrocarbon-like compounds (CHC/C), exp—exponential phase of cell population (exp), stationary phase of cell
Table 2. Surface properties of P. fluorescens cells collected on cellulose nitrate filter.
Contact Angle (˚) Surface Tension (mJ·m−2)
Grow in
w f b γLW γ+ γ− γAB γTOT
NB exp 17.3 ± 0.7 29.3 ± 1.4 52.9 ± 0.9 28.5 2.2 58.9 22.7 51.2
NB stat 23.7 ± 1.4 26.2 ± 0.8 64.2 ± 1.8 22.9 5.2 50.4 32.5 55.3 M5 exp 64.9 ± 3.0 65.6 ± 2.0 53.9 ± 1.1 28.0 0.0 29.4 0.5 28.6 M5 stat 56.2 ± 1.6 59.8 ± 1.1 59.8 ± 1.0 25.1 0.2 37.2 5.9 31.0 M1 exp 62.8 ± 1.8 63.8 ± 1.6 39.0 ± 2.2 35.1 0.3 31.5 6.6 41.6
M1 stat 33.0 ± 1.0 38.8 ± 1.2 36.6 ± 1.6 36.1 0.3 51.8 7.3 43.3
Table 3. Adhesion of P. fluorescens cells to solvents (%).
Grown in Diethylether Hexane Hexadecane Chloroform
NB exp 62.3 ± 6.4 12.2 ± 0.7 19.1 ± 10.4 93.7 ± 7.1
NB stat 70.3 ± 3.2 26.7 ± 19.8 30.0 ± 17.4 70.8 ± 1.9
M5 exp 64.1 ± 2.6 40.6 ± 1.1 24.8 ± 3.2 59.8 ± 2.2
M5 stat 23.8 ± 17.1 23.1 ± 9.7 19.3 ± 9.7 41.8 ± 14.4
M1 exp 13.2 ± 7.7 27.2 ± 6.9 12.4 ± 10.0 49.3 ± 1.5
M1 stat N 15.7 ± 11.0 8.9 ± 5.4 38.6 ± 10.2
diethylether (electron donor), what also supports above suggestion [26,30].
Similarly, a generally higher affinity of the cells grown in poorer media (M1 and M5) compared to complex me- dium (NB) to nonpolar solvents (hexane and hexadecane) shows that the difference between medium composition can result in a manifestation of those surface components that promote cell hydrophobicity. The contact angle val- ues for cellophane surfaces (Table4) revealed a signifi- cantly higher hydrophobicity of the C2 cellophane. In addition, the values of surface tensions (tot) and their
components show that the electron-donor capacity of the C2 cellophane is significantly weaker, as demonstrated by the lowest − value.
In the thermodynamic approach for predicting cell ad- hesion to solid substrates [39], the values of the total free energy of adhesion between the two studied solid sur- faces in water (ΔGTOT) prompt about the stability of the
surface interaction (energetically favorable when ΔGTOT
< 0, unfavorable when ΔGTOT > 0). A favorable (negative)
adhesion energy balance was detected for the adhesion of
P. fluorescens cells to cellophane C2, in the case of ex- ponential and stationary grown cells in M5 medium (−19.3 mJ/m2, resp. −10.2 mJ/m2) and in M1 medium
(−16.0 mJ/m2, resp. −0.9 mJ/m2). This favorable energy
balance was obtained mainly due to the negative balance of polar acid-base interactions (ΔGAB) between bacteria
and cellophane C2, which can be ascribed to the lowest electron donor (γ−) character of C2 (Table 4). Simulta-
neously, the calculations concerning the two remaining cellophanes (C1 and C3) resulted in energetically unfa- vorable balances (Table5).
3.3. Cell Adhesion and Biofilm Formation
From obtained results, there is an apparent influence of growth phase and medium composition effect on P. fluorescens cells. Comparing the total free adhesion en- ergies (Table5) with the results of the adhesion test onto C2 cellophane (Table6), some deviations between pre- diction and experiment was found in the case of the most extensively colonized cellophane C2 (see a less intensive adhesion of the cells grown in M5 medium). For the cell population being in stationary phase and NB medium, there is a significant discrepancy (higher cell adhesion whereas ΔGTOT is positive). In order to explain these dis-
agreements, further experimental results concerning the charges of the interacting surfaces would be necessary. The zeta potentials would allow using the classical col- loidal DLVO and extended XDLVO theories for the pre- diction of the cell adhesion [29]. In contrast to the ther- modynamic approach, they are either based on the elec- trostatic interactions (DLVO) or combine the non-cova- lent Liftshitz-van der Waals and electrostatic interactions with the Lewis acid-base interactions (XDLVO) [40]. However, it can be concluded that the thermodynamic approach was able to distinguish the general feature of the studied system, namely that the culture medium com- position and growth phase can significantly influence cell adhesion.
Subsequent experiments with biofilm formation on cellophane C2 surface were carried out in order to show in more details the medium effect/growth phase as well as possible different intensity of later biofilm detachment
[image:4.595.58.541.244.344.2]Table 4. Surface properties of cellophane.
Contact Angle (˚) Surface Tension (mJ·m−2)
Cellophane
w f b γLW γ+ γ− γAB γTOT
C1 44.1 ± 2.4 47.5 ± 2.2 46.4 ± 2.6 31.7 0.3 44.2 7.1 38.8 C2 88.2 ± 4.3 78.7 ± 2.4 50.9 ± 1.0 29.5 0.4 9.1 3.7 33.2 C3 36.9 ± 3.4 30.3 ± 5.2 35.2 ± 4.1 36.7 1.1 39.9 13.4 50.0
[image:5.595.57.539.237.363.2]w—water, f—formamide, b—1-bromonaphthalene.
Table 5. Free energy of interaction (ΔGTOT) and its components (ΔGLW, ΔGAB) between P. fluorescens cells and cellophanes
(C1, C2, C3) in water (cell-water-support) at the separation distance of 0.158 nm calculated according to the thermodynamic approach.
Free Energy of Interaction (mJ/m2)
C1 C2 C3
Grown in
ΔGLW ΔGAB ΔGTOT ΔGLW ΔGAB ΔGTOT ΔGLW ΔGAB ΔGTOT
NB exp −1.3 35.1 33.8 −1.1 10.2 9.1 −1.9 30.0 28.2
NB stac −0.2 27.3 27.1 −0.2 8.1 7.9 −0.3 23.4 23.1
M5 exp −1.2 19.3 18.1 −1.0 −18.3 −19.3 −1.7 15.6 13.9 M5 stac −0.7 24.1 23.4 −0.5 −9.6 −10.2 −0.9 20.0 19.0 M1 exp −2.4 19.4 17.0 −2.0 −14.0 −16.0 −3.5 15.8 12.4
M1 stac −2.6 33.9 31.3 −2.2 1.2 −0.9 −3.7 28.7 25.0
exp—exponential phase of cell population, stat—stationary phase of cell population, C1 - C3—cellophane type 1 - 3.
Table 6. Surface coverage (%) with P. fluorescens cells on C2 surface.
Medium-Growth Phase Colonized Surface (%)
NB-exp 0.70 ± 0.16
NB-stat 15.9 ± 0.57
M1-exp 11.3 ± 0.92
M1-stat 3.91 ± 0.21
M5-exp 0.42 ± 0.03
M5-stat 0.43 ± 0.02
exp—exponential phase of cell population, stat—stationary phase of cell population.
The cells grown in two completely different media (rich/poor, resp. NB and M5) were chosen for biofilm formation assay (Figures 1 and 2). The observed drop in the cellophane (C2) surface coverage can be explained by biofilm sloughing, i.e. a random biomass detachment attributed to nutrient/oxygen depletion deep within biofilms [41]. In the Figures 1 and 2, there is demon- strated a significant effect of chosen media and a differ- ence in the extent of colonization between both growth phases in dynamic conditions.
3.4. Biofilm Structure
The variability of biofilm structure was characterized by a change in these areal parameters: areal porosity (the ratio of void area to total area); diffusion distance (the
Figure 1. Time course of P. fluorescens biofilm formation on cellophane C2 surface (biofilm formation assay; medium: M5, NB)—exponential phase.
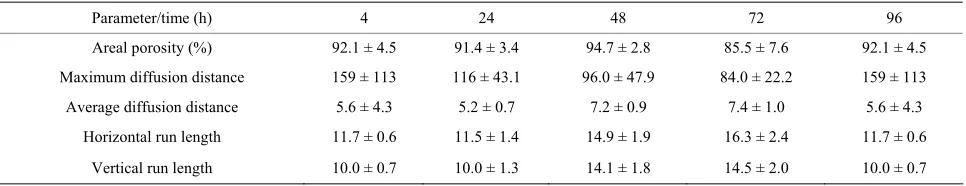
minimum distance from the cells in the cluster to intersti- tial space); run length (the vertical/horizontal dimension of a cell cluster) [31-33,42]. Results are summarized as the effect of media and growth phase on time course of changes in the values of the respective parameters, cal- culated from the images of the biofilm colonizing cello- phane C2, and except for areal porosity expressed as a number of pixels (Tables7-10).
[image:5.595.309.537.372.525.2] [image:5.595.55.286.415.518.2]higher coverage of the cellophane C2 surface. As shown in the Tables 7-10, the porosity of biofilms formed in NB and M5 medium decreased (after 3 days) to about 60 and 90 percent, what may be attributed to about 40 and 10 percent surface coverage, respectively. The sloughing of biofilm grown in almost all studied cases can be ob- served also on the increased areal porosity after 4 days (Tables 7-10). The NB medium (especially in exponen- tial growth phase) evidently supports a higher biofilm growth rate, i.e. the growth of respective, attached cell clusters. In this connection, the next parameters (aver- age/maximum diffusion distance) show the changes in their average and maximum diameters. The average dif- fusion distance reflects the average size of the cell clus- ters (in these biofilms almost round-shaped). As time progresses, the values of the average diffusion distance slightly oscillated, but not uniformly for both media/ growth phases. The cell cluster sizes differentiate be- cause old clusters grow larger and new ones arise. On the other hand, the maximum diffusion distance values of biofilms grown in NB and M5 increased with time and their maximum values were different. The growth of re-
[image:6.595.313.537.181.311.2]spective cell clusters in NB medium was significantly slower. Similarly to the values of average diffusion dis- tance parameter, the values of horizontal and vertical run-length also oscillate. In both media/growth phases horizontal run lengths reach higher values, suggesting that formed biofilms are oriented more horizontally (me- dium flow effect) [43].
[image:6.595.56.540.389.468.2]Figure 2. Time course of P. fluorescens biofilm formation on cellophane C2 surface (biofilm formation assay; medium: M5, NB)—stationary phase.
Table 7. Time course of changes in areal parameters for biofilms formed on cellophane C2 surface in medium NB- exponential phase.
Parameter/time (h) 4 24 48 72 96
Areal porosity (%) 90.2 ± 4.4 75.2 ± 11.6 63.2 ± 11.1 64.0 ± 10.2 90.2 ± 4.4 Maximum diffusion distance 175 ± 92.8 326 ± 138 454 ± 182 296 ± 121 175 ± 92.8 Average diffusion distance 10.1 ± 3.4 6.6 ± 1.8 5.2 ± 4.1 3.7 ± 0.8 10.1 ± 3.4
Horizontal run length 22.0 ± 7.0 15.5 ± 3.6 12.2 ± 6.7 11.1 ± 2.3 22.0 ± 7.0 Vertical run length 20.6 ± 6.9 13.4 ± 3.4 11.7 ± 9.8 9.4 ± 1.9 20.6 ± 6.9
± Standard deviations show biofilm heterogeneity.
Table 8. Time course of changes in areal parameters for biofilms formed on cellophane C2 surface in medium NB-stationary phase.
Parameter/time (h) 4 24 48 72 96
Areal porosity (%) 90.4 ± 8.2 85.4 ± 5.3 90.1 ± 3.4 74.4 ± 5.6 90.4 ± 8.2 Maximum diffusion distance 108 ± 35.5 219 ± 120 108 ± 47.6 281 ± 91.0 108 ± 35.5 Average diffusion distance 3.9 ± 0.6 9.1 ± 1.4 7.5 ± 2.2 7.9 ± 2.9 3.9 ± 0.6
Horizontal run length 10.0 ± 1.4 20.6 ± 2.5 16.9 ± 4.1 18.3 ± 5.1 10.0 ± 1.4 Vertical run length 8.5 ± 1.3 18.2 ± 2.5 15.2 ± 4.3 15.6 ± 4.9 8.5 ± 1.3
± Standard deviations show biofilm heterogeneity.
Table 9. Time course of changes in areal parameters for biofilms formed on cellophane C2 surface in medium BSM- exponential phase.
Parameter/time (h) 4 24 48 72 96
Areal porosity (%) 85.3 ± 4.5 95.2 ± 3.7 93.6 ± 3.5 91.9 ± 4.2 85.3 ± 4.5 Maximum diffusion distance 148 ± 88.6 64.5 ± 37.4 81.9 ± 21.0 95.3 ± 33.9 148 ± 88.6 Average diffusion distance 4.9 ± 0.6 4.1 ± 1.0 4.7 ± 0.6 4.5 ± 0.8 4.9 ± 0.6
Horizontal run length 11.7 ± 0.6 9.7 ± 2.1 10.6 ± 1.3 11.2 ± 1.7 11.7 ± 0.6 Vertical run length 9.4 ± 1.1 8.8 ± 2.1 9.2 ± 1.2 9.0 ± 1.9 9.4 ± 1.1
[image:6.595.63.540.514.596.2] [image:6.595.57.540.646.724.2]Table 10. Time course of changes in areal parameters for biofilms formed on cellophane C2 surface in medium BSM-stationary phase.
Parameter/time (h) 4 24 48 72 96
Areal porosity (%) 92.1 ± 4.5 91.4 ± 3.4 94.7 ± 2.8 85.5 ± 7.6 92.1 ± 4.5
Maximum diffusion distance 159 ± 113 116 ± 43.1 96.0 ± 47.9 84.0 ± 22.2 159 ± 113
Average diffusion distance 5.6 ± 4.3 5.2 ± 0.7 7.2 ± 0.9 7.4 ± 1.0 5.6 ± 4.3
Horizontal run length 11.7 ± 0.6 11.5 ± 1.4 14.9 ± 1.9 16.3 ± 2.4 11.7 ± 0.6
Vertical run length 10.0 ± 0.7 10.0 ± 1.3 14.1 ± 1.8 14.5 ± 2.0 10.0 ± 0.7
± Standard deviations show biofilm heterogeneity.
Nevertheless, comparing the changes in the value pro- file of those 4 areal parameters, we see again a stimulat- ing effect of NB medium. In a view of the findings that the production of both soluble and cell-associated cellu- lases is increased in response to low N availability, and N-limited biofilms bind strongly to cellulose surfaces [7,44], it should be pointed out that the NB medium, found as more stimulating, is a strong source of nitrogen.
However, we must realize that hydrodynamic effects and other factors affecting surface attached growth (a strong biofilm former is not always a strong biodegrader and contrariwise) can also play a crucial role in the for- mation and function of “our” biofilm. Moreover, cellu- lolytic microorganisms can establish synergistic rela- tionships with non-cellulolytic species in cellulosic wastes, particularly those generated at health care or food processing facilities. Therefore, the choice of medium based on above approach should serve only as a starting, but fundamental point of cell culture preparation, if a biofilm application is intended for the pretreatment/con- version of cellulosic materials.
4. Conclusion
Bacterial biofilm as a form of the multicellularity of sin- gle cell organisms is commonly referred to as the biofilm mode of growth, as opposed to the growth of free-float- ing cells in the culture medium (planktonic lifestyle). In this context, the biofilm of a cellulolytic microorganism, if applied as a living, multicellular biodegrader of cellu- losic materials, is expected to offer sustainability, self- repair, stable functional performance and multipoint ad- ministration of required degradative function. Neverthe- less, the conditions of intensive and reproducible biofilm formation must be always detected and secured. The de- scribed approach was found suitable to detect which me- dium stimulates reproducibly the enhancement of cell surface hydrophobicity, electron-donor capacity and fa- vorable (cell-carrier) adhesion energy, which are proper- ties always somehow determining the intensity of micro- bial colonization of a solid cellulose. The same approach enables us to characterize the surface of this carrier, and confront the complementarity of cell/carrier surfaces
through cell adhesion and biofilm structure assays.
5. Acknowledgements
The authors acknowledge the financial support of MEYS, Czech Republic, through the projects: Eureka E!3654- Euroenviron Biopols, and the Project OP VaVpI Centre for Nanomaterials, Advanced Technologies and Innova-tion CZ.1.05/2.1.00/01.0005, as well as of the Grant Agency of the Czech Republic (project GACR P503/ 12/1424).
REFERENCES
[1] L. R. Lynd, P. J. Weimer, W. H. Zyl and I. S. Pretorius, “Microbial Cellulose Utilization: Fundamentals and Bio- technology,” Microbiology and Molecular Biology Re- views, Vol. 66, No. 3, 2002, pp. 506-577.
http://dx.doi.org/10.1128/MMBR.66.4.739.2002 http://dx.doi.org/10.1128/MMBR.66.3.506-577.2002 [2] M. Wenzel, I. Schonig, M. Berchtold, P. Kampfer and H.
Konig, “Aerobic and Facultatively Anaerobic Cellulolytic Bacteria form the Gut of the Termite Zootermopsis an- gusticollis,” Journal of Applied Microbiology, Vol. 92, No. 1, 2002, pp. 32-40.
http://dx.doi.org/10.1046/j.1365-2672.2002.01502.x [3] Z. Shi, G. Luo and G. Wang, “Cellulomonas carbonis sp.
nov., Isolated from Coal Mine Soil,” International Jour- nal of Systematic and Evolutionary Microbiology, Vol. 62, No. P8, 2012, pp. 2004-2010.
http://dx.doi.org/10.1099/ijs.0.034934-0
[4] W. Schwarz, “The Cellulosome and Cellulose Degrada- tion by Anaerobic Bacteria,” Applied Microbiology and Biotechnology, Vol. 56, No. 5-6, 2001, pp. 634-649. http://dx.doi.org/10.1007/s002530100710
[5] A. N. Alonso, P. J. Pomposiello and S. B. Leschine. “Biofilm Formation in the Life Cycle of the Cellulolytic Actinomycete Thermobifida fusca,” Biofilms, 2008, pp. 1-11. http://dx.doi.org/10.1017/S1479050508002238 [6] Z. Wang and S. Chen, “Potential of Biofilm-Based Bio-
fuel Production,” Applied Microbiology and Biotechnol- ogy, Vol. 83, No. 1, 2009, pp. 1-18.
http://dx.doi.org/10.1007/s00253-009-1940-9
Response to Nitrogen Availability,” Environmental Mi- crobiology, Vol. 14, No. 3, 2012, pp. 594-604.
http://dx.doi.org/10.1111/j.1462-2920.2011.02596.x [8] K. Ramasamy and H. Verachtert, “Localization of Cellu-
lase Components in Pseudomonas sp. Isolated from Ac- tivated Sludge,” Microbiology, Vol. 117, No. 1, 1980, pp. 181-191. http://dx.doi.org/10.1099/00221287-117-1-181 [9] M. A. Luis, L. M. A. Ferreira, T. M. Wood, G. William-
son, C. Faulds, G. P. Hazlewood, G. W. Black and H. J. Gilbert, “A Modular Esterase from Pseudomonas fluo- rescens subsp. cellulosa Contains a Non-Catalytic Cellu- lose-Binding Domain,” The Biochemical Journal, Vol. 294, Pt. 2, 1993, pp. 349-355.
[10] C. L. Cheng and J. S. Chang, “Hydrolysis of Lignocellu- losic Feedstock by Novel Cellulases Originating from Pseudomonas sp. CL3 for Fermentative Hydrogen Pro- duction,” Bioresource Technology, Vol. 102, No. 18, 2011, pp. 8628-8634.
http://dx.doi.org/10.1016/j.biortech.2011.03.053
[11] M. Fletcher, “Attachment of Pseudomonas fluorescens to Glass and Influence of Electrolytes on Bacterium-Sub- stratum Separation Distances,” Journal of Bacteriology, Vol. 170, No. 5, 1988, pp. 2027-2030.
[12] B. Song and L. G. Leff, “Influence of Magnesium Ions on Biofilm Formation by Pseudomonas fluorescens,” Micro- biological Research, Vol. 161, No. 4, 2006, pp. 355-361. http://dx.doi.org/10.1016/j.micres.2006.01.004
[13] J. Kives, B. Orgaz and C. SanJosé, “Polysaccharide Dif- ferences between Planktonic and Biofilm-Associated EPS from Pseudomonas fluorescens B52,” Colloids and Sur- faces B: Biointerfaces, Vol. 52, No. 2, 2006, pp. 123-127. http://dx.doi.org/10.1016/j.colsurfb.2006.04.018
[14] D. Nercessian, F. B. Duville, M. Desimone, S. Simison and J. B. Busalmen, “Metabolic Turnover and Catalase Activity of Biofilms of Pseudomonas fluorescens (ATCC 17552) as Related to Copper Corrosion,” Water Research, Vol. 44, No. 8, 2010, pp. 2592-2600.
http://dx.doi.org/10.1016/j.watres.2010.01.014
[15] I. E. Ivanov, C. D. Boyd, P. D. Newell, M. E. Schwartz, L. Turnbull, M. S. Johnson, C. B. Whitchurch, G. A. O’Toole and T. A. Camesano, “Atomic Force and Super-Resolution Microscopy Support a Role for LapA as a Cell-Surface Biofilm Adhesin of Pseudomonas fluorescens,” Research in Microbiology, Vol. 163, No. 9-10, 2012, pp. 685-691. http://dx.doi.org/10.1016/j.resmic.2012.10.001
[16] R. Djeribi, W. Bouchloukh, T. Jouenne and B. Menaa, “Characterization of Bacterial Biofilms Formed on Uri- nary Catheters,” American Journal of Infection Control, Vol. 40, No. 9, 2012, pp. 854-959.
http://dx.doi.org/10.1016/j.ajic.2011.10.009
[17] C. O’Sullivan, P. C. Burrell, M. Pasmore, W. P. Clarke and L. L. Blackall, “Application of Flowcell Technology for Monitoring Biofilm Development and Cellulose Deg- radation in Leachate and Rumen Systems,” Bioresource Technology, Vol. 100, No. 1, 2009, pp. 492-496. http://dx.doi.org/10.1016/j.biortech.2008.06.028
[18] A. Dumitrache, G. Wolfaardt, G. Allen, S. N. Liss and L. R. Lynd, “Form and Function of Clostridium thermocel- lum Biofilms,” Applied and Environmental Microbiology,
Vol. 79, No. 1, 2013, pp. 231-239. http://dx.doi.org/10.1128/AEM.02563-12
[19] Z. W. Wang, S. H. Lee, J. Elkins and J. Morrell-Falvey, “Spatial and Temporal Dynamics of Cellulose Degrada- tion and Biofilm Formation by Caldicellulosiruptor ob- sidiansis and Clostridium thermocellum,” AMB Express, Vol. 1, No. 1, 2011, p. 30.
http://dx.doi.org/10.1186/2191-0855-1-30
[20] Z. W. Wang, S. H. Lee, J. G. Elkins, Y. Li, S. Hamilton- Brehm and J. L. Morrell-Falvey, “Continuous Live Cell Imaging of Cellulose Attachment by Microbes under An- aerobic and Thermophilic Conditions Using Confocal Microscopy,” Journal of Environmental Sciences, Vol. 25, No. 5, 2013, pp. 849-856.
http://dx.doi.org/10.1016/S1001-0742(12)60104-1 [21] D. Cunliffe, C. Smart, C. Alexander and E. Vulfson,
“Bacterial Adhesion at Synthetic Surfaces,” Applied En- vironment Microbiology, Vol. 65, No. 11, 1999, pp. 4995- 5002.
[22] N. Mohamed, M. Teeters, J. Patti, M. Hook and J. Ross, “Inhibition of Staphylococcus aureus Adherence to Col- lagen under Dynamic Conditions,” Infection and Immu- nity, Vol. 67, No. 2, 1999, pp. 589-594.
[23] G. Bruinsma, H. C. van der Mei and H. J. Bussher, “Bac- terial Adhesion to Surface Hydrophilic and Hydrophobic Contact Lenses,” Biomaterials, Vol. 22, No. 24, 2001, pp. 3217-3224.
http://dx.doi.org/10.1016/S0142-9612(01)00159-4 [24] W. Dunne, “Bacterial Adhesion: Seen Any Good Bio-
films Lately?” Clinical Microbiology Reviews, Vol. 15, No. 2, 2003, pp. 155-166.
http://dx.doi.org/10.1128/CMR.15.2.155-166.2002 [25] N. Cerca, G. B. Pier, M. Vilanova, R. Oliveira and J.
Azeredo, “Quantitative Analysis of Adhesion and Biofilm Formation on Hydrophilic and Hydrophobic Surfaces of Clinical Isolates of Staphylococcus epidermidis,” Re- search in Microbiology, Vol. 156, No. 4, 2005, pp. 506- 514. http://dx.doi.org/10.1016/j.resmic.2005.01.007 [26] F. Hamadi and H. Latrache, “Comparison of Contact
Angle Measurement and Microbial Adhesion to Solvents for Assaying Electron Donor-Electron Acceptor (Acid- Base) Properties of Bacterial Surface,” Colloids and Sur- faces B: Biointerfaces, Vol. 65, No. 1, 2008, pp. 134-139. http://dx.doi.org/10.1016/j.colsurfb.2008.03.010
[27] M. Kurec and T. Brányik, “The Role of Physicochemical Interactions and FLO Genes Expression in the Immobili- zation of Industrially Important Yeasts by Adhesion,” Colloids and Surfaces B: Biointerfaces, Vol. 84, No. 2, 2011, pp. 491-497.
http://dx.doi.org/10.1016/j.colsurfb.2011.02.004
[28] P. K. Sharma and H. K. Rao, “Analysis of Different Ap- proaches for Evaluation of Surface Energy of Microbial Cells by Contact Angle Goniometry,” Advances in Col- loid and Interface Science, Vol. 98, No. 3, 2002, pp. 341- 463. http://dx.doi.org/10.1016/S0001-8686(02)00004-0 [29] C. J. Oss, “Hydrophobicity of Biosurfaces—Origin, Quan-
[30] M. N. Bellon-Fontaine, J. Rault and C. J. van Oss, “Mi- crobial Adhesion to Solvents: A Novel Method to Deter- mine the Electron-Donor/Electron-Acceptor or Lewis Acid-Base Properties of Microbial Cells,” Colloids and Surfaces B: Biointerfaces, Vol. 7, No. 1-2, 1996, pp. 47- 53. http://dx.doi.org/10.1016/0927-7765(96)01272-6 [31] X. Yang, H. Beyenal, G. Harkin and Z. Lewandowski,
“Quantifying Biofilm Structure Using Image Analysis,” Journal of Microbiological Methods, Vol. 39, No. 2, 2000, pp. 109-119.
http://dx.doi.org/10.1016/S0167-7012(99)00097-4 [32] H. Beyenal, C. Donovan, Z. Lewandowski and G. Harkin,
“Three-Dimensional Biofilm Structure Quantification,” Journal of Microbiological Methods, Vol. 59, No. 3, 2004, pp. 395-413.
http://dx.doi.org/10.1016/j.mimet.2004.08.003
[33] Z. Lewandowski and H. Beyenal, “Fundamentals of Bio- film Research,” CRC Press, Boca Raton, 2007.
[34] P. G. Rouxhet, N. Mozes, P. B. Dengis, Y. F. Dufrêne, P. A. Gerin and M. J. Genet, “Application of X-Ray Photo- electron Spectroscopy to Microorganisms,” Colloids and Surfaces B: Biointerfaces, Vol. 2, No. 1-3, 1994, pp. 347- 369. http://dx.doi.org/10.1016/0927-7765(94)80049-9 [35] S. F. Osman, W. F. Fett, P. Irwin, P. Cescutti, J. N.
Brouillette and J. V. O’Connor, “The Structure of the Exopolysaccharide of Pseudomonas fluorescens Strain H13,” Carbohydrate Research, Vol. 300, No. 4, 1997, pp. 323-327.
http://dx.doi.org/10.1016/S0008-6215(97)00069-4 [36] C. C. Hung, P. H. Santschi and J. B. Gillow, “Isolation
and Characterization of Extracellular Polysaccharides Produced by Pseudomonas fluorescens Biovar II,” Car- bohydrate Polymers, Vol. 61, No. 2, 2005, pp. 141-147. http://dx.doi.org/10.1016/j.carbpol.2005.04.008
[37] K. A. Noghabi, H. S. Zahiri and S. C. Yoon, “The Pro- duction of a Cold-Induced Extracellular Biopolymer by Pseudomonas fluorescens BM07 under Various Growth Conditions and Its Role in Heavy Metals Absorption,” Process Biochemistry, Vol. 42, No. 5, 2007, pp. 847-855.
http://dx.doi.org/10.1016/j.procbio.2007.02.004
[38] T. K. Jana, A. K. Srivastava, K. Csery and D. K. Arora, “Influence of Growth and Environmental Conditions on Cell Surface Hydrophobicity of Pseudomonas fluorescens in Non-Specific Adhesion,” Canadian Journal of Micro- biology, Vol. 46, No. 1, 2000, pp. 28-37.
http://dx.doi.org/10.1139/w99-104
[39] R. Bos, H. C. van der Mei and H. J. Busscher, “Physico- Chemistry of Initial Microbial Adhesive Interactions—Its Mechanisms and Methods for Study,” FEMS Microbiol- ogy Reviews, Vol. 23, No. 2, 1999, pp. 179-230. http://dx.doi.org/10.1111/j.1574-6976.1999.tb00396.x [40] C. J. Oss, “Long-Range and Short-Range Mechanisms of
Hydrophobic Attraction and Hydrophilic Repulsion in Specific and Aspecific Interactions,” Journal of Molecu- lar Recognition, Vol. 16, No. 4, 2003, pp. 177-190. http://dx.doi.org/10.1002/jmr.618
[41] M. C. M. Loosdrecht, J. J. Heijnen, H. Eberl, J. Kreft and C. Picioreanu, “Mathematical Modelling of Biofilm Struc- tures,” Antonie van Leeuwenhoek, Vol. 81, No. 1-4, 2002, pp. 245-256. http://dx.doi.org/10.1023/A:1020527020464 [42] G. Jackson, H. Beyenal, W. M. Rees and Z. Lewand-
owski, “Growing Reproducible Biofilms with Respect to Structure and Viable Cell Counts,” Journal of Microbi- ological Methods, Vol. 47, No. 1, 2001, pp. 1-10. http://dx.doi.org/10.1016/S0167-7012(01)00280-9 [43] Y. Liu and J.-H. Tay, “The Essential Role of Hydrody-
namic Shear Force in the Formation of Biofilm and Granular Sludge,” Journal of Microbiological Methods, Vol. 36, No. 7, 2002, pp. 1653-1665.
http://dx.doi.org/10.1016/S0043-1354(01)00379-7 [44] Y. Lu, Y. H. Zhang and L. R. Lynd, “Enzyme-Microbe
Synergy during Cellulose Hydrolysis by Clostridium thermocellum,” Proceedings of the National Academy of Sciences of the United States of America, Vol. 103, No. 44, 2006, pp. 16165-16169.