Simulation Study of Three Types of Distributed Power
Based on EMTDC
Peng-tao Mu, Dong-mei Zhao
School of Electrical and Electronic Engineering, North China Electric Power University, Beijing, China Email: [email protected]
Received March, 2013
ABSTRACT
In order to analyze the performances of directly-driven permanent magnet synchronous generator wind turbine (PMSG) connecting to the grid, photovoltaic array and microtubine, dynamic models of them are established. The validity of the established models and proposed control strategies are demonstrated by simulation system under the software package PSCAD/EMTDC.
Keywords: Wind Power; Photovoltaic; Microtubine; Simulation; PSCAD/EMTDC
1. Introduction
Distributed generation refers to making use of a variety of decentralized energy, including renewable energy and the local fossil fuel which is easy to get to generate pow-er. Flexible, economic, and environmental protection are the main advantages of distributed generation. But at the same time some of the renewable energy have inter- mit-tent and randomness characteristics, this power has some difficulties to regulate itself alone to meet the load, usu-ally need other power to coordinate [1]. Currently, more mature distributed generation technologies have several forms, such as photovoltaic power, wind power, gas tur-bine power.
Grid connection of the distributed power has presented new challenges to the safe operation of the power system. The diversity of distributed power increases the difficulty to connect the grid. Grid-connected distributed power easily affect the quality of the surrounding electricity users, it is difficult to achieve energy optimization.
About wind power generation system, synchronous wind turbines which is connected to the grid by uncon- trollable rectifier and controllable grid-connected inverter is studied in the literature [2]. A method to decouple the power of D-PMSG (directly driven wind turbine with permanent magnet synchronous generators) which is connected to the grid by uncontrollable rectifier and con- trollable inverter is reported in literature [3]. A complete model of the PMSG is given in literature [4]. About photovoltaic power generation system, a photovoltaic
cell model with a friendly interface is developed using Matlab/Simulink simulation software in literature [5]. A simple photovoltaic generation systems is established using PSCAD/EMTDC electromagnetic transient simula-tion software in literature [6]. About micro turbine gen-eration system, a single cycle mathematical model for dynamic simulation of microturbine is established on the basis of the analysis of single cycle overloaded microtur-bine in the literature [7].
2. Model Research of Wind Power
Generation System
2.1. Structure of Wind Power Generation System
A complete distributed generation system is mainly composed of distributed power, power electronic converter, the various controllers as well as the power grid or load. These components require modeling and solving in the electrical and control system.
The modeling of doubly fed induction wind generator has been a lot of research at home and abroad, relatively modeling of directly driven wind turbine with permanent magnet synchronous generator is less. A permanent magnet synchronous generator is used in this article. The overall structure of the wind generation system is shown
in Figure 2-1. Many articles have the detailed introduction
about the wind turbine and grid-connected converter, so these parts are ignored.
2.2. Modeling of Directly—Driven Permanent Magnet Synchronous Generator
*The National High Technology Research and Development of China
has more pole pairs, so the generator can still work in low rotor speed, thus permanent magnet synchronous generator can directly couple to the wind turbine, eliminating the need for a gear box. A mathematical model of permanent magnet synchronous generator is established in d-q synchronous rotating coordinate system:
3
[ ( ) ]
2
d
d s d q q d
q
q s q d d f q
e q d d q f
di
u R i wL i L
dt di
u R i wL i w L
dt
T pi i L L
(1)
d is the d-axis voltage of generator unit stator; q
is the q-axis voltage of generator unit stator; d is the
d-axis current of generator unit stator; q is the q-axis
current of generator unit stator; d is the d-axis
equivalent inductance of generator unit stator; q is the
q-axis equivalent inductance of generator unit stator;
u u i L i L s R
is stator armature winding resistance; f is the per-
manent magnet flux of rotor; e is the electromagnetic
torque; w is the frequency of the stator electrical angle; p is the number of pole pairs.
T
2.3. Control Strategy of Grid-Connected Inverter
The main role of the grid-connected inverter is to maintain voltage of dc side constant, and to control the reactive power exchange between the wind driven generator and the grid according to need of the grid[8]. Shown in Figure 2-2.
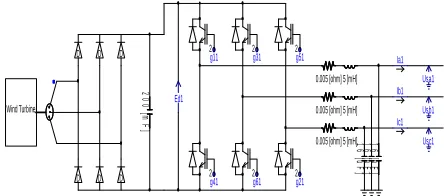
Wind Turbine D D D D D D 20 0 [ m F ] g41 g11 g31 g61 g51 g21 2 2 2 2 2 2 5 [mH] 0.005 [ohm] 5 [mH] 0.005 [ohm] 5 [mH] 0.005 [ohm] 16
[image:2.595.60.282.479.577.2][ uF ] 16 [ uF ] 16 [ uF ] Usa1 Usb1 Usc1 Ia1 Ib1 Ic1 Ed1
[image:2.595.308.539.602.712.2]Figure 2-1. The overall structure of the wind power generation system. D + F -D + F -I P Id1 Iq1 I P B + D + F + B -D + F + Ud1 Uq1 * 0.1885 * 0.1885 Usq1 I P D+ F -I P s 1.2 Ed1 Sign1 0.0 Usd1
Figure 2-2. The control of grid-connected inverter.
Active and reactive power output of the grid- connected inverter:
1 1 1 1
1 1 1 1
d d q q
q d d q
P u i u i
Q u i u i
1
1
(2)
The grid voltage space vector is put on d-axis on the d-q coordinate system, so 、 1 .We can get that 1 d1d1
1
d g
u u uq 0
P u i 、 Q1 u id1d1
1 q i
, apparently, you can achieve decoupling control of active and reactive power through the control of id1 and .
3. Simulation Model of Photovoltaic
Generation System
Grid-connected PV system is made up of the PV array, DC / DC converter, inverter and other components, and the most important components are the PV array and inverter. The photovoltaic generation system is shown in
Figure 3-1.
4. Simulation Model of Microtubine
Microturbine generation system [9] is mainly composed of the microturbine of high-speed rotation and permanent magnet synchronous generator. microturbine is made up of micro-turbine compressor, combustor, gas turbine. The mixture of the pressurized air by the compressor and fuel flame in the combustion chamber, and the high temperature gas expands in the gas turbine to generate power, which eventually converted to mechanical energy. A part of the mechanical energy drive compressor work, the other part is provided to the generator. The velocity, temperature, and fuel control the air quantity which is sent into the combustor to limit the upper temperature of the combustion chamber in order to obtain maximum operating efficiency in a safe and reliable state in the energy conversion process .The microturbine model is shown in Figure 4-1.
5. Simulation
5.1. Wind Generation System
Wind power generation and transmission system which is
gt1 gt2 gt3 gt4 gt5 gt6 1 Ea Ec Eb Idc 3 5
2 6 4
1 3 5
2 6 4
Ia_motor dcVltg 8 0000 5 1 0000 5 T1 Vpv Icon 0.01 [H] Ipv D + G T
[image:2.595.59.285.619.719.2]D+ F
-I P
D -F
+ 950.0
G 1 + sT G
1 + sT1 1 + sT2
Min C
D *
* 0.77
D+ F + 0.23
G 1 + sT
G 1 + sT e-sT
e-sT
G 1 + sT
1 sT +D
F
-Te Wf
* -1.0 G1 + sT11 + sT2
Te2 Te2
Tm B
-D+
F + 0.201
*
1.
3
* 1.3
w w
* 700.0
B -D+
F + 935.0
*
55
.0
[image:3.595.59.286.82.257.2]w 1.0
Figure 4-1 The structure of the photovoltaic generation
own in Figure 2-1 is set up in the PSCAD / EMTDC
ample, the start average wind sp
system.
sh
simulation platform to simulate the changes of power and voltage under the gust. The wind turbine in the system is a directly driven wind turbine with permanent magnet synchronous generator.
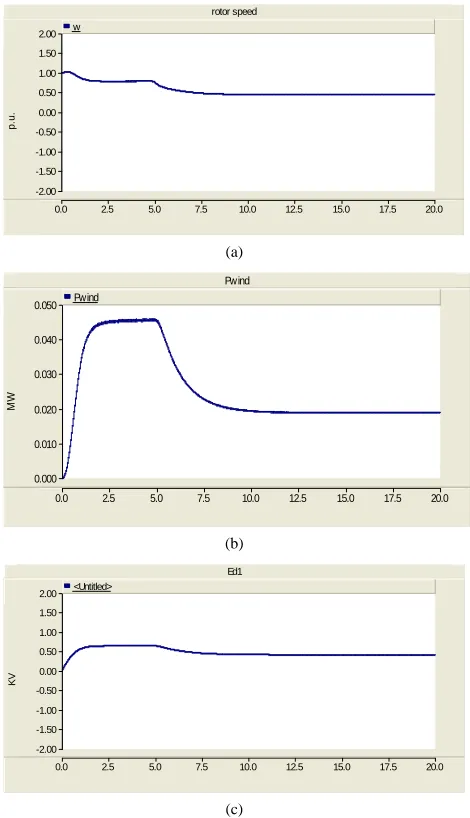
In the simulation ex
eed to is 4m / s, after 5 seconds, the speed reduces to 1.98 m / s. The total simulation time is 20s, and the solution time step is 50s. The simulation results are shown in Figure 5-1, Fig e 5-1(a) shows the generator speed can quickly follow the changes of the wind turbine.
Figure 5-1(b) shows the active power generator issue
can quickly follow the variation of the wind turbine. we can see that the capacitor voltage of DC side fluctuates because of changes in the system transmit power from
Figure 5-1 (c). We can get the following conclusions,
this wind power system can operate stable under different wind conditions. The grid converter of this system uses PI controllers, which does not require complex mathe- matical algorithms. The control method is simple and the dynamic performance of control system is good.
ur
5.2. Photovoltaic Generation System
is based on As shown in Figure 3-1, the system
photovoltaic arrays for power, and the power flow to the DC load through buck circuit. The MPPT module real- time calculates and output voltage of the maximum power. The voltage is compared with the capacitor voltage of DC side to generate a PWM control signal. The signal adjusts the output voltage of the PV array to make the PV array work in the maximum power point voltage, so the PV array output power reaches the maximum. Using incremental conductance method in MPPT, incremental conductance method achieves maximum power tracking through instantaneous conductance and conductance change.
rotor speed
0.0 2.5 5.0 7.5 10.0 12.5 15.0 17.5 20.0 -2.00
-1.50 -1.00 -0.50 0.00 0.50 1.00 1.50 2.00 w
p.
u.
(a)
Pwind
0.0 2.5 5.0 7.5 10.0 12.5 15.0 17.5 20.0 0.000
0.010 0.020 0.030 0.040 0.050 Pwind
MW
(b)
Ed1
0.0 2.5 5.0 7.5 10.0 12.5 15.0 17.5 20.0 -2.00
-1.50 -1.00 -0.50 0.00 0.50 1.00 1.50 2.00 <Untitled>
KV
[image:3.595.306.541.83.492.2](c)
Figure 5-1. (a) Generator sp (b) Generator active power;
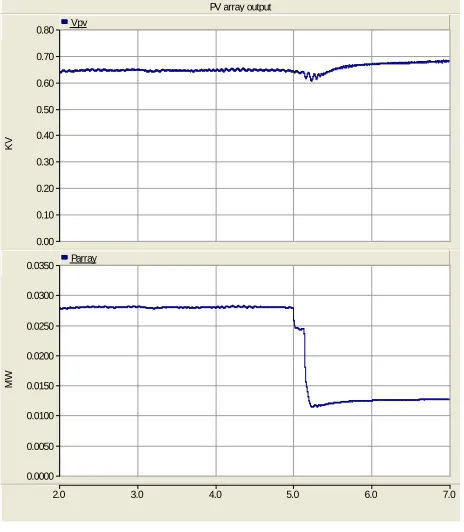
In the simulation example, the first light intensity of 10
eed; (c) capacitor voltage of DC side.
00w m/ 2
, after 5 seconds, the light intensity reduced to 460 2
, the total simulation time is 7s, the solution time step is 50
/
w m s
.
From the Figu 5-2re , the system will soon enter the steady state; this is because the photovoltaic array module does not contain the dynamic links, when the changes of the light intensity, the system can well adjust the active power and the photovoltaic outlet voltage. Because of MPPT control, the output voltage remains near the maximum power point. When the light intensity drops from 1,000 w m/ 2
to 460w m/ 2
, the output voltage of the PV array decreases a eginning and then increases, but the size is almost no change, This is the PV characteristics curve with the light intensity changes and changes in the law exactly. The change rule
of Figure5-2 is exactly similar to the rule of P-V
characteristics curve of the light intensity changing.
5.3. Microturbine Generation System
[image:4.595.57.289.223.489.2]shown in Microturbine generation system which is
Figure 5-3 is set up in the PSCAD / EMTDC simulation
platform to simulate the operating characteristics of the microturbine. Microturbine provides power to the load of 40 kw. The total simulation time is 20 s, and the solution time step is 50s. Power characteristic of microturbine is shown in Figure 5-4.
PV array output
2.0 3.0 4.0 5.0 6.0 7.0
0.00 0.10 0.20 0.30 0.40 0.50 0.60 0.70 0.80
KV
Vpv
0.0000 0.0050 0.0100 0.0150 0.0200 0.0250 0.0300 0.0350
MW
Parray
Figure 5-2. PV array output voltage, PV array output power.
AC DC
AC DC V
A PMSG
Turbine fuel
Microturbine Generation System
Figure 5-3. microturbine power generation system structure.
microturbine 1 : Graphs
0.0 1.0 2.0 3.0 4.0 5.0
0.000 0.010 0.020 0.030 0.040 0.050 0.060 0.070
MW
[image:4.595.58.552.353.736.2]Pout
Figure 5-4. active power of microturbine.
6. Con
model of directly driven wind turbine agnet synchronous generator is
are also re
mover system, high-speed permanent m
ERENCES
[1] P. Li, “Resear ulation
Methodol-ogy of Micro ibuted Energy
Re-iable
Directly Driven
Wind Turbine with
ulink,”
rray and MPPT Controller,”
s Turbines,” Journal of Engineering for
clusions
The grid-connected with permanent m
established based on PSCAD/EMTDC simulation platform. The model achieves maximum wind energy capture and the dynamic performance is good.
Characteristics of the PV array are related to the parameters of photovoltaic cell module, and
lated to the intensity of solar radiation and ambient temperature, thus the PV array is actually a highly nonlinear power with multiple parameters. A mathematical model based on the physics of the photovoltaic cell is build in PSCAD, and the result of simulation shows that the above model can dynamically track changes of the intensity of solar radiation and other parameters.
Microturbine power generation system consists of microturbine
agnet synchronous generator and power electronic converter. This article briefly describes the microturbine mover system. Simulation results show that the structure of the system is able to simulate the steady-state process of the microturbine. The model can be used as the basis of the following study.
REF
ch on the Transient Sim -grid Powered by Distr
sources,” Ph.D. Thesis, Tianjin University, 2010. [2] S. K. Kim, E. S. Kim and J. Y. Yoon, “PSCAD/EMTDC
Based Dynamic Modeling and Analysis of a Var Speed Wind Turbine,” IEEE Power Engineering Society General Meeting, USA, Denver, 2004.
[3] D. Wu and J. W. Zhang, “Control System of Vari-Able-speed Permanent-magnet Generator
by Wind Turbine,” Large Electric Machine and Hydrau-lic Turbine, No. 6, 2006, pp. 51-55.
[4] M. Yin, G. Y. Li and J. C. Zhang, et al., “Modeling and Control Strategies of Directly Driven
Permanent Magnet Synchronous Generator,” Power Sys-tem Technology, Vol. 31, No.15, 2007, pp. 62-65.
[5] H. L. Tsai, C. S. Tu and Y. J. Su, “Development of Gen-eralized Photovoltaic Model Using Matlab/Sim Proceedings of the World Congress on Engineering and Computer Science, 2008.
[6] Z. Y. Sun, H. Yu and G. G. Yan, “PSCAD Simulation Models for Photovoltaic A
Power System Protection and Control, Vol. 37, No.19, 2009, pp. 61-64.
[7] W. I. Rowen, “Simplified Mathematical Representations of Heavy Duty Ga
Power, Vol. 105, No.4, 1983, pp. 865-869.
doi:10.1115/1.3227494
riven Wind Turbine with Perma-Strategies of Directly D
nent Magnet Synchronous Generator,” Power System Protection and Control, Vol. 39, No.7, 2011, pp. 68-73.