http://dx.doi.org/10.4236/cs.2016.74042
Universal Band Pass Sampling Algorithm
for Integration of Multiple Wireless
Technologies Using Software Defined
Radio Platform
Sriramachandra Murthy Budaraju, Bhagyaveni Marcharla Anjaneyulu
Department of Electronics and Communication Engineering, College of Engineering-Guindy, Anna University, Chennai, India
Received 12 March 2016; accepted 26 April 2016; published 29 April 2016
Copyright © 2016 by authors and Scientific Research Publishing Inc.
This work is licensed under the Creative Commons Attribution International License (CC BY).
http://creativecommons.org/licenses/by/4.0/
Abstract
Software Defined Radio (SDR) architecture allows us to integrate different mobile technologies using common hardware but with different software modules. To achieve this, we need to keep the signal in digital form for as much portion of the circuitry as possible, so that the implementation could be carried out by programmable digital processors. For this purpose, the incoming radio frequency (RF) signal is down converted to baseband spectrum using band pass sampling method. Research works carried out so far in this field have developed a few algorithms for band pass sampling. But, these algorithms are not much useful for most of the mobile communication sys-tems and they use complex methodology for computing the sampling frequency values. In order to use the SDR platform to integrate all current wireless technologies, an efficient, cost effective and less complex algorithm that can be labelled as universal band pass sampling algorithm is devel-oped in this paper for multiple mobile systems. This algorithm is based on a novel idea of inserting guard bands between the signals which reduces the design complexities of perfect ADC and sharp cut off filters. Using this algorithm, valid sampling frequency ranges and corresponding IF values are calculated for down converting RF signals. The algorithm is tested for six RF signals of differ-ent wireless technologies which are integrated and simultaneously down converted using SDR based front end receiver and thus the system multiplies the base station capacity by a factor of six. The simulation results are obtained and shown in this paper which proves that the algorithm de-veloped works well for most of the wireless technologies.
Keywords
Radio, Wireless Communication
1. Introduction
Software Defined Radio (SDR) technology enables us to integrate different wireless technologies. Parameters such as modulation, cutoff frequencies, bandwidth and waveforms etc. could be implemented using software modules on SDR platform. SDR provides interoperability among various technologies using reconfigurable ar-chitecture with respective software modules, by using high speed Digital Signal Processors (DSP), multiband analog to digital/digital to analog convertors (ADC/DAC), Numerically Controlled Oscillators, etc.
J. Mitola has explained the SDR architecture and enumerated its applications in [1]. RF frontend design for SDR and Cognitive Radio (CR) receivers is explained in [5]. SDR technology faces many challenges in design-ing suitable software modules and their implementation, which is explained in [7]. Authors in [8] have explained the SDR receiver design method. Design aspects of software radio receiver for Wi-Fi technology have been enumerated in [9]. In the research article presented in [10], Global Navigation Satellite System (GNSS) receiver and effect of timing jitter are discussed. Effect of timing delays while carrying out sub-sampling of signals is presented in [11]. Authors in [12] presented the concepts in the design of clock circuitry for high-speed ADCs. Timing jitter and quantization error effect the performance of ADC in SDR receivers, which is explained in [13]. Band pass sampling for down conversion of a few RF signals is given in [14]. Timing jitter design model for Voltage-to-Time converter circuits is given in [15]. Design of asymmetrical resonator for microstrip triple-band and broadband band pass filters is presented in [16].
In order to implement reconfigurable SDR architecture for multiple mobile technologies, we need to find the most optimal sampling frequency to be assigned to ADC for digitization of RF signals. In this paper, an efficient method of universal band pass sampling algorithm is proposed for integration of multiple wireless technologies by down conversion of RF signals to baseband spectra. The main difficulty in integration of multiple RF signals using SDR platform is to design multiband ADC and sharp band pass filters. The design difficulties can be re-duced to large extant by considering guard band between the down converted RF signals. This innovative idea is implemented in universal band pass sampling algorithm and valid and optimal sampling frequencies are calcu-lated for six RF signals of different wireless technologies. The results obtained after down converting to base-band spectrum of the signals are given in this paper.
2. Clock Jitter
For better performance of ADC/DAC in RF frontend architecture, accuracy in sampling frequency and timing is very much essential. Timing jitter or clock jitter while sampling the incoming RF signal affects adversely the ADC output and increases the noise. This will also affect the system by increasing the adjacent channel inter-ference and carrier frequency instability. Research works are currently undergoing in this field for the design of multiband ADC and sharp cut off filters. In the work presented in [6], effect of time jitter is analyzed in the de-sign of ADC/DAC. The problems due to clock jitter are addressed in this paper by innovative method of insert-ing guard band between the down converted RF signals which will ease the design complexities of ADC/DAC and sharp cut off filters and also reduces aliasing error and adjacent channel interference.
3. Universal Band Pass Sampling Algorithm
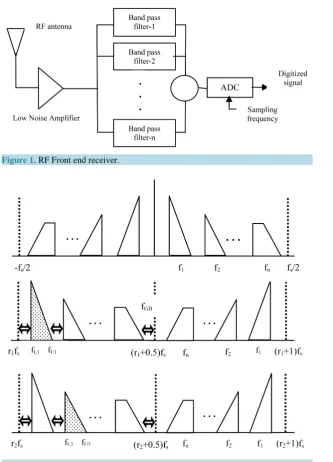
The SDR based front end receiver down converts multiple radio signals directly to a target intermediate fre-quency using band pass sampling. In this method, signal spectra and their replicas are identified first and then the boundary conditions and neighborhood constraints are determined. Using these conditions, valid sampling frequency ranges are obtained. There could be many possible values, but we need to find the optimal and valid sampling frequency and corresponding intermediate frequency for the down conversion of RF signals. A typical RF front end receiver is shown Figure 1.
Multiple RF signal spectra with guard band considered between the signals in the band pass sampling method are shown in Figure 2.
Figure 1. RF Front end receiver.
Figure 2. RF signal spectra with band pass sampling.
frequency segment of any integral multiple of fs/2. Which means that signal spectra should lie inside the
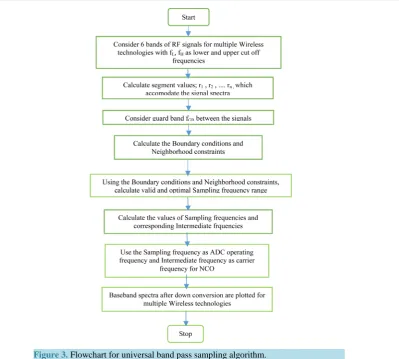
seg-ments r1, r2, ∙∙∙, rn respectively. Figure 3 depicts the flowchart of universal band pass sampling algorithm struc-ture.
Boundary conditions and neighborhood constraints for the signals are worked out from Figure 2 and some of these conditions are given in Table 1. Valid and optimal sampling frequency ranges are calculated using these conditions and are given in Table 2. The values of sampling frequencies and the corresponding intermediate frequencies are calculated for six RF signals of different wireless technologies and are given in Table 3 and
Table 4.
Figure 3. Flowchart for universal band pass sampling algorithm.
Table 1. Boundary conditions and neighbourhood constrains.
Sl No. Boundary conditions and neighbourhood constraints
1 ( ) ( ) ( )
( )
1 1 2 1 2 1
5 5
1 ; ;
0.5
U s U L s
L s
f r f f f r r f
f r f
≤ + − ≥ −
≥ +
2 ( 2 ) (2 )
1 2 3 4 5 1 2 3 4 5
;
1
L s
U U U U U s
f r f
f f f f f r r r r r f
≥
+ + + + ≤ + + + + +
3 fL1≥r f1 s;fU2≤(r2+0.5)fs
4 ( )
( )
1 1 2 2
3 3
; 0.5 ;
1
L s L s
L s
f r f f r f
f r f
≥ ≥ +
≥ +
5 (fL6−fU5) (≤ r6−r5)fs;fU6≤(r6+1)fs
6 (1 1 ) (2 (2 ))
5 6 5 6
; 0.5 ;
1
l s L s
U U s
f r f f r f
f f r r f
≥ ≤ +
+ ≤ + +
7 ( 6 (6) ( ) )
2 3 4 5 6 2 3 4 5 6
0.5 ;
1
U s
L L L L L s
f r f
f f f f f r r r r r f
≤ +
+ + + + ≥ + + + + +
8 1 (1 ) 5 (5 )
6 6
0.5 ; 0.5 ;
U s U s
U s
f r f f r f
f r f
≤ + ≤ +
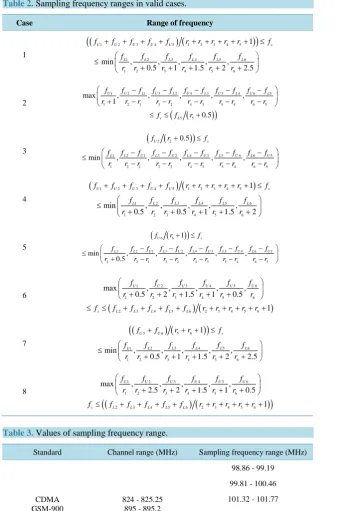
[image:4.595.123.523.78.437.2]Table 2. Sampling frequency ranges in valid cases.
Case Range of frequency
1
( ) ( )
(
1 2 3 4 5 1 2 3 4 5)
3 5 6
1 2 4
1 2 3 4 5 6
1
min , , , , ,
0.5 1 1.5 2 2.5
U U U U U s
L L L
L L L
f f f f f r r r r r f
f f f
f f f
r r r r r r
+ + + + + + + + + ≤ ≤ + + + + + 2 ( )
(
)
1 2 1 3 2 4 3 5 4 6 5
1 2 1 3 2 4 3 5 4 6 5
5 5
max , , , , ,
1
0.5
U U L U L U L U L U L
s L
f f f f f f f f f f f
r r r r r r r r r r r
f f r
− − − − − + − − − − − ≤ ≤ + 3 ( )
(
2 2)
2 1 3 2 4 3 5 4 6 5
1
1 2 1 3 2 4 3 5 4 6 5
0.5
min , , , , ,
U s
L U L U L U L U L U
L
f r f
f f f f f f f f f f
f
r r r r r r r r r r r
+ ≤
− − − − −
≤ − − − − −
4
( 1 2 3 4 5) (1 2 3 4 5 )
3 5 6
1 2 4
1 2 3 4 5 6
1
min , , , , ,
0.5 0.5 1 1.5 2
U U U U U s
L L L
L L L
f f f f f r r r r r f
f f f
f f f
r r r r r r
+ + + + + + + + + ≤ ≤ + + + + + 5 ( )
( 6 6 )
2 1 3 2 4 3 5 4 6 5
2
2 2 1 3 2 4 3 5 4 6 5
1
min , , , , ,
0.5
U s
L U L U L U L U L U
L
f r f
f f f f f f f f f f
f
r r r r r r r r r r r
+ ≤ − − − − − ≤ + − − − − − 6 ( ) ( )
1 2 3 4 5 6
1 2 3 4 5 6
2 3 4 5 6 2 3 4 5 6
max , , , , ,
0.5 2 1.5 1 0.5
1
U U U U U U
s L L L L L
f f f f f f
r r r r r r
f f f f f f r r r r r
+ + + + + ≤ ≤ + + + + + + + + + 7 ( ) ( )
(
5 6 5 6)
3 5 6
1 2 4
1 2 3 4 5 6
1
min , , , , ,
0.5 1 1.5 2 2.5
U U s
L L L
L L L
f f r r f
f f f
f f f
r r r r r r
+ + + ≤ ≤ + + + + + 8 ( ) ( )
(
)
1 2 3 4 5 6
1 2 3 4 5 6
2 3 4 5 6 2 3 4 5 6
max , , , , ,
2.5 2 1.5 1 0.5
1
U U U U U U
s L L L L L
f f f f f f
r r r r r r
f f f f f f r r r r r
+ + + + +
[image:5.595.160.468.528.675.2]≤ + + + + + + + + +
Table 3. Values of sampling frequency range.
Standard Channel range (MHz) Sampling frequency range (MHz)
CDMA GSM-900 GSM-1800 WCDMA 802.11b 802.11a
824 - 825.25 895 - 895.2 1795 - 1795.2
1920 - 1925 2402 - 2422 5170 - 5190
98.86 - 99.19
99.81 - 100.46
101.32 - 101.77
103.16 - 103.24
103.80 - 104.48
112.65 - 112.80
113.24 - 113.57
115.33 - 116.02
cannot be applied to other mobile technologies.
filters are reduced to maximum extant by considering the insertion of guard bands between the signals. Using this algorithm, valid and optimal sampling frequency ranges and corresponding IF values are calculated for down converting RF signals of most of the current wireless technologies. With this algorithm, the SDR based front end receiver multiplies the base station capacity by a factor of six.
4. Software Defined Integrated RF Frontend Architecture
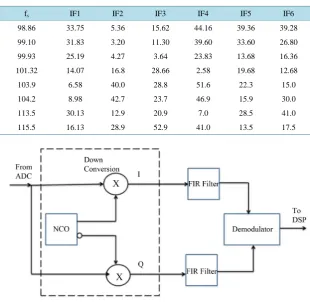
SDR platform for the integration of multiple wireless technologies is depicted in the front end architecture [14] and shown in Figure 4 and Figure 5. The parameters that are configurable through software modules are mod-ulation, cut off frequency, sampling frequency, bandwidth, etc. ADC in frontend architecture includes the fea-tures of automatic gain control (AGC) and low noise amplification (LNA). Digital oscillator function is carried out by numerical controlled oscillator (NCO) in SDR based frontend architecture. The algorithm presented here gives us the sampling and intermediate frequencies which are applied to ADC and NCO in the frontend receiver architecture.
5. Simulation Results
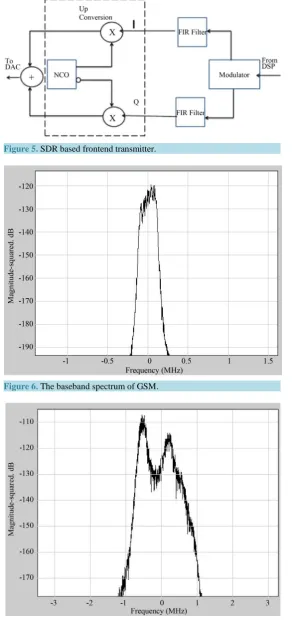
Computer simulation is carried out using Matlab software. For simulation purpose, we chose the frequency bands (in MHz) as 824 - 825.25 for CDMA, 895 - 895.2 & 1795 - 1795.2 for dual-band GSM, 1920 - 1925 for Wideband CDMA (WCDMA), 2402 - 2422 for IEEE 802.11b and 5170 - 5190 for IEEE 802.11a standards. All these RF signals are received by the antenna and inputted to the ADC whose sampling frequency is selected from the values given in Table 4. Numerically Controlled Oscillator (NCO) in the front-end receiver is operated at the corresponding IF values taken from Table 4.
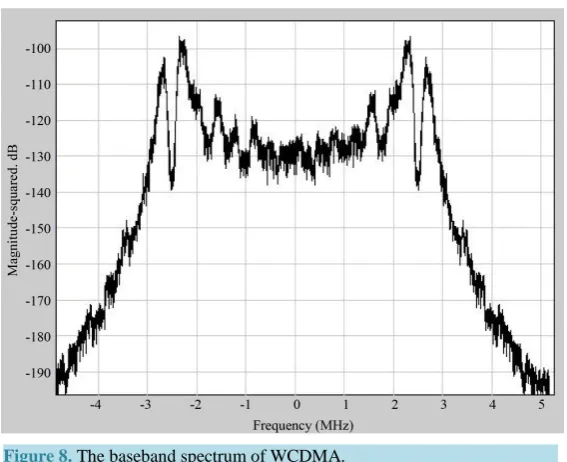
[image:6.595.157.468.407.709.2]The baseband spectra of GSM mobile technology is given in Figure 6. The result shows that the spectrum lies in the bandwidth of 200 KHz, which is the baseband spectrum of GSM technology. Similarly, baseband spectra of CDMA and WCDMA are shown in Figure 7 and Figure 8. These results show that the spectrum lies in
Table 4. Sampling frequency and IF in MHz.
fs IF1 IF2 IF3 IF4 IF5 IF6
98.86 33.75 5.36 15.62 44.16 39.36 39.28
99.10 31.83 3.20 11.30 39.60 33.60 26.80
99.93 25.19 4.27 3.64 23.83 13.68 16.36
101.32 14.07 16.8 28.66 2.58 19.68 12.68
103.9 6.58 40.0 28.8 51.6 22.3 15.0
104.2 8.98 42.7 23.7 46.9 15.9 30.0
113.5 30.13 12.9 20.9 7.0 28.5 41.0
[image:6.595.156.469.407.714.2]115.5 16.13 28.9 52.9 41.0 13.5 17.5
Figure 5. SDR based frontend transmitter.
Figure 6. The baseband spectrum of GSM.
Figure 8. The baseband spectrum of WCDMA.
1.25 MHz and 5 MHz, which are the baseband spectra of CDMA and WCDMA respectively.
These results prove that the band pass sampling algorithm developed in this paper works well and accurately down converts the RF signals to their baseband spectrum. The results also show that the algorithm developed in this paper is very effective and works well simultaneously for six RF bands of different wireless technologies.
6. Conclusion
A computationally simple, less-iterative and efficient algorithm is presented in this work for integration of mul-tiband RF signals using SDR platform. Using this method, difficulties that arise due to design complexities of multiband ADC and sharp cut off filters are reduced to large extant by considering the insertion of guard bands between the signals. Further, problem of aliasing error which occurs due to sampling/timing jitter and interfer-ence is reduced considerably. Using this algorithm, valid and optimal sampling frequency ranges and corre-sponding IF values are calculated for down converting RF signals of most of the current wireless technologies. The results of the universal band pass sampling algorithm developed in this paper are applied to six different wireless technologies. With this algorithm, the SDR based front end receiver multiplies the base station capacity by six times. This algorithm would be useful for applications like Radio Frequency Identification (RFID), mili-tary radio, vehicular traffic control, etc. The universal band pass sampling algorithm developed in this paper for a six band case can be extended for N bands.
References
[1] Mitola, J. (1995) The Software Radio Architecture. IEEE Communications Magazine, 33, 26-38.
http://dx.doi.org/10.1109/35.393001
[2] Akos, D.M., Stockmaster, M., Tsui, J.B. and Caschera, J. (1999) Direct Bandpass Sampling of Multiple Distinct RF Signals. IEEE Transactions on Communications, 47, 983-988. http://dx.doi.org/10.1109/26.774848
[3] Tseng, C.-H. and Chou, S.-C. (2003) Direct Downconversion of Multiple RF Signals Using Bandpass Sampling. IEEE International Conference onCommunications, 3, 2003-2007.
[4] Sen, S., Singh, R. and Gadre, V.M. (2005) Bandpass Sampling for Software Radio. General Assembly of International Union of Radio Science (URSI), New Delhi.
[5] Kim, H.J., Kim, J.U., Kim, J.H., Wang, H. and Lee, I.S. (2010) The Design Method and Performance Analysis of RF Subsampling Frontend for SDR/CR Receivers. IEEE Transactions on Industrial Electronics, 57, 1518-1525.
http://dx.doi.org/10.1109/TIE.2009.2033491
[7] Ulversøy, T. (2010) Software Defined Radio: Challenges and Opportunities. IEEE Communications Surveys & Tuto-rials, 12, 531-550. http://dx.doi.org/10.1109/SURV.2010.032910.00019
[8] Peng, L. and Ma, H. (2011) Design and Implementation of Software-Defined Radio Receiver Based on Blind Nonli-near System Identification and Compensation. IEEE Transactions on Circuits and Systems I: Regular Papers, 58, 2776-2789. http://dx.doi.org/10.1109/TCSI.2011.2151050
[9] Exel, R. (2012) Receiver Design for Time-Based Ranging with IEEE 802.11 b Signals. International Journal of Navi-gation and Observation, 2012, Article ID: 743625.
[10] Lamontagne, G., Rene Jr., L. and Kouki, A.B. (2012) Direct RF Sampling GNSS Receiver Design and Jitter Analysis.
Positioning, 3, 46-61.
[11] Vasudevamurthy, R. and Amrutur, B. (2013) Multiphase Technique to Speed-Up Delay Measurement via Sub-Sampling. 26th International Conference on VLSI Design and 12th International Conference on Embedded Systems (VLSID), Pune, 5-10 January 2013, 185-190. http://dx.doi.org/10.1109/vlsid.2013.186
[12] Doris, K., Janssen, E., Nani, C., Zanikopoulos, A. and Van der Weide, G. (2011) A 480 mW 2.6 GS/s 10b Time- Interleaved ADC with 48.5 dB SNDR up to Nyquist in 65 nm CMOS. IEEE Journal of Solid-State Circuits, 46, 2821- 2833.
[13] Silva, A., Guilherme, J. and Horta, N. (2009) Reconfigurable Multi-Mode Sigma-Delta Modulator for 4G Mobile Ter-minals. Integration, The VLSI Journal, 42, 34-46. http://dx.doi.org/10.1016/j.vlsi.2008.07.004
[14] Budaraju, S.M. and Bhagyaveni, M.A. (2013) A Novel Method of Band Pass Sampling for Down Conversion of Mul-tiple RF Signals. Proceedings of International Conference on Advances in Electrical and Electronics, AETAEE, El-sevier, 636-644.
[15] Mostafa, H. and Ismail, Y.I. (2015) A Design-Oriented Timing Jitter/Skew Model in Voltage-to-Time Converter (VTC) Circuits. Analog Integrated Circuits and Signal Processing, 82, 309-321. http://dx.doi.org/10.1007/s10470-014-0465-z