International Journal of Emerging Technology and Advanced Engineering
Website: www.ijetae.com (ISSN 2250-2459, ISO 9001:2008 Certified Journal, Volume 3, Issue 10, October 2013)
153
Voltage Sag Mitigation in the Distributed Generation System
with STATCOM
Sumeet Trivedi
1, D. Chattopadhyay
21
M.E.Student, Power System Engg., S.S.C.E.T., Bhilai, C.G., India
2Sr.Asso.Professor, E.E.E. Deptt., S.S.C.E.T., Bhilai, C.G., India Abstract— This paper investigates the effect of Static
Synchronous Compensator (STATCOM) on the voltage sag in a distributed generation system. For this purpose, the DG system of an integrated steel plant, which is connected to 132 KV grid, is taken under study. The entire system is modelled with STATCOM based Voltage Source Converter (VSC) PWM technique. The voltage sag improvement of the DG system is compared with and without STATCOM. Power System Computer Aided Design/Electromagnetic Transients including DC (PSCAD/EMTDC) is used to carry out simulation of the system under study and detailed results are shown to access the performance of STATCOM based Voltage Source Converter.
Keywords— Distributed Generation, Voltage Sag, STATCOM, PSCAD, PWM
I. INTRODUCTION
A Voltage Sag as defined by IEEE Standard 1159-1995,
IEEE Recommended Practice for Monitoring Electric Power Quality, is a decrease in RMS voltage at the power frequency for durations from 0.5 cycles to 1 minute, reported as the remaining voltage. The measurement of a Voltage Sag is stated as a percentage of the nominal voltage, it is a measurement of the remaining voltage and is stated as a sag TO a percentage value. Thus a Voltage Sag to 60% is equivalent to 60% of nominal voltage, or 288 Volts for a nominal 480 Volt system. Voltage sags can occur on Utility systems both at distribution voltages and transmission voltages. Voltage sags which occur at higher voltages will normally spread through a utility system and will be transmitted to lower voltage systems via transformers. Voltage sags can be created within an industrial complex without any influence from the Utility system. These sags are typically caused by starting large
motors or by electrical faults inside the facility.
Fig.1 A balanced three phase voltage sag
Traditional methods of Voltage Control include Transformer Tap Changers both mechanical and SCR switched units [4], Servo-Variac technology and Ferro-Resonant Transformers (constant voltage transformers) . In some cases and for some applications these traditional technologies may still be applicable and work well but in many cases they were designed to correct problems other than voltage sags. Industrial UPS units are widely used to protect electronic process control equipment and to allow for an orderly shutdown of the process but it is rarely economic to install large UPS systems with their attendant large battery banks for high power electrical equipment such as high horsepower drives, extruders etc. Different power electronics solutions are used for improving the performance of the power system by mitigating the voltage sag [7]. Mitigation devices are installed at the system-load interface for power quality enhancement and prevent the voltage dip [5],[8],[9].
International Journal of Emerging Technology and Advanced Engineering
Website: www.ijetae.com (ISSN 2250-2459, ISO 9001:2008 Certified Journal, Volume 3, Issue 10, October 2013)
154
At present, a wide range of very flexible controllers, which capitalize on newly available power electronics components, are emerging for custom power applications. Among these, the static compensator (STATCOM) and the dynamic voltage restorer (DVR), both of them based on the VSC principle, are the controllers which have received the most attention. The DVR is a dynamic solution for protection of critical loads from voltage sags / swells [6]. The DVR restores constant load voltage and voltage wave form by injecting an appropriate voltage. Modern industrial processes are based on a large amount of electronic devices such as programmable logic controllers and adjustable speed drives. Unfortunately, electronic devices are sensitive to disturbances, and thus, industrial loads become less tolerant to power quality problems such as voltage
sags, voltage swells, and harmonics. The dynamic voltage
restorer (DVR) has become popular as a cost effective solution for the protection of sensitive loads from voltage sags and swells [10].
A Static Synchronous Compensator (STATCOM) is a static synchronous generator operated as a shunt connected static var compensator whose capacitive or inductive output current can be controlled in- dependent of the AC system voltage. A STATCOM is a controlled reactive-power source. It provides voltage support by generating or absorbing reactive power at the point of common coupling without the need of large external reactors or capacitor banks. Voltage fluctuations caused by rapid industrial load changes have been a major concern for both power companies and customers in the area of power quality [1]. The fast response of the static compensator (STATCOM) makes it an efficient solution for improving power quality in distribution systems. The STATCOM have a function of compensating reactive power, absorbing the harmonic and compensating the voltage dip [2].
II. STATCOM
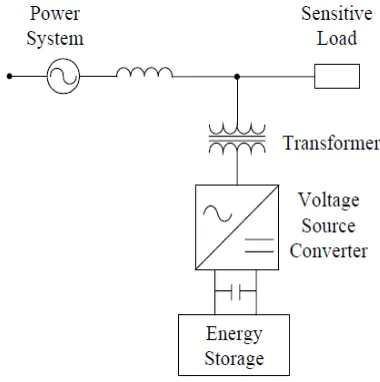
The Static Synchronous Compensator (STATCOM) is a VSC that is shunt connected to the distribution system by means of a tie reactance. In general, a coupling transformer is installed between the distribution system and the STATCOM for isolating the low voltage (STATCOM)
from the high voltage (distribution system), as shown in
Fig. The STATCOM can be seen as a current source since it is connected in shunt with the distribution system and the load.
[image:2.612.340.530.207.398.2]By controlling the magnitude and the phase angle of the output voltage of the VSC, both active and reactive power can be exchanged between the distribution system and the STATCOM. Being a shunt connected device, the STATCOM mainly injects reactive power to the system.
Fig.2 STATCOM connected to a power system
The contribution of the STATCOM to the load bus voltage equals the injected current times the impedance seen from the device, which is the source impedance in parallel with the load impedance. The ability of the STATCOM to compensate the voltage dip is limited by this available parallel impedance. In addition, the device should be installed as close to the sensitive load as possible to maximize the compensating capability. The STATCOM also can be used in the function: power factor correction, mitigation of load fluctuation (including voltage flicker) [3] and active filtering.
A STATCOM functions as a shunt-connected
synchronous voltage source which accounts for its superior functional characteristics, better performance, and greater application flexibility. Concerning the non-linear operating range, the STATCOM is able to control its output current over the rated maximum capacitive or inductive range
independently of AC system voltage.Thus, the STATCOM
is more effective in providing voltage support under large
system disturbances during which the voltage excursions
International Journal of Emerging Technology and Advanced Engineering
Website: www.ijetae.com (ISSN 2250-2459, ISO 9001:2008 Certified Journal, Volume 3, Issue 10, October 2013)
155
The ability of the STATCOM to maintain full capacitive output current at low system voltage also makes it more effective in improving the transient stability.
Fig.3 STATCOM V-I characteristics
The attainable response time and the bandwidth of the closed voltage regulation loop of the STATCOM are significantly better. In situations where it is necessary to provide active power compensation the STATCOM is able to interface a suitable energy storage (large capacitor, battery, ...) from where it can draw active power at its DC terminal and deliver it as AC power to the system.
III. DISTRIBUTED GENERATION SYSTEM OF NECO STEEL
PLANT
Distributed generation (or DG) generally refers to small-scale (typically 1 kW – 50 MW) electric power generators that produce electricity at a site close to customers or that are tied to an electric distribution system. There are many reasons a customer may choose to install a distributed generator. DG can be used to generate a customer’s entire electricity supply; for peak shaving (generating a portion of a customer’s electricity onsite to reduce the amount of electricity purchased during peak price periods); for standby or emergency generation (as a backup to Wires Owner's power supply); as a green power source (using renewable technology); or for increased reliability. In some remote locations, DG can be less costly as it eliminates the need for expensive construction of distribution and/or transmission lines.
Distributed Generation has a lower capital cost because of the small size of the DG (although the investment cost per kVA of a DG can be much higher than that of a large power plant).
It may reduce the need for large infrastructure construction or upgrades because the DG can be constructed at the load location. If the DG provides power for local use, it may reduce pressure on distribution and transmission lines [11]. With some technologies, DG produces zero or near-zero pollutant emissions over its useful life (not taking into consideration pollutant emissions over the entire product lifecycle i.e. pollution
produced during the manufacturing, or after
decommissioning of the DG system). With some technologies such as solar or wind, it is a form of renewable energy. It can increase power reliability as back-up or stand-by power to customers and offers customers a choice in meeting their energy needs [12].
In this paper, we have taken under study, the distributed power system of NECO steel plant situated at Raipur. This system consists of six turbo generators of small size which generate electricity utilizing the heat of waste blast furnace gas and coke oven gas in the boilers & produce steam to run the turbines. Out of these, TG1 to TG5 generates power at 6.6 kV whereas TG6 generates at 11 kV. As it is clear in the single line diagram that all the generators are ultimately connected to 132 kV CSEB grid, so the flow of power is possible in both the directions, as per condition.
Fig.4 Single Line Diagram of power system of NECO steel plant connected to 132 kV grid
IV. SIMULATION IN PSCAD AND DESCRIPTION
International Journal of Emerging Technology and Advanced Engineering
Website: www.ijetae.com (ISSN 2250-2459, ISO 9001:2008 Certified Journal, Volume 3, Issue 10, October 2013)
156
Its graphical user interface enables all aspects of the simulation to be conducted within a single integrated environment including circuit assembly, run-time control, analysis of results, and reporting [15]. PSCAD/EMTDC use in determining the exact switching times that allows the simulation to run at high speed and does not introduce
inaccurate results. Another valuable feature of
PSCAD/EMTDC is the accurate model provided for the wind turbine rotors, transformers, underground cables and other electrical and electronic devices. At present a wide range of very flexible controllers, which capitalize on newly available power electronics components, are emerging for custom power applications. Among these, the static compensator (STATCOM) and the dynamic voltage restorer (DVR), both of them based on the VSC principle and the SSTS are the controllers which have received the most attention. PSCAD/EMTDC will be used to perform the modelling and analysis of such controllers for a wide range of operating conditions [16]. PSCAD/EMTDC’s
highly developed graphical interface has proved
instrumental in implementing the graphics-based PWM control the STATCOM [13],[14]. The single line diagram shown above is modelled in PSCAD.
Fig.5 Three Phase Fault block and STATCOM connected to 132 kV bus of the network
Now we connect a Three Phase Fault block in the diagram in the 132 kV bus of the network with additional resistance and inductance. This will create the effect of a voltage sag instead of the fault, whose duration will be determined by the Timed Fault Logic. To mitigate this voltage sag, STATCOM is connected to the same bus via. a filter, an HV breaker and a 2-wdg. transformer.
This breaker is initially in closed condition. A portion of the network is shown below with 132 kV bus and STATCOM & Fault block connected to it.
V. RESULTS AND DISCUSSION
A. During Normal Condition
1) When the grid connected DG system is working under the normal conditions and the simulation is run for no fault (or voltage sag) introduced in the system, then the three phase grid voltage is obtained as shown below:
RE : Graphs
Time S 0.500 0.520 0.540 0.560 0.580 0.600 0.620 0.640 ... ... ... -100
-75 -50 -25 0 25 50 75 100
V
o
lt
a
g
e
(
k
V
)
V132
Fig.6 Three phase voltage during normal condition
2) The per unit voltage is also constant at 1.1 pu during the whole simulation time which is in the voltage stable zone:
Voltage in pu
Time S 0.0 1.0 2.0 3.0 4.0 5.0 ...
... ... -2.00
-1.50 -1.00 -0.50 0.00 0.50 1.00 1.50 2.00
V
o
lt
a
g
e
p
u
Vpu
Fig.7 Per unit voltage during normal condition
International Journal of Emerging Technology and Advanced Engineering
Website: www.ijetae.com (ISSN 2250-2459, ISO 9001:2008 Certified Journal, Volume 3, Issue 10, October 2013)
157
Fault Current
Time S 0.0 1.0 2.0 3.0 4.0 5.0 ...
... ... -2.00 -1.50 -1.00 -0.50 0.00 0.50 1.00 1.50 2.00 F a u lt C u rr e n t (K A )
Fault Current Ifa Fault Current Ifb Fault Current Ifc
Fig.8 Fault current in three phases during normal condition B. During Voltage Sag Condition
1) By using the Three Phase Fault block, a voltage sag is introduced in the 132 kV bus voltage from 1.0 sec. to 1.75 sec.
RE : Graphs
Time S 1.0 2.0 3.0 4.0 5.0 ...
... ... -100 -80 -60 -40 -20 0 20 40 60 80 100 V o lt a g e ( k V ) V132
Fig.9 Three phase voltage during voltage sag condition
2) The dip in the per unit voltage is also obtained as it dropped from 1.1 pu to 0.85 pu for 0.75 sec.
Voltage in pu
Time S 1.0 2.0 3.0 4.0 5.0 ...
... ... -2.00 -1.50 -1.00 -0.50 0.00 0.50 1.00 1.50 2.00 V o lt a g e p u Vpu
Fig.10 Per unit voltage during voltage sag condition
3) During the same interval, a fault current is flowing in all the three phases i.e. Ifa, Ifb, Ifc is not zero for 0.75 sec.
Fault Current
Time S 1.0 2.0 3.0 4.0 5.0 ...
... ... -2.00 -1.50 -1.00 -0.50 0.00 0.50 1.00 1.50 2.00 F a u lt C u rr e n t (K A )
Fault Current Ifa Fault Current Ifb Fault Current Ifc
Fig.11 Fault current in three phases during voltage sag condition C. Effect of STATCOM on Voltage Sag
1) Now we connect a STATCOM in the 132 kV bus whose breaker is in initially closed position, and run the simulation with the voltage sag created for 0.75 sec., we observe that as soon as voltage sag is produced at 1.0 sec, it is mitigated by the effect of STATCOM as it injects the voltage during the whole voltage dip of 0.75 sec.
RE : Graphs
Time S 0.80 1.00 1.20 1.40 1.60 1.80 2.00 ... ... ... -150 -100 -50 0 50 100 150 V o lt a g e ( k V ) V132
Fig.12 Voltage mitigation during fault by STATCOM
International Journal of Emerging Technology and Advanced Engineering
Website: www.ijetae.com (ISSN 2250-2459, ISO 9001:2008 Certified Journal, Volume 3, Issue 10, October 2013)
158 Voltage in pu
Time S 1.0 2.0 3.0 4.0 5.0 ...
... ... -3.0
-2.0 -1.0 0.0 1.0 2.0 3.0
V
o
lt
a
g
e
p
u
Vpu
Fig.13 Per unit voltage mitigation during fault by STATCOM
VI. CONCLUSION
In this paper, the effect of voltage sag on the distributed power system of an steel plant has been studied and the role of STATCOM on the mitigation of the voltage dip have been found out. The simulations are carried out in PSCAD and its results are analysed with & without STATCOM connected in the 132 kV bus. It is clear that the presence of STATCOM in the network helps in mitigating the voltage sag and the bus voltage remains in the stable region.
REFERENCES
[1] Teleke, S. Quanta Technol., Raleigh, NC, USA Yazdani,
A. ; Gudimetla, B. ; Enslin, J. ; Castaneda, J.‖ Application of STATCOM for power quality improvement‖ Power Systems Conference and Exposition (PSCE), 2011 IEEE/PES, 20-23 March 2011 Page(s): 1 – 6
[2] Madhusudan, R. Dept. of Electr. & Electron. Eng., Sir C.R. Reddy
Coll. of Eng., Eluru, India Ramamohan Rao, G.‖ Modeling and simulation of a distribution STATCOM (D-STATCOM) for power quality problems-voltage sag and swell based on Sinusoidal Pulse Width Modulation (SPWM)‖Advances in Engineering, Science and Management (ICAESM), 2012 International Conference on 30-31 March 2012 Page(s): 436 – 441
[3] Ag ero J. . Fac. de Ingenieria, Universidad Nacional de La
Plata Issouribehere, F. ; Battaiotto, P.E.‖STATCOM modeling for mitigation of voltage fluctuations caused by electric arc furnaces ―Power Engineering Society General Meeting, 2006. IEEE
[4] Salman, N. Dept. of Electr., Electron. & Syst. Eng., Univ.
Kebangsaan Malaysia, Bangi, Malaysia ,Mohamed, A. ; Shareef, H.‖ Voltage sag mitigation in distribution systems by using genetically optimized switching actions‖ Power Engineering and Optimization Conference (PEOCO), 2011 5th International Date of Conference: 6-7 June 2011 Page(s): 329 – 334
[5] Wang, P. Centre for Electr. Energy, Univ. of Manchester Inst. of Sci. & Technol., UK Jenkins, N. ; Bollen, M.H.J. ―Experimental investigation of voltage sag mitigation by an advanced static VAr compensator‖ Power Delivery, IEEE Transactions on (Volume:13, Issue: 4 ) Oct 1998Page(s):1461 – 1467
[6] Kantaria, R.A. Dept. of Electr. Eng., M. S. Univ., Baroda, India Joshi, S.K. ; Siddhapura, K.R.‖ A novel technique for mitigation of voltage sag/swell by Dynamic Voltage Restorer (DVR)‖ Electro/Information Technology (EIT), 2010 IEEE International Conference on 20-22 May 2010 Page(s): 1 – 4
[7] Sannino, A. Dipt. di Ingegneria Elettrica, Palermo Univ., Italy
Miller, M.G. ; Bollen, M.H.J. ―Overview of voltage sag mitigation‖
Power Engineering Society Winter Meeting, 2000.
IEEE (Volume:4) 2000 Page(s): 2872 - 2878 vol.4
[8] Bin Wang Dept. of Electr. Eng., Tsinghua Univ., Beijing, China Xinzhou Dong ; Zhencun Pan‖ Voltage sags mitigation with feeder fast-tripping overcurrent protection‖ Electric Utility Deregulation and Restructuring and Power Technologies (DRPT), 2011 4th International Conference on 6-9 July 2011 Page(s): 67 – 72
[9] Ipinnimo, O. Electr. Eng. Dept., Univ. of Cape Town, Cape Town,
South Africa Chowdhury, S. ; Chowdhury, S.P. ―Voltage dip mitigation with DG integration: A comprehensive review‖ Power Electronics, Drives and Energy Systems (PEDES) & 2010 Power India, 2010 Joint International Conference on 20-23 Dec. 2010 Page(s): 1 - 10
[10] Rajasekaran, D. Department of EEE, R.M.D Engineering College,
Chennai, Tamilnadu, India Dash, Subhransu Sekhar ; Vignesh, P.‖ Mitigation of voltage sags and voltage swells by Dynamic Voltage Restorer‖ Advances in Recent Technologies in Communication and Computing (ARTCom 2011), 3rd International Conference on 14-15 Nov. 2011 Page(s): 36 – 40
[11] Wang Bo Sch. of Electr. Eng., Wuhan Univ., Wuhan, China
Lan Ka ―Analysis of the Distributed Generation System and the Influence on Power oss‖ Power and Energy Engineering Conference (APPEEC), 2011 Asia-Pacific 25-28 March 2011 Page(s): 1 – 4
[12] Barker, P.P. Power Technol. Inc., Schenectady, NY, USA
de Mello, R.W.‖ Determining the impact of distributed generation on
power systems. I. Radial distribution systems‖
Power Engineering Society Summer Meeting, 2000.
IEEE (Volume:3 ) 2000 Page(s): 1645 - 1656 vol. 3
[13] Champa Nandi, Sumita Deb, Minakshi Deb Barma, and A.K.
Chakraborty, Member, IACSIT, ―Study and Simulation of the SVC and STATCOM Effect onVoltage Collapse and Critical Fault
Clearing Time‖, International Journal of Modeling and
Optimization, Vol. 2, No. 4, August 2012, Pg. no. 462-465
[14] Champa Nandi and A. K. Chakraborty , Wind Power Plants with
VSC Based STATCOM in PSCAD/EMTDC Environment, 2012 2nd International Conference on Power and Energy Systems (ICPES 2012) DOI: 10.7763/IPCSIT.2012.V56.2 IPCSIT vol. 56 (2012) © (2012) IACSIT Press, Singapore, Pg. no. 7-11
[15] Olimpo Anaya-Lara and E. Acha, Modeling and Analysis of
Custom Power Systems by PSCAD/EMTDC, IEEE
TRANSACTIONS ON POWER DELIVERY, VOL. 17, NO. 1, JANUARY 2002, Pg. no. 266-272
International Journal of Emerging Technology and Advanced Engineering
Website: www.ijetae.com (ISSN 2250-2459, ISO 9001:2008 Certified Journal, Volume 3, Issue 10, October 2013)
159 AUTHOR’S PROFI E
Sumeet Trivedi is pursuing his M.E. in Power Systems Engg. from S.S.C.E.T., Bhilai.