Determination of p53 role in cancer biology and therapy
through interactome development and analysis
Michelle Hussain
School of Environment and Life Sciences, College of
Science & Technology,
University of Salford, Salford, UK
Submitted in Fulfilment of the Requirements of the
Degree of Doctor of Philosophy, 2016
Volume I
Table of Contents
1 Acknowledgements ... 8
2 Abbreviation ... 9
3 Abstract ... 11
4 Introduction ... 13
4.1 Systems biology ... 13
4.1.1 Systems biology and cancer ... 13
4.1.2 Computational techniques ... 15
4.1.2.1 Text mining approaches for protein – protein interaction analysis . 15 4.1.2.2 STRING database ... 16
4.1.2.3 Cytoscape software ... 17
4.1.2.4 System biology approaches ... 18
4.1.2.4.1 Top down approach ... 18
4.1.2.4.2 Bottom up approach ... 19
4.1.2.5 Mathematical modelling ... 20
4.1.2.5.1 Ordinary differential equations ... 20
4.1.2.5.2 Boolean modelling ... 21
4.1.2.6 CellNetAnalyzer ... 23
4.1.2.7 The PKT206 Model ... 25
4.1.3 Cancer ... 27
4.1.3.1 p53 overview ... 28
4.1.3.2 The tumor suppressor p53 – role in cancer ... 29
4.1.3.3 TP53 gene and structure ... 30
4.1.3.4 Regulation and control of the stress responsive transcription factor p53 ... 31
4.1.3.5 Post translational modifications of p53 ... 32
4.1.3.5.1 Phosphorylation ... 32
4.1.3.5.2 Acetylation ... 34
4.1.3.5.3 Ubiquitination ... 35
4.1.3.6 The p53-MDM2-MDMX relationship ... 36
4.1.3.7 The p53 network ... 37
4.1.3.7.1 Upstream events ... 38
4.1.3.7.2 DNA damage ... 39
4.1.3.7.3 Hypoxia ... 39
4.1.3.8 Downstream events ... 41
4.1.3.8.1 Cell cycle arrest ... 41
4.1.3.8.2 Cellular senescence ... 44
4.1.3.8.3 Apoptosis ... 45
4.1.3.8.4 Angiogenesis ... 47
4.1.3.8.5 DNA repair ... 51
5 Aims and hypothesis 57 6 Material and Methods ... 59
6.1 Systems biology and computational methodologies ... 59
6.1.1 MATLAB ... 59
database ... 59
6.1.2.2 Construction of all p53 models ... 61
6.1.2.3 Addition of biological outputs and input to the p53 models ... 62
6.1.3 Cytoscape ... 62
6.1.3.1 Visualization of networks ... 63
6.2 In silico analyses of the p53 models ... 63
6.2.1 Functional network analysis using CellNetAnalyzer ... 63
6.2.1.1 Application of dependency matrices to the p53 models ... 63
6.2.1.2 Application of logical steady state analysis to the p53 models ... 65
6.3 Genome wide validation of the p53 interactome models ... 67
6.3.1 Model validation using transcriptome profiles ... 68
6.4 Functional analysis of the PKT206 network ... 70
6.5 Laboratory based methodologies and materials ... 71
6.5.1 Mammalian cell culture ... 71
6.5.1.1 Cell line maintenance ... 71
6.5.1.2 Passage of cell lines ... 71
6.5.1.3 Freezing of cell lines ... 72
6.5.1.4 Thawing of cell lines ... 72
6.5.2 Immuno - detection of proteins ... 72
6.5.2.1 Preparation of whole cell extract ... 72
6.5.2.2 Protein concentration determination ... 73
6.5.2.3 SDS gel electrophoresis ... 74
6.5.2.4 Western transfer ... 75
6.5.2.5 Membrane stripping ... 75
6.6 Quantitative Real Time PCR ... 76
6.6.1 Total RNA isolation ... 76
6.6.2 Reverse transcription for cDNA synthesis ... 77
6.6.3 Oligonucleotide primer design ... 78
6.6.4 Quantitative Real Time PCR to determine mRNA expression levels of target genes ... 79
6.7 Small interfering RNA (siRNA) method ... 80
6.7.1 siRNA transfection for knockdown of target genes ... 81
6.7.2 Fluorescein isothiocyanate based measurement for transfection efficiency ... 84
6.8 MTT assay ... 85
6.9 Microarray ... 85
6.9.1 The Affymetrix Human Genome U133 plus 2.0 Array ... 86
6.9.2 Preparation of microarray samples ... 86
6.9.2.1 Microarray analysis ... 87
7 Results ... 88
7.1 Application of the signal transduction score flow algorithm to PKT206 ... 88
7.1.1 Application of STSFA to the PKT206 model ... 89
7.1.2 Validation of the STSFA p53 interactome using genome wide analysis ... 90
7.1.4 In silico knock out analysis of anti-apoptotic genes ... 94
7.1.5 Conclusion ... 95
7.2 Generation of the PMH260 model ... 98
7.2.1 Results ... 100
7.2.1.1 Generation of the PMH260 model ... 100
7.2.1.2 PMH260 network topology ... 102
7.2.2 Analysis and validation of the PMH260 model ... 136
7.2.2.1 Logical steady state analysis of PMH260 ... 136
7.2.2.2 Genome wide analysis and validation of the PMH260 model ... 144
7.2.2.3 Dependency matrix changes from in silico knockout analysis ... 161
7.2.3 Conclusion ... 167
7.3 Generation and analyses of the PMH302 model ... 170
7.3.1 Results ... 172
7.3.1.1 Generation of the PMH302 model ... 172
7.3.1.2 Network topology of PMH302 ... 172
7.3.2 Analysis and validation of the PMH302 model ... 229
7.3.2.1 Application of logical steady state analysis ... 229
7.3.2.2 DNA damage and p53 simulations ... 230
7.3.2.2.1 Nodes regulating apoptosis under LSSA ... 237
7.3.2.2.2 Nodes regulating angiogenesis under LSSA ... 247
7.3.2.2.3 Nodes regulating DNA repair under LSSA ... 252
7.3.2.2.4 Nodes regulating cell cycle arrest under LSSA ... 256
7.3.2.2.5 Nodes regulating cellular senescence under LSSA ... 262
7.3.2.3 Hypoxia and p53 LSSA simulations ... 269
7.3.2.3.1 Nodes regulating angiogenesis under LSSA ... 276
7.3.2.3.2 Nodes regulating apoptosis under LSSA ... 281
7.3.2.3.3 Nodes regulating cell cycle arrest under LSSA ... 290
7.3.2.3.4 Nodes regulating cellular senescence under LSSA ... 295
7.3.2.3.5 Nodes regulating DNA repair under LSSA ... 302
7.3.3 In silico node knockout analysis using dependency matrix calculations ... 305
7.3.4 Genome wide analysis and validation of the PMH302 model ... 331
7.3.4.1 Superimposition of U2OS cell line (p53 +/+) gene expression profiles to PMH302 ... 331
List of Tables
6 Four in silico scenarios generated for LSSA of DNA damage
ON/OFF in the presence / absence of p53 ... 66
6.1 Four in silico scenarios generated for LSSA of hypoxia ON/OFF in the presence / absence of p53 ... 66
6.2 List of four different scenario comparisons for in silico simulations using LSSA for DNA damage ... 67
6.3 List of four different scenario comparisons for in silico simulations using LSSA for hypoxia ... 67
6.4 Different % composition of SDS polyacrylamide gel ... 75
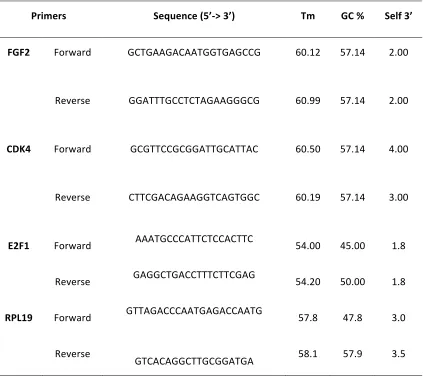
6.5 Primer sequences and results for target genes ... 78
6.6 Cycling conditions for q RT PCR using SYBR Green SensiFAST SYBR Lo-ROX kit (Bioline,UK) ... 80
6.7 Cycling conditions for q RT PCR using PrecisionPlus master mix (PrimerDesign) ... 80
7 STSFA model performance by distribution of PKT206 and HTC116 predictions for each condition ... 92
7.2 Total interaction list of all nodes in the PMH260 model ... 102
7.2.1 Nodes regulating apoptosis in the PMH260 model ... 117
7.2.2 Nodes regulating angiogenesis in the PMH260 model ... 123
7.2.3 Nodes regulating DNA repair in the PMH260 model ... 126
7.2.4 Nodes regulating cellular senescence in the PMH260 model ... ... 127
7.2.5 Nodes regulating cell cycle arrest in the PMH260 model ... 129
7.2.6 Nodes that are regulated by DNA damage in the PMH260 model ... 132
7.2.7 Global list of node state changes under LSSA in the PMH260 model in response to different DNA damage and p53 scenarios ... 138
7.2.8 Total number of all predictions from comparison of in silico data to in vitro microarray profiles ... 145
7.2.9 Global list of genes differentially expressed in untreated and etoposide treated human osteosarcoma cell lines ... 146
7.2.9.1 Alterations in the dependency matrix in response to 3 node deletions ... 161
7.2.9.2 Summary of predictions derived from application of in silico knockout tests of 3 nodes (p53, FGF2 and MDM2) to dependency matrix elements ... 163
7.3 Total interaction list of nodes and interactions considered in PMH302 ... 174
7.3.1 Nodes that regulate angiogenesis in the PMH302 model .... 196
7.3.1.1 Nodes that regulate apoptosis in the PMH302 model ... 201
7.3.1.2 Nodes that regulate DNA repair in the PMH302 model ... 209
model ... 222 7.3.1.6 Nodes that are regulated by hypoxia in the PMH302
model . ... 225 7.3.1.7 Global list of node state changes under LSSA in PMH302 in response to different DNA damage and p53 status simulations ... 230 7.3.1.8 Distribution of anti-apoptotic nodes under LSSA in the PMH302 model ... 237 7.3.1.9 Distribution of pro - apoptotic nodes under LSSA in
PMH302 ... 241 7.3.2 Distribution of anti- angiogenic nodes anti-angiogenic nodes under LSSA in PMH302 ... 248 7.3.2.1 Distribution of pro - angiogenic nodes under LSSA in
PMH302 ... 250 7.3.2.2 Distribution of nodes that negatively regulate DNA repair under LSSA in PMH302 ... 253 7.3.2.3 Distribution of nodes that positively regulate DNA repair under LSSA in PMH302 ... 254 7.3.2.4 Distribution of nodes that negatively regulate cell cycle arrest under LSSA in PMH302 ... 257 7.3.2.5 Distribution of nodes that positively regulate cell cycle arrest under LSSA in PMH302 ... 260 7.3.2.6 Nodes that negatively regulate cellular senescence in
PMH302 ... 263 7.3.2.7 Nodes that positively regulate cellular senescence in
PMH302 ... 266 7.3.2.8 Global list of node state changes under LSSA in PMH302 in response to different hypoxia and p53 status simulations ... 269 7.3.2.9 Anti - angiogenic nodes under LSSA in PMH302 hypoxia
simulations ... 277 7.3.3 Pro- angiogenic nodes under LSSA in PMH302 hypoxia
simulations ... 279 7.3.3.1 Pro apoptotic nodes under LSSA in PMH302 hypoxia
simulations ... 282 7.3.3.2 Anti -apoptotic nodes under LSSA in PMH302 hypoxia
simulations ... 287 7.3.3.3 Nodes that negatively regulate cell cycle arrest under LSSA in PMH302 hypoxia simulations ... 291 7.3.3.4 Nodes that positively regulate cell cycle arrest under LSSA in PMH302 hypoxia simulations ... 293 7.3.3.5 Nodes that negatively regulate cellular senescence under LSSA in PMH302 hypoxia simulations ... 297 7.3.3.6 Nodes that positively regulate cellular senescence under LSSA in PMH302 hypoxia simulations ... 299 7.3.3.7 Nodes that negatively regulate DNA repair under LSSA
7.3.3.9 Alterations in the dependency matrix upon node deletions 308 7.3.4 Summary of predictions derived from application of in silico KOs of 7 nodes to dependency matrix elements ... 308 7.3.4.1 Correct predictions for superimposition of U2OS (p53 +/+) gene expression profiles to in silico LSSA results of PMH302 ... 332 7.3.4.2 Total number of correct, small and large error predictions from superimposition of mesothelioma ‘omics’ data to PMH302
interactome ... 332 7.3.4.3 Global list of genes differentially expressed in human
mesothelioma cancer cell lines under the 3 comparative scenarios ... 333 List of Figures
4 Bottom-up and top- down methodologies ... 19 4.1 Different levels of complexity in System biology approaches 20 4.1.1 Simplified illustration of graph theories: Interaction and logical interaction hyper-graph ... 23 4.1.2 Functional and structural domains of p53 relating to the various anti-proliferative roles ... 32 4.1.3 p53 post translational modifications: phosphorylation,
ubiquitination and acetylation ... 33 4.1.4 A simplified model of the p53 network ... 38 4.1.5 Cell cycle phases and the corresponding CDKs and CDKIs ... 42 4.1.6 DNA damage response utilising the p53/p21/pRB/E2F
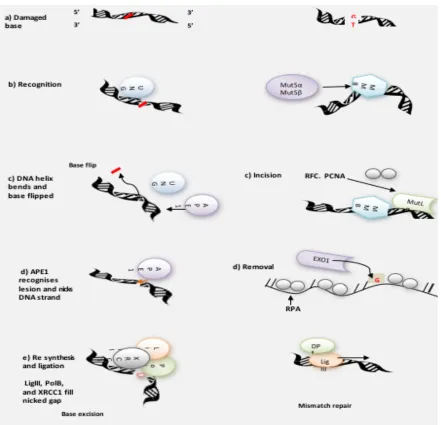
pathway. ... 44 4.1.7 A simplified view of the hypoxia induced angiogenic pathway via VEGF ... 50 4.1.8 Base excision repair – Short patch and mismatch repair
7.3.1 Total number and distribution of nodes regulating angiogenesis under LSSA in PMH302 ... 252 7.3.1.1 Total number and distribution of nodes regulating DNA repair under LSSA in PMH302 ... 256 7.3.1.2 Total number and distribution of nodes regulating cell cycle arrest under LSSA in PMH302 ... 262 7.3.1.3 Total number and distribution of nodes regulating cellular senescence under LSSA ... 269 7.3.1.4 Total number and distribution of nodes regulating
angiogenesis under LSSA in PMH302 hypoxia simulations ... 281 7.3.1.5 Total number and distribution of nodes regulating apoptosis in PMH302 hypoxia simulations under LSSA ... 290 7.3.1.6 Total number and distribution of nodes regulating cell cycle arrest under LSSA in PMH302 hypoxia simulations ... 295 7.3.1.7 Total number and distribution of nodes regulating cellular senescence under LSSA in PMH302 hypoxia simulations ... 301 7.3.1.8 Total number and distribution of nodes regulating DNA repair under LSSA in PMH302 hypoxia simulations ... 305 7.3.1.9 Connectivity degree distribution of all nodes in PMH302 .... 306 7.3.2 Percentage of correct, small and large error predictions
between in vitro and in silico data in PMH302 ... 334
List of Images
1 Acknowledgements
I dedicate this entire thesis to my beloved grandmother, Enid-Myrna, who passed away in 2015 from hepatocellular carcinoma. She gave me so much strength and love
throughout my life, and tried so hard to fight her disease to see the completion of my PhD. I miss her dearly.
I especially wish to thank my supervisor, Prof.Marija Krstic-Demonacos for both her academic and personal support, and her encouragement. Especially for her patience and understanding with my ever demanding diabetes. A very special supervisor. A special thank you to Dr Costas Demonacos, for his continual academic help and use of his facilities
Gratitude to academic peers. Dr Jean Marc Schwartz and Dr Kun Tian for their expertise and support with computational techniques, and my forever email traffic to them and, Prof. Luciano Mutti for his help and support with my research, in particular
mesothelioma.
I would also like to thank Prof Geoff Hide and Dr Stephen Heath for being special people throughout my life at the university of Salford. Who continually encouraged and believed in me throughout my studies. To my dear friends Helen Bradshaw and May Rajab, thank you for everything.
2 Abbreviations
AP1 Activator protein 1 ARF Alternate reading frame ATM Ataxia telangiectasia mutated ATR Ataxia telangiectasia RAD 3 related AURKA Aurora Kinase A
BAX BCL2 associated protein BCL2 B cell / lymphoma 2 BER Base excision repair BN Boolean network BRAC1 Breast cancer 1
CNA CellNetAnalyzer
CBP CREBB binding protein CDK4 Cyclin dependent kinase 2
CDKI Cyclin dependant kinase inhibitors CDKNA1 p21
cDNA Complementary DNA
CHEK Checkpoint kinase
CRD C-terminal regulatory domain
DBD DNA binding domain
DMSO Dimethyl Sulfoxide
DNA Deoxyribonucleic acid
DNA-PK DNA protein kinase
dsDNA Double stranded DNA
DUB De ubiquitination enzymes
DYRK Dual specificity tyrosine-phosphorylation-regulated kinase E2F E2F transcription factor
EGF Epithelial growth factor
ERRB2 V-erb-b2 erythoblastic leukaemia viral oncogene homolog 2 FAS Fas (TNF receptor superfamily, member 8)
FGF2 Fibroblast growth factor 2 G1 Gap 1
G2 Gap 2
GADD45 Growth arrest and DNA damage inducible, alpha HAUSP Herpes virus associated USP
HDM2 Human Double Minute 2
HIFI Hypoxia inducible transcription factor IGF1 Insulin like growth factor
IL-8 Interleukin 8
JNK c-Jun N-terminal kinases
KD Knockdown
KO Knockout
MAP Microtubule associated protein MAPK Mitogen activated kinase
MDM2 Murine Double Minute 2
MDMX Murine Double Minute X (4)
MMR Mismatch repair
mRNA Messenger RNA
MYC V-myc- myleocytomatosis viral oncogene homolog NCBI National center for biotechnology information NF/KB Nuclear factor kappa light
NHEJ Non homologous end joining ODE Ordinary differential equations
Otub1 Otubaine 1
P300 Protein 300
p53 Tumor protein p53
PCNA Proliferating Cell Nuclear Antigen
PIKKs phosphatidylinositol 3-kinase related kinases
Pirh2 Periperin2
PKT206 p53 interactome Kun Tian 206 Nodes
PMH260 p53 interactome Michelle Hussain 260 Nodes
PRD Proline rich domain
PNPs Potential novel predictions
PTGS2 Prostaglandin endoperoxide synthase PTM Post translational modifications PTTG1 Pituitary tumor transforming 1 q RT PCR Quantitative real time PCR
RB Retinoblastoma protein
ROS Reactive oxygen species S phase DNA synthesis
SaOS2 Human osteosarcoma cell line p53 null SDS page SDS - poly acrylamide gel electrophoresis
Ser Serine
ssDNA Single stranded DNA
STRING Search Tool for the Retrieval of Interacting Proteins
TAD Transactivation domain
TD Tetramerisation domain
TF Transcription factor
TGFB1 Transforming growth factor beta 1
Thr Threonine
TopB1 Topoisomerase binding protein
TP53 Human p53 gene
TSG Tumor supressor gene
U20S Human osteosarcoma cell line p53 wildtype USP Ubiquitin specific proteins
UV Ultraviolet radiation
3 Abstract
Cancer is a heterogeneous pathology of cell and tissue type, involving
multi-dysregulation of pathways that govern fundamental cellular processes. Chemotherapy efficacy is highly affected by these molecular deviations and the majority of patients are non-responsive. The stress responsive transcription factor, p53 is a powerful tumour suppressor implicated in over 50 % of all human cancers, and the chemo-therapeutic applications of p53 have been well described. However, the vast literature base of p53 and complexity of its interactions makes it a challenging system for
integration of this diverse information.
Computational methodologies are novel tools for integration of diverse molecular information into a coherent framework. The in silico Boolean PKT206 p53–DNA damage model has previously demonstrated good predictive capability for p53 wildtype and null tumours. Here, we have expanded PKT206 to generate a more clinically robust representation of p53-cancer dynamics. The Boolean PMH260 and PMH302 p53 models were constructed to consider 260 nodes and 980 interactions (PMH260) and 302 nodes with 1398 interactions (PMH302). Processes of angiogenesis, DNA repair and cell cycle arrest were amalgamated into both models with an additional input of hypoxia included into PMH302. For greater representation we further
constructed a logical model that was more relevant to a specific cancer and integrated 61 deregulated genes considered as important to mesothelioma (Meso-PMH61 model), and superimposed microarray data generated in our laboratory of mesothelioma cells treated with etoposide and 1 % O2 oxygen.
We analysed all models, in silico, using CellNetAnalyzer. In silico knockout analysis of various nodes mimicking in vivo mutations revealed 98 and 514 potential novel predictions (PNPs) for PMH260 and PMH302 respectively, some were validated by laboratory and literature verification. Validation of 4 PNPs were investigated in our laboratory using transient gene and protein knockdown, q-PCR and western blot analysis. Of these, 2 PNPs were in agreement with the models prediction.
were achieved than the earlier p53 logical models (PKT206 and PMH260) when using the expanded p53 interactomes (PMH302 and Meso-PMH61) resulting in 68.5 - 83 % dependant on model and simulation. We further tested the models capability to predict gene expression changes on a clinical and individual patient basis, and
superimposed patient derived in vivo transcriptome tumour profiles with a p53 mutant and wild type status. Correct predictions were again in the majority ranging between 57 - 61.5 % for NSCLC and between 56-63 % for biphasic and epithelioid mesothelioma tumours.
Gene expression analysis of individual tumour profiles identified several significantly over-represented pathways and deregulated genes common and unique contributing to these tumours, correctly predicted by the model. In particular, we highlight
pathways, MAPK, Erbb and Ca+ as contributing to non-small cell lung cancer dependant on patient. For malignant pleural mesothelioma, we highlight cell cycle and MAPK pathways and the cell cycle genes; CCNB1, CCNB2 along with KIF14, PDGFRB and SULF1. These offer potential for further investigation that could be exploited for greater therapeutic efficacy in sarcomatoid, and CYP24A1, HIPK4 and PEG3 in biphasic p53 (+/+) malignant mesothelioma tumours. Drug profile analysis of deregulated genes identified by the model highlight the need for individualised therapeutic approaches, and we offer putative combined targeted therapeutic suggestions dependant on tumour profile.
4 Introduction
4.1 Systems biology
The advent of the ‘omics’ era (genomics, proteomics, transcriptomics etc.) and high throughput methodologies has highlighted the complexity of many diseases such as cancer, and allowed for the identification of numerous deregulated genes and perturbed pathways. Despite this, the molecular heterogeneity displayed in diseases such as cancer, along with the vast literature base makes it a challenging system for integration of this diverse information into a coherent framework. This is particularly true for p53, where over 80,500 publications are linked with the keyword p53
(PubMed, May, 2016).
Systems biology may be defined as the study of complex interactions within biological systems and the emergent properties that arise from those interactions. The
developing field of systems biology in parallel with the generation of high-throughput data, computationally has heralded a new era of network analysis and medicine. Indeed, network medicine is a new term coined by many cancer researchers (Pawson et al.2008). Systems biology teamed with traditional reductionist approaches are novel, yet, promising tools to model such complexity. Indeed, this intricacy cannot be
effectively described by traditional reductionist approaches alone (Wang, 2010). Thus, transforming the traditional reductionism based methods by combining with a systems approach provides a greater unbiased opportunity to understand complex network diseases for development of effective therapeutic strategies, in particular for cancer.
4.1.1 Systems biology and cancer
Cancer involves multivariate deregulation of numerous pathways which govern fundamental cellular processes including proliferation, differentiation, migration and death (Pawson et al. 2008). As stated, these molecular deviations have been
example, identification of a specific deregulated gene maybe insufficient for a targeted treatment due to the complex signalling pathways of posttranslational and
transcriptional mechanisms (Luo et al.2009). This is further hampered by the redundancy and cross talk within multiple signalling pathways arising from
synchronous interactions of a single molecule. Moreover, pathways rarely operate in isolation. For example, one may lead into another directly by protein – protein
interactions or, indirectly via transcriptional programmes to modify others. In addition, the heterogeneity frequently observed in molecular signatures within different
tumours of the same tissue can result in varying clinical responses in different patients using the same anti-cancer treatment. This underscores the need for targeted
treatment which can address the genetic deregulations associated with a particular individual for greater therapeutic efficacy.
A systems approach provides this opportunity, to assimilate large - scale information into a coherent framework to address some of these questions. It can provide an unbiased approach to understand the initiation, progression and biological behaviour of cancer, addressing the different levels by integrative analysis.
Three key aspects of cancer research are thought to benefit from system biology approaches; discovery of drug responsive tumour biomarkers, the understanding of network focused molecular mechanisms of different stages of cancer progression, and lastly personalised targeted treatment (Wang, 2010). Indeed, many studies have started to address these using different mathematical complexities. For example, Chand et al. (2012) investigated the association between wildtype genes involved in breast carcinoma by analysing their expression patterns using microarray data and as a result designed a gene interaction map of both gene types where function and
carcinoma development (Chand et al.2012). Whilst, Faratian et al. (2009) using a kinetic model identified PTEN as a contributing factor to anti-HER2 therapy resistance. Klinger et al. (2014) constructed a kinetic model, and compared in silico to in vitro data to explore combinational therapy and found that P13K or mTOR inhibition can inhibit both AKT and ERK activity. Lastly, Tian et al. (2013) designed a predictive logical based p53 network model of DNA damage inducible pathways and identified 58 novel changes during in silico analysis of various knock out tests; this model has shown potential for targeted therapies. This particular study is discussed in section 4.1.2.7.
4.1.2 Computational techniques
4.1.2.1 Text mining approaches for protein – protein interaction analysis
For construction of cancer networks, systematic integration of biological information from literature is fundamental to establish a robust model. This is particularly true for p53 where the literature base is extensive. A text mining approach is less exhaustive. It allows the user to extract large data via automated information retrieval and thus less time consuming. To date, various text mining approaches and tools exist for
information retrieval. Text mining may be applied to system biology networks by searching for genes / proteins and the parameters that define their interactions. Parsing (dividing words for identification of each component, i.e. verb, adjective, or noun) techniques are a prerequisite for describing more than one biological
types of such as inhibition, activation or enhance between proteins and genes based upon ontology. Others include, PESCADOR (Platform for Exploration of Significant Concepts Associated to Co- occurrence Relationships) which extracts interactions from PUBMED abstracts and can be used to build pathways upon existing knowledge. KEGG is another commonly used database which uses PUBMED and MEDLINE. KEGG provides over-represented pathway maps that investigate particular networks or interactions, and similar to PESCADOR is useful for building upon existing knowledge. Whilst
informative, these databases are limited in information, and confidence scores are not assigned to interactions which may allow the user to extract significant data.
Furthermore, the information is not as regularly updated or as extensive as that of STRING database, described hereafter.
4.1.2.2 STRING database
A prerequisite for a systems level understanding of signalling pathways is to dissect and annotate functional interactions within the system. The extensive and continual
research of protein function and interactions make it less amenable to collect the diverse information using literature search only. Text mining approaches offer the potential to extract this information based upon previous literature in an automated manner.
protein interaction maps are user friendly and include interactions of activating or inhibiting. Whilst, the nature of the interaction is also considered such as:
post-translational modifications, binding, or expression. It also considers partner sites such as Cytoscape software where STRING data may be imported. Importantly, STRING is updated on a regular basis, every 6-12 months, thus allowing retrieval of novel information outdating those previous (Jenson et al.2009; Szklarcyzk et al.2011).
4.1.2.3 Cytoscape software
Cytoscape is an open source software platform. It allows for integrative analysis and visualisation of molecular interaction networks and biological pathways by
amalgamation of large information that can be represented into a coherent framework (Shannon et al.2003). Cytoscape software allows the user to link to several databases of functional annotations, for example STRING and KEGG. Cytoscape functional analysis is provided by various plugins for version 2.9 and lower, nomenclature however has changed to ‘apps’ for versions of 3.0 or higher. These are publicly available allowing the user to perform network analyses and visualisation of pathways. Moreover, any user may develop these ‘apps’ and as such the Cytoscape app community is continually increasing allowing for greater analysis power and network choice. Similar to STRING, Cytoscape is capable of the construction of molecular networks through these apps, for example via the Agilentsearchliterature app. However, networks retrieved are limited in size and literature evidence is not available or updated on a regular basis. Thus, Cytoscape is more apt for input of new networks from independent manual construction for functional analysis.
Unlike CellNetAnalyzer, Cytoscape is an independent platform and as such is capable of handling large datasets including high throughput expression profiles. With the
transcriptome data of ChiPSeq and microarray profiles to accurately predict multiple in silico gene knockouts (Isik et al.2012). Indeed, Cytoscape is considered most powerful when used in conjunction with large datasets (Shannon et al.2003).
4.1.2.4 System biology approaches
The metabolic nature of cellular pathways may be approached in either a bottom up or top down directionality as depicted in a simplified diagram (figure 4). The latter
approach constitutes data processing from ‘omics’ levels to pathways and individual gene levels, whilst bottom up encompasses automated tools and mathematical modelling (Shahzad and Loor, 2012). Both directionalities encompass different steps for experimental hypotheses and required outcome. Different levels of complexity are later addressed by mathematical modelling dependant on analysis required which may be quantitative or qualitative, simple or complex (figure 4.1).
4.1.2.4.1 Top down approach
The top down approach originates from experimental data, to identify and describe the ‘bottom’ biological interactions by network construction, via the flow of information occurring from the ‘omics’ level. This directionality can help to dissect interactions using the ‘omics’ data extracted from top down methodologies of high throughput experiments (Bruggeman, 2006). Top down aims to identify new molecular
mechanisms of interactions recursively from initial experimental data of several
Figure 4 Bottom-up and top- down methodologies
Bottom up approaches begin with detailed knowledge about individual components and assemble these into larger elements, such as pathways and networks for behaviour. Top-down approaches start from typically large data sets which represents ‘omics’ of a biological system aiming to identify those components that are most responsible for the systems behaviour such as phenotype.
4.1.2.4.2 Bottom up approach
The bottom up approach is aimed at constructing detailed models which may be replicated under various physiological conditions. It combines all molecular specific information into a genome scale model providing an integrative in silico view of biological interactions within living systems and based upon constraint based modelling. In contrast to a top down approach the bottom-up directionality builds upon pre-existing data for analysis of their systemic consequences for the cell (Westerhoff and Palsson, 2004) and utilises experimental data of steady state and transient metabolite and flux data. Experiments are on the basis of detailed networks for subsequent validation and improvement of the model to investigate the hypothesis generated by in silico model analysis. After full characterisation of the network, top down approaches may also be combined with bottom down systems biology at later experimental stages. The two combined may provide a strong framework for dissecting cellular molecular interactions (Bruggeman, 2006).
Bo
tt
om
u
p
ap
pr
oa
ch
Top d
ow
n a
pp
ro
ac
h
System (Cell, tissue etc.) Pathways/Network (Interactions) Model complexity
(Stoichiometric, regulatory, Kinetic)
Figure 4.1 Different levels of complexity in System biology approaches
The two system approaches of top down and bottom up. b) Complexity of mathematical methods of regression analysis being the simplest approach for correlation identification. ODE models may be utilised to describe kinetic mechanisms, whilst Boolean models are more simplistic. Redrawn from (Bachmann et al.2011)
4.1.2.5 Mathematical modelling
The most commonly applied mathematical equations for signalling pathways are ordinary differential equations (ODEs), and Boolean mathematical modelling. Applications of continuous and discrete models are dependent upon the desired output. Kinetic modelling is more suitable for quantitative modelling, i.e. investigating the treatment efficacy of cancer models. For instance, Mamat et al. (2013) used ODE modelling with in silico simulations to investigate the effects of IL-2 (Interleukin -2) and INF-α (Interferon- α) on tumour cell dynamics under the influence of chemotherapy, immunotherapy and bio- chemotherapy in ten patients. The study concluded that these treatments played pivotal roles in remission and death of tumour cells. In contrast, Boolean models are more sufficient for measuring qualitative aspects of biological phenomena for example, steady state protein / gene activity and knock down or knock in effects (Bachmann et al.2011)
4.1.2.5.1 Ordinary differential equations
Ordinary differential equations (ODEs) have been extensively used to model molecular signalling pathways and considered the most natural equation for translation of detailed reaction networks into a model. Constructions of ODEs are dependent upon a single variable, such as time. Their networks represent reaction rates of a particular
b)
Top down Large scale high – throughput data Low mechanistic insight Qualitative Static
Bottom up Small scale high – throughput data High mechanistic insight Quantitative Dynamic
Mechanisms Temporal order /quantitative Correlation
Regression Boolean ODEs
species such as degradation, production and association in terms of mass action kinetics where the rates are proportional to the reactant concentrations (Bachmann, 2011). ODE networks however have limitations. For example, a large number of parameters are required. Further drawbacks are network sizes, ODE models may only describe a few nodes, whilst Boolean models may constitute hundreds (Mai and Liu, 2009).
4.1.2.5.2 Boolean modelling
Boolean modelling is another commonly used approach for construction of signalling pathways. Boolean models were first described by Kaufmann, (1969) as models of genetic regulatory networks. These logical networks are simplistic, yet effective in capturing the dynamics of gene / protein signal flow networks. For example, described by binary states of ON or OFF, they can effectively recapitulate signalling events, referring to a gene transcribed (ON) or non-transcribed (OFF), a protein activated (ON) or inhibited (OFF).
Boolean logic has been applied successfully to model various complex biological phenomena (Shmulevich and Kauffmann,2004). Boolean models are represented by directed graphs where nodes represent genes or proteins and edges or hyper-edges represent the interactions between them. Boolean logic states that a node is capable of only discrete expression values contrasting the continuous value ranges in kinetic models such as ODEs. A logical rule linking the inputs is assigned to each node and as such no real parameter values are needed to be adjusted apart from the applicable logical Boolean rules that describe the system. Each node according to Boolean logic is parameterized by binary interactions, 1 or 0 operators referring to activation or no activation. Nodes are assigned two separate states of ON or OFF; where at each time point the state of a particular node is determined by the state of another node typically upstream by transfer of Boolean logical function.
lateral relationships and thus graph choice must represent such reactions. Directed logical hypergraphs consider and facilitate these multiple reactions. Furthermore, biological cancer networks frequently undergo feedback loops of both positive and negative nature. Whilst interaction graphs may represent such processes they cannot incorporate Boolean logic of OR, NOT, AND operators (Klamt, 2006). For these
synchronous connections, Boolean logic must be considered to represent a truer state of signalling pathways and as such depict a greater representation of cellular networks whilst also providing confident in silico prediction. The AND, OR, NOT relationships are thus best represented by hyper-graphs where directed hyper-arcs connect more than one node (Klamt, 2006; 2011). In contrast, multi-lateral signalling is not possible using interaction graphs where only the two states exist and separate arcs of positive
pathways influencing target node fail to truly represent the relationship between three species. Figure 4.1.1 summarises differences between both graph theories.
In addition to the logical model constructed by Tian et al. (2013) discussed above, Boolean modelling has been utilised in several cancer studies. For example, a Boolean system was constructed of 96 nodes of known cancer causing genes with 249 edges and five input nodes of cellular stresses. (Fumia and Martins, 2013). The study identified 62 attractors with distinct cellular cancer phenotypes in response to upstream inputs. In silico mutations were introduced into the network and, ten proteins were identified as having the capability to transform into malignant
Figure 4.1.1 Simplified illustration of graph theories: Interaction and logical interaction hyper-graph. a) Interaction graph the reaction comprises two separate arcs of A and B both having an effect on AB of positive paths leading to D-E. The two positive paths of, both A and B (AB) are required for activation of D, however removal of one species for example, A is
sufficient to disrupt activation of D. Thus, a signalling path in an interaction graph will not ensure a signal may flow via this path. In contrast, b) Interaction Hyper-graph depicts the example as a logical interaction hypergraph in which a hyperarc connects A and B by capturing the AND-connection between both species. (Redrawn from Klamt, 2009).
4.1.2.6 CellNetAnalyzer
CellNetAnalyzer (CNA) is an independent graphical user interface for Matrix laboratory (MATLAB) (discussed in section 6), that provides structural and functional analysis of various cellular networks (Klamt, 2006). CNA has been designed with MATLAB nomenclature enabling the user to incorporate MATLAB algorithms. In particular, for analysis of in silico signalling networks, using distance and dependency matrix
formalisms such as dependency relationships, and node state changes in the network arising from input perturbations using logical steady state analysis.
CNA provides a comprehensive independent platform for complex structural,
functional and qualitative analysis of biochemical, metabolic, signalling and regulatory networks (Klamt, 2006). Network projects constructed by CNA may be represented and analysed with either mass flow (stochichometric/metabolic) or signal flow
(signal/regulatory). Nomenclature used for network descriptive in both network examples requires declaration of both species and reactions.
A B A B
a) b)
AB
D
AB
D +
+
+ + +
+
For example, using mass flow networks reactions correspond to stoichiometric reaction equation where:
A + B -> C
This equation states that two reactants (A and B) are converted into C, with A and B totally consumed in the process. In contrast signal flow networks are represented by logical Boolean operators of true or false expressed by the equation:
A -> B = C
Where the product (end node) is activated by the reactant (start node), for example C is activated if A and B are active. However, A and B is not consumed during the process. For example, C may be activated, if A and B are in an active state.
In both networks, declaration of species and reactions are required with their
corresponding attributes. Declaration of nomenclature in both is equal however both have different interpretations. For example, and as described above, in mass flow networks reactions are defined by stoichiometric conversions, referring to products consumed in a single reaction. In contrast, signal flow considers Boolean logic of AND, OR and NOT operators and defines interactions by the end node (product) being activated by start node (reactants). These signal flow networks can be represented by either interaction graphs or hyper- graphs as previously discussed (figure 4.1.1).
For any biological process, feedback loops and crosstalk are frequent and important events in cellular signalling pathways. CNA considers such reactions which are
Furthermore, positive or negative feedback loops are considered within the matrix.. These are described in section 6, material and methods.
Logical steady state analysis is a good method for predictive behaviour of the input – output dynamics of signalling networks (Klamt et al.2007). The steady state between node pairs can be analysed in CNA via logical steady state analysis, where the state of each node is consistent with its Boolean function and as such once a node has
progressed into a logical steady state it will remain. In this logical steady state and in accordance with Klamt et al. (2006), each node can have three different states of; 0, inactivated, 1, activated and NaN, undetermined. Exclusion of node (s) and its
interaction (s) from a network allow for analysis of the interactome in response to their absence. These in silico knock outs can represent biological phenomena of in vivo mutations in diseased states such as cancer.
CNA has been utilized in several studies using Boolean logic. For example, a dynamic model was constructed to analyse p53 and NF-kB pathways in response to DNA damage. This study undertook in silico knock out tests for prediction of novel gene function. Dependency matrices were also constructed to identify potential cancer therapy targets (Plotz and Naumann, 2012). Whilst another more recent study
constructed a p53 predictive interactome defined as PKT206 and analysed its response to DNA damage inducible pathways via in silico knock out tests (Tian et al.2013). As PKT206 is a continuum of this study, a brief introduction is necessitated, discussed in the next section.
4.1.2.7 The PKT206 Model
nodes connected with p53 as the network hub. Nodes represent genes or proteins with edges representing the inhibiting or activating interactions between them.
Analysis of the network by CNA identified thirty feedback loops, of which fourteen involved p53, the majority significant to p53 regulation such as MDM2 and MDM4. Logical dependency relationships between nodes were calculated where 23,191 nodes were found to have no effect, 16,425 ambivalent factors, 1100, weak inhibitors, 1240, weak activators, 20, strong inhibitors and 49 being strong activators. Various in silico p53 knock outs were constructed to investigate and predict the role of p53 and the response of the network upon node deletion. Of these 11, 753 nodes changed after p53 node deletion from the original 41,616 p53 interactome. The majority of changed nodes were ambivalent factors arising from feedback loops within the system also highlighting p53 regulatory role within the in silico network coinciding with known in vivo p53 effects. 11 of 30 in silico node deletions demonstrated major dependency changes to wildtype matrix proceeding removal of a specific node. 58 possible
predictions of change were obtained from the 11 initial in silico knock out tests and, of which 4 were validated via literature searches and 2 via laboratory validation.
Microarray analysis of human osteosarcoma and colon cancer cell lines of p53 null and wild type treated with etoposide induced DNA damage has highlighted the models predictive capability. Up to 75 % of predictions were considered as true when
compared to LSS in silico results. This highlights the prospective of employing PKT206 in a clinical setting as one future direction in cancer. However, limitations to this is
network size, in particular for p53 where a plethora of responsive genes have been described (Riley et al. 2008). ‘Omics’ data is high throughput and as such model size is of importance for superimposition of expression profiles for greater biological
4.1.3 Cancer
Cancer is the result of abnormal cell growth due to gene expression changes resulting in dysregulated cell proliferation. Tumours are the outcome of a process of clonal selection whereby multiple alterations for example, oncogene activation or the loss of tumour suppressors, provide a selective advantage to the cells that carry them. This can ultimately progress into a more invasive cell population which may metastasise into adjacent and distant sites (Ruddon, 2007).
Cancer has been described as one of the main causes of deaths worldwide. The most recent statistics of all cancer incidences in the UK was more than 324,500 in 2011, with a mortality rate of 7.6 million cancer combined deaths globally (Cancer Research UK). Various chemotherapies are employed for treatment with efficacy reported as 25 % by Glaxo Smith Kline. In addition, chemo-resistance is frequent problem, and different molecular signatures exist dependant on the individual. Thus more effective anti-cancer strategies are necessitated, in particular focusing upon the molecular deviations that govern a particular tumour.
The biological features of cancer progression to tumour formation has been coined by Hanahan et al. (2000) of six tumour phenotypes required for full malignancy; self-sufficiency of growth signals in oncogenes, insensitivity to anti-growth signals, evasion of apoptosis, sustained angiogenesis, limitless replicative potential and lastly tissue evasion and metastasis. Two further emerging phenotypes have recently been described; deregulated cellular epigenetics of reprogrammed cellular energy metabolism and immunological evasion (Hanahan and Weinberg, 2011).
mutated in over half of all human cancers. More than 26,000 mutations of p53 are recorded within the International agency for cancer research (Suzuki and Matsubara, 2011). In this form, loss of function results in failure of p53 tumour suppressive activities. Indeed, p53 is considered pivotal to tumour development and as such has been the focus of extensive research for its role in both cancer development and therapeutic strategies, in particular for reactivation of its regulatory pathways (Lane, 2010).
4.1.3.1 p53 overview
The p53 protein was first described in (1979) by Levine et al. as an oncogene which accrued within cancerous cells nuclei. Later studies on wildtype p53 however
confirmed its definitive function as a tumour suppressor, and transcription factor with a crucial role in cancer, maintaining genomic integrity and as such is termed as ‘the guardian of the genome’ (Levine, 1997). Since then the complexity of p53 within its intricate network has unravelled with over 85,000 publications to date (May, 2016), linked with the keyword p53 pathways and more than several hundred p53 responsive genes described (Riley et al.2008). The significance of p53 as a tumour suppressor is highlighted by the fact that over 50 % of human cancers comprise p53 gene mutations or defects within p53 regulatory pathway.
p53 protein is a stress responsive transcription factor, stabilised and activated in response to cellular stresses of a genotoxic and non-genotoxic nature including; DNA damage, hypoxia, nutrient deprivation and oncogenic activation (Levine, 2009). Once activated, p53 initiates a transcriptional program via a complex network of multiple signalling layers to promote cellular homeostasis and genomic integrity. This may result in several biological outcomes dependant on stress type, severity and cellular / tissue context that include cellular senescence, apoptosis, cell cycle arrest, and angiogenesis (Anderson and Appella, 2009).
The vast amount of literature on p53 and interacting proteins has made it less
4.1.3.2 The tumour suppressor p53 – role in cancer
p53 is a powerful tumour suppressor protein, with various anti-proliferative roles in response to aberrant cellular stresses (Anderson and Appella, 2001). p53 displays all the characteristics of a tumour suppressor gene (TSG):
i. TSGs are recessive and undergo biallellic inactivation in tumours (loss of both alleles) (although p53 is considered a recessive TSG, several studies have shown a profound effect from loss of one allele or inactivation via a single mutation ii. Inheritance of a single mutant allele accelerates tumour susceptibility formation iii. The same gene is frequently inactivated in sporadic cancers
iv. It has a powerful anti-proliferative role
Under homeostatic conditions, a latent form of p53 exists at low concentrations. However, in response to stresses such as DNA damage, increased p53 levels result in its stabilisation from attenuation of its negative regulator E3 ligase Murine double minute 2 (MDM2) or HDM2 in human. Consequently, p53 initiates an anti-proliferative
program transcriptionally activating or repressing target genes. Abrogation of this pathway or its components, specifically p53 has been shown to contribute to tumour formation and cancer (Vousden and Lane, 2007).
The fundamental role of p53 and its network is highlighted by the rare familial Li-Fraumeni syndrome, a dominant inherited disease arising from germline mutations where individuals are predisposed with premature onset to leukaemia, breast cancer and osteosarcomas arising from abrogation of apoptotic and senescence programs by DNA damage checkpoint defects (Malkin et al. 1990). p53 mutations or inactivation are present in over half of all human cancers, with the non-mutated allele typically lost. Indeed, p53 gene null mice are tumour prone and susceptible to neoplastic disease (Reinhart et al.2012).
bladder, lung, liver, breast, colon and more. Mutations are largely missense (80%), with aberrant modifications imposing several diverse effects on gene activity dependant on locality. For example, mutations within the promoter region may result in cellular p53 decrease or absence, whilst those within the protein coding region may impact gene expression or protein activity. Furthermore, a mutation type may dictate different elements of p53 signalling pathways. For example, some p53 mediated responses may be lost, whilst other p53 mutations may confer gain of wild type function directly enhancing cancer progression, and include interactions with related p63/p73 (Goh et al. 2012). Lastly, mutated components of the pathway may directly affect p53 activity such as mutated ATM, which causes ataxia telangiectasia (Malkin et al. 1990). This highlights not only the importance of p53 in cancer, but that a fully functional and regulated level of p53 is fundamental to maintain a tightly co-ordinated network and response for genomic integrity.
Recent studies have highlighted the importance of p53 in other pathologies including longevity, diabetes mellitus and myocardial infarction (Reinhardt et al.2012). Taken together, these studies demonstrate the comprehensive role of p53 in numerous processes including cancer and inflammation.
4.1.3.3 TP53 gene and structure
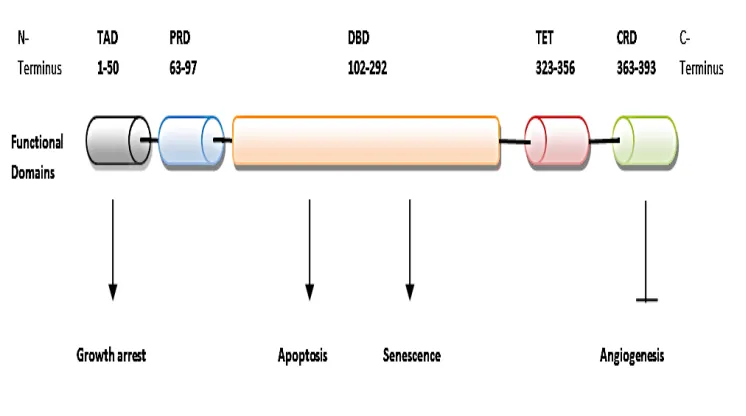
p53 is a nuclear protein encoded by a 20kb gene, comprising 11 exons and 10 introns located on the short arm of chromosome 17. p.13. Wild type p53 contains 393 amino acids composed of several structural and five functional domains crucial for mediating interactions (figure 4.1.2). The N- terminal domain (1-43) constitutes two adjacent transactivation domains; TAD1 and TAD2 where the majority of phosphorylation occurs. This is typically in response to DNA damage. TAD2 overlaps the proline rich region (63-97) with important roles in apoptosis, transcriptional activation and
repression (Lin et al. 1994) and p53 activation as shown proceeding gamma irradiation (Campbell et al. 2013). Redundancy is observed at the N- terminus, where a single site may be phosphorylated by several kinases, conversely a single kinase may
factor, regulating expression of target genes. The majority of human mutations (90%) occur within the DBD corresponding to highly conserved II – V regions. These result in loss of wildtype function and thus the inability to bind to the consensus sequences within promoters of p53 responsive genes (Sigal and Rotter, 2000). The C- terminal region (323-393) constitutes the tetramerisation domain (TD) and C-terminal
regulatory region (CRD). Here sequences are involved in nuclear localisation, regulation and tetramerisation. The formation of p53 tetramer is pivotal to p53 dependant trans-activation and suppression (Kruse, 2009). This regulatory region comprises a non-specific DNA binding domain that binds to damaged DNA and, undergoes several post translational modifications crucial to p53 activity and control (Loughery and Meek, 2013).
4.1.3.4 Regulation and control of the stress responsive transcription factor p53 The tumour suppressor p53 is a stress responsive transcription factor, mediating the expression of a plethora of target genes via interactions with numerous co-factors. As such, p53 activity must be tightly regulated and maintained at steady state levels. Adverse effects of decreased or increased p53 activity have been demonstrated in various mouse models of altered p53 levels using gene manipulation studies (Tyner et al. 2002: Dumble et al. 2007). p53 null mice were largely tumour prone, in contrast p53 ⁺/⁺ mice were less tumour susceptible, yet displayed other pathologies that were age related.
In its latent state the half-life of p53 is limited to minutes and its function repressed by MDM2 (Kruse and Gu, 2009). In response to stress, the attenuated p53 – MDM2
Figure 4.1.2 Functional and structural domains of p53 relating to the various anti-
proliferative roles. Functional domains: comprising transactivation and proline rich domain within the N-terminus, the core DNA binding domain and the C –terminus of tetrmerisation and regulatory regions. These correspond to highly conserved domains of I, II – V respectively and highlighted by the same colour. Once activated p53 exerts its anti proliferative function by growth arrest, apoptosis, cellular senescene and angiogenisis inhibition with the functional p53 domains responsible indictated by arrows. TAD, transactivation domain, PRD, proline rich domain, DBD, DNA binding domain, TET, tetramesaristion domain and CRD, C terminal regulatory domain.
4.1.3.5 Post translational modifications of p53
4.1.3.5.1 Phosphorylation
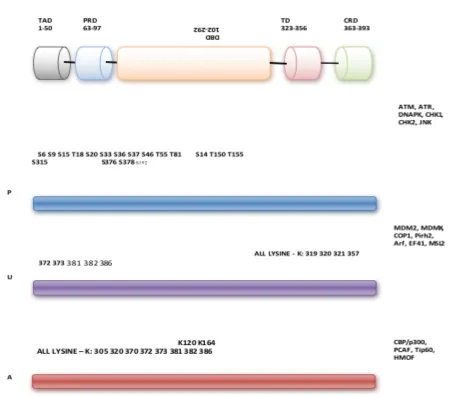
conformational. The organisation of kinases in response to a particular signal induces phosphorylation cascades. This reaction is reversible via de-phosphorylation catalysed by phosphatases allowing the protein to conform back to its original structure upon phosphate removal. Conformational modifications can induce subtle activity changes to the protein with phosphorylation typically activating. Phosphorylation events are catalysed by kinases where hydroxyl groups (-OH) of serine, threonine, tyrosine amino acid side chains the most important.TP53 has 23 different phosphorylation and de- phosphorylation sites typically within N and C-terminal regions. Following DNA damage p53 is phosphorylated by a plethora of kinases resulting in its stabilisation. Numerous kinases involved in phosphorylation have been described, some highlighted in figure 4.1.3.
Specific PTMs are shown corresponding to p53 domains of TAD, transactivation domain, PRD, proline rich domain, DNA binding domain, TD, transactivation domain and CRD, C terminus regulatory domain. Modifying PTM enzymes are shown on the right, but not limited too. Compare this figure with figure 4.1.2 for anti-proliferative programs corresponding to functional domains. For example, Ser46 in DB is crucial for apoptosis induction. P –
phosphorylation, U – ubiquitination and A representing acetylation.
Typically induced by DNA damage, phosphorylation of p53 is crucial for protein – protein interactions and potentially regulates target gene selectivity. For example, phosphorylation by Chk1 and Chk2 at Ser20, ATR and ATM on Ser15, and Thr32 by JNK (c-Jun N-terminal) kinases in response to DNA damage is crucial for disrupting and reducing the affinity of p53-MDM2 interaction, enabling a tighter association with co factors and nuclear accumulation (Buschmann et al. 2001: Anderson and Appella, 2001). Other phosphorylation events resulting in attenuation of p53 – MDM2
interaction are highlighted in figure 4.1. 4. For example, p16/ARF induced oncogenic stress inhibits MDM2. Indeed, the importance of phosphorylation on these sites for apoptosis has been demonstrated. Transgenic mice expressing mutated Ser 15 and Ser20 residues displayed decreased p53 stability and an abrogated apoptotic response (Chao et al. 2006). Whilst Ser46 phosphorylation by DYRK2 (Dual specificity
tyrosine-phosphorylation-regulated kinase) is pivotal for the induction of pro-apoptotic gene p53AIP1 and p53 dependent apoptosis evidenced by p53 knock in mouse (Tiara et al. 2007).
4.1.3.5.2 Acetylation
Acetylation refers to the addition of an acetyl group (CH3CO). Similar to
phosphorylation, acetylation is a reversible process via the action of HDACs (histone deacetylases). HATs are a well characterised acetyltransferase group (Histone acetyltransferases) due to their histone targets. HATs transfer an acetyl group from acetyl CoA to the terminal amino side chain of lysines (Legube and Trouche, 2003). Similar to phosphates, the addition and conversion of the +ve charged lysine to acetyl – lysine results in modification of protein conformation and trans-activities. For instance, histone acetylation typically results in the recruitment of co-factors, regulates
role in cellular fate. HATs in addition to histone chromatin opening also target transcription factors such as p53 to modulate their transcriptional activity.
Acetylation is thus an important protein modification which correlates with increased p53 transcriptional activity (Kouzarides, 2000). The importance of p53 acetylation is three-fold: 1) promoting p53 stabilisation by eliminating ubiquitination on the same site, 2) it attenuates MDM2/MDMX complex on target gene promoters and lastly, 3) recruits co-factors for activation of p53 transcriptional activity.
Various studies have reported how DNA damage pathways activate p53 acetylation via acetyltransferases, or induce them via p53 phosphorylation. The C – terminus
comprises six lysines that are targeted for acetylation by HATs and p53 transcriptional co factors. For example, p300 and CBP which include lysine sites: K305, K370, K372, K381, K382 and K386 (Meek and Anderson, 2009). MDM2 also targets the same C – terminal sites for ubiquitination. Therefore, a key function of acetylation is inhibition of ubiquitination and p53 downregulation (Li et al.2002). Acetylation also opposes MDMX and MDM2 recruitment, attenuating MDM2/MDMX – p53 complexes, resulting in transcriptional activation (Li et al. 2002). Acetylation of K320 in the TET domain by PCAF promotes activation of p53 responsive cell cycle arrest genes (figure 4.1.3) thus favouring cell survival over apoptosis (Knights et al.2006). In parallel, another study using mice expressing p53 (317 residue) lysine – arginine substitution (K320 in human) exhibited enhanced p53 dependant apoptosis following DNA damage (Chao et al. 2006). Furthermore, human cell lines expressing lysine – arginine substitution failed to induce apoptosis and cell cycle arrest by non-expression of pro apoptotic genes, yet retained the ability to mediate MDM2 expression (Tang et al.2008). This study concludes that non- acetylated p53 is able to sustain a negative feedback loop, however acetylation is a prerequisite for p53 function. Collectively, these studies indicate that acetylation is important PTM for p53 activities.
4.1.3.5.3 Ubiquitination
This requires interactions of three enzymes: E1 ubiquitin activating, E2 ubiquitin conjugating and E3 ubiquitin ligating enzyme. TP53 comprises 20 lysine sites clustered around three locations: one within TAD, five at the N- terminus within the DBD, the remainder located within C - terminus. Ubiquitination is pivotal to p53 stabilization, activation and localization. One of the most important ubiquitination events of protein – protein interactions is the p53-MDM2 affiliation which lies at the core of the p53 network.
4.1.3.6 The p53-MDM2-MDMX relationship
As previously described, p53 expression must be tightly regulated and maintained at steady state levels for genomic integrity. Perturbation of this system may result in aberrant proliferation and malignant cellular phenotypes. This regulation is maintained through p53’s primary negative regulator, oncoprotein RING finger type E3 ligase MDM2, and to a lesser extent, MDMX (MDM4).
p53 is maintained at low cellular concentrations through MDM2 26S mediated proteasome degradation and ubiquitination (Ringshausen et al.2006). This occurs on several lysine residues within p53 C-terminus as demonstrated in vivo; K101, K120, K132, K139, K370, K372, K373, K381, K382, and K386 (Feng et al. 2005) (figure 4.1.3). Mono and poly ubiquitination adds complexity to p53 regulation involving other key players. High levels of MDM2 induce p53 poly - ubiquitination, leading to degradation, with co factors E4 ligases CBP/p300 mediating this process. Lower levels induce mono- ubiquitination leading to p53 nuclear exportation and cytoplasmic translocation (Li et al. 2003). Mono-ubiquitination typically occurs on several lysine residues in the C- terminus as above. However, a recent study using spectrometry analysis has identified the central p53 domain as the dominant acceptor sites for MDM2 and E3 ligase PirH2 (Shloush et al.2012).
has been demonstrated in early studies of MDM2 null mice which displayed embryonic lethality arising from over expressed p53, rescued only by simultaneous deletion of p53 (Montes et al.1995). Furthermore, dysfunction of this loop results in tumour prone cells. For example, mice over expressing MDM2 inhibit p53 function promoting tumorigenesis (Montes et al. 1995). Taken together these studies indicate MDM2 as p53’s primary negative regulator.
Another important negative regulator, non E3 ligase MDMX, a MDM2 homolog, also binds to p53 trans-activation domain inhibiting p53 stabilisation and transcriptional activity, however with less efficiency than MDM2. MDMX contains a RING domain structurally similar to MDM2, however does not possess E3 activity (Jackson et al.2000; Stad et al.2001). Even so, MDMX has been shown to be as fundamentally important for p53 regulation. Similar to MDM2, loss of MDMX in mice models results in embryonic lethality and rescued only by p53 gene deletion (Zhang et al.2014). This feedback loop is therefore a key signalling pathway within the p53 network. The above summarises a modest version of p53-MDM2 relationship. Indeed, this core loop is embedded within an intricate network of p53 responsive genes which converge onto the p53 /
MDM2/MDMX axis providing additional layers of complexity and regulation to the p53-MDM2 pathway and network.
4.1.3.7 The p53 network
4.1.3.7.1 Upstream events
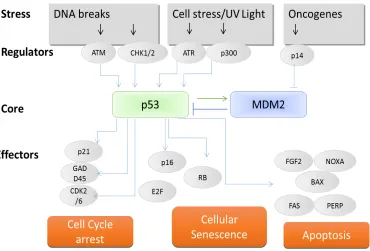
[image:39.595.96.466.364.615.2]p53 activation typically manifests in three distinct steps; stabilisation, sequence specific DNA binding and transcriptional activation or repression of target genes in response to genotoxic and non-genotoxic stresses that include; ultraviolet, ionising radiation or oncogenic stress and hypoxia respectively. Activation and induction of p53 are important steps for initiating the anti-proliferative program, however many questions remain unanswered regarding pathways and upstream signals that initiate p53 activity, highlighting the complexity of the network (Loughery and Meek, 2013). Whilst both genotoxic and non-genotoxic stresses are important processes for tumorigenesis, this report focuses upon upstream genotoxic stresses of DNA damage only.
Figure 4.1.4 A simplified model of the p53 network
4.1.3.7.2 DNA damage
The integrity and fidelity of DNA is crucial for accurate hereditary genetic replication. DNA is continually exposed to endogenous and exogenous stresses including reactive oxygen species arising from metabolic processes, ionising radiation, ultraviolet lights, and chemicals respectively. A tightly controlled and competent DNA damage response arising from DNA lesions and chromosomal damage is pivotal, allowing for DNA repair, genomic integrity and thus inhibition of tumorigenesis
Dependant on DNA damage type and severity, p53 regulatory pathways may initiate cell cycle arrest or apoptosis for repair or cell death respectively. For example,
moderate DNA damage induces a slight increase in p53 levels resulting in transient cell cycle arrest, whilst severe and irreparable damage results in highly increased p53 levels and apoptosis (Vousden and Liu, 2003). Severe DNA damage such as in transcription-coupled repair defects appears to display constitutive DNA damage signalling, however a loss of DNA damage downstream effectors appears to display a tumour susceptible phenotype. Indeed, p53 gene null mice are tumour prone and susceptible to neoplastic disease (Jacks et al.1994). The severity of DNA damage also impacts p53 dynamics of a bimodal switch function in U20S and A549 etoposide treated cell lines in a dose dependant manner which shifted cell profile fate. Mild DNA damage induced at lower etoposide concentrations resulted in periodic oscillations of p53 activity and cell cycle arrest, whereas, at higher levels of etoposide (100 μmol/l) strong monotonic increases of p53 where observed with a cell profile shift to apoptosis. Moreover, this DNA damage dose dependant bimodal switch was induced by differential MDM2
upregulation with higher levels allowing continuous accumulation of p53, conversely, lower levels dictated cellular fate (Chen et al.2013). Indeed, this coincides with p53 activity, for example prolonged p53 stabilisation leads to expression of pro apoptotic genes (Jackson and Bartek, 2009).
4.1.3.7.3 Hypoxia
including those of pulmonary, cardiovascular and inflammatory origin (Airley et al.2000).
Hypoxia is a characteristic state in solid tumours (Vaupel and Mayer, 2007) arising from the oxygen deprivation in the tumour microenvironment, and, along with ischemia initiates the various processes associated with tumour angiogenesis (Ching et al.2010). Tumour hypoxia can be defined dependant on severity typically being a reduction of oxygen consisting of less than 10 – 15 mm Hg partial pressure of internal oxygen (pO2) or, severe hypoxia pO2 <0.33%, 2.5 mmHg (Khan et al. 2012).
Hypoxia is associated with tumour aggressiveness, progression and a poor patient survival rate (Chang et al.2011). Low oxygen levels in tumour cells reduce the efficacy of anti-cancer treatments resulting in a resistant tumour. This is largely due to the fact that specific anti-cancer drugs or ionising radiation require oxygen free radicals to effectively destroy cells. Additional drug resistance arises from the low oxygen levels that reduce cell proliferation and enhance growth arrest. This is problematic as anti-cancer drugs typically target high proliferating cells. Moreover, the reduced oxygen level results in ineffective drug delivery to the intended hypoxic region. Thus,
elucidating the molecular mechanisms of hypoxic regulation is of central importance to effective cancer strategies.
The biological and molecular signatures of hypoxic tumours to normal tissues are distinct. The insufficient vasculature in a solid tumour mass results in a heterogeneous, dynamic micro - environment of perturbed molecular signatures, promoting genomic instability via point mutations, gene amplification or inhibition, and chromosomal rearrangements and low pH and glucose concentrations.