Experimental analysis and optimization of variable parameter of solar
air heater by using of extended surface on absorber plates
Sandipkumar Vasantlal Thakkar
1, Mandhata Yadav
2, Kiran Dahyanbhai Parmar
31 Student MED, Hansaba College of Engineering & Technology Mehsan, Gujarat, India 2 Assistant Professor, MED SPIT Mehsasna, Gujarat, India
3 Assistant Professor, MED, Hansaba College of Engineering & Technology Mehsan, Gujarat, India
---***---Abstract -
In practice different kinds of solar air heaters are available for domestic heating and industrial air heating purposes, Advantage of this system to use of renewable energy source that is free in cost and eco-friendly.But problem associate with this system is low heat transfer coefficient between the absorber plate and the air stream, which results in a lower thermal efficiency of the heater. There are so many research are going on to improve the efficiency using extended or longitudinal fins attached, baffles, metallic wiry sponge, absorbent material, angle of inclination of glass cover, recycling of air etc. This research focuses to improve the efficiency of the double pass solar air heater by using the wiry sponge or extended surface on absorber plate. This research is carried out of experiment with and without wire sponge and extended surface to increase heat transfer area and turbulence in the fluid and Compare the experiment result.
Key Words: Solar, Absorber Plate, Fins, Collector & Radiation Intensity
1. INTRODUCTION
Energy crisis and global warming was lead to find an alternative way to overcome the above worsening situation. Renewable energy plays a major solution and thereby meets our energy demand and reduces the CO2 emission which reduces the greenhouse effect. And also reduce fossil fuel. In the renewable energy side, Sun is the mother for all sources and harnessing the solar energy in proper ways can eliminate the energy crisis of the world. Collectors are used and for low temperature application side flat plate collectors are used. In solar air heater, solar energy's collected by means of an absorbing plate and the collected heat energy is transferred to heat transferring medium such as air.
2. Working Principal of Thermoacoustic Refrigeration System
2 Thermal analyses:
The theoretical model employed for the study of the solar collector that operates in unsteady state is made using a thermal energy balance.
[Accumulated energy]+[Energy gain]= [Absorbed energy]+[Lost energy] (2.1) For each term of Eq. (2.1) the following expressions are formulated
Accumulated EnergyM Cp p(dTp ave, /dt) (2.2)
Energy Gain m C Tp p( out Tin) (2.3)
Absorbed Energy
0IA
c (2.4)Lost Energy U Tc( p ave, T Ae) c (2.5)
By combining Eq. (2.2)–(2.5), the thermal energy balance equation necessary to describe the solar collector functioning is obtained:
,
( / )
p p p ave
M C dT dt
+m C Tp p( out Tin)=
0IA
c+ ,( )
c p ave e c
U T T A
(2.6)
The optical yield
(
0)
and the energy lose coefficient(
U
c)
are the parameters that characterize the behavior of the solar collector. Note that
(
0)
represents the fraction of thesolar radiation absorbed by the plate and depends mainly on transmittance of the transparent covers and on the absorbance of the plate.
2.2 Thermo-hydraulic behavior of flow inside solar heater duct
In [9] introduced a more realistic performance parameter that shows relative value of thermal gain than that of hydraulic loss, called thermo-hydraulic performance parameter, expressed
1/3
[ ]
[ ]
r x r x
Nu Nu
f f
(2.7)
The Nusselt number for roughened surface (Nur) can be
estimated by using the mean heat transfer coefficient (h) as:
r
hd
Nu
k
(2.8)Here over bar indicates time average, brackets h i indicate averaging in the y direction, and Ag is the cross-sectional the The Nusselt number for smooth duct can be obtained by using the Dittus-Boelter Equation given as:
0.8 0.4
0.23 Re Pr s
Nu (2.9)
Pressure drop for fully developed turbulent flow through roughened duct is obtained by friction factor (fr) as:
2
2[
]
rp
D
I
f
v
(2.10)2.3 Exergy Analysis
This article focuses on the combination of the two laws of thermodynamics, which are described in the concept of exergy analysis. The assumptions made in the analysis presented in this study are:
a) Steady state, steady flow operation,
b) Negligible potential and kinetic energy effects and no chemical or nuclear reactions,
c) Air is an ideal gas with a constant specific heat, and its humidity content is ignored
d) The directions of heat transfer to the system and work transfer from the system are positive.
The mass balance equation can be expressed in the rate form as
in out
m
m
(2.11)Where m is the mass flow rate, and the subscript in stands for inlet and out for outlet.
If the effects due to the kinetic and potential energy changes are neglected, the general energy and exergy balances can be expressed in rate form as given below
in out
E
E
(2.12)
in out dest
E
E
E
(2.13)
, ,
heat work mass in mass out dest
Ex
Ex
Ex
Ex
E
(2.14)
Using Eq. (2.12), the rate form of the general exergy balance can also be written as
,
1
es in in out out x dest
s
T
Q
W
m
m
E
T
(2.15) Where(
)
(
)
in
h
inh
eT s
e ins
e
(2.16)(
)
(
)
out
h
outh
eT s
e outs
e
(2.17)If Eq. ((2.16) and (2.16) are substituted in Eq. (18), it is arranged that
,
1
e[(
)
(
)]
s out in e out in x dest
s
T
Q
m h
h
T s
s
E
T
(3.18)Where Qs is solar energy absorbed by the collector absorber surface and it is evaluated by the expression
(
)
s c
Q
H
A
(3.19)The enthalpy and entropy changes of the air in the collector are expressed by
, ,
( )
out in p f out f in
h h h c T T
(2.20)
,
,
ln
f outln
outout in p
f in in
T
p
s
s
s
c
R
T
P
(2.21)
Substituting Eq. (2.19) – (2.20) in Eq. (2.18) it may be rewritten as
,
, ,
,
1
e( )
(
)
ln
f outln
outc p f out f in p e e dest
s f in in
T
T
P
H
A mc T
T
mc T
mRT
Ex
T
T
P
(3.22)
The irreversibility
Ex
destcan be directly evaluated from thefollowing equation
dest e gen
Ex T S
(3.23)
The second law efficiency is calculated as
1
[1 ( / )]
e gen II
e s s
T S
T T Q
(3.24)
All physical properties of air were selected according to the following bulk mean temperature:
(
) / 2
m in out
T
T
T
3. Instrumentation Setup
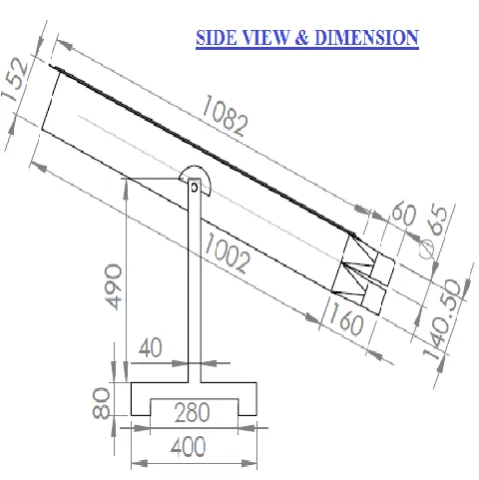
[image:3.595.314.555.67.384.2]The experimental setup has been fabricated from the galvanized iron sheet of 16” gauge (1.6mm), the reduced draft has been provided to the equally air distribution at the inlet and outlet section. The absorber M.S. plate is put at the middle of the solar air heater and all inner surfaces with absorber plate coated black paint to absorb the maximum solar radiation. Adjustable inclination stand has been designed to measure the effect of different inclination angles of solar air heater. For batter comparison there are two set up will fabricated of same dimensions. Absorber plate area is designed to measure the effect is 0.5m2. Forced draft fan is placed at the inlet of the DPSAH. 4mm clear glass is placed at the top of the air heater to reduce the heat loss.
Figure 3.1Experimental Setup CAD Design
[image:3.595.50.277.272.477.2]Figure 3.2 Experimental Setup Dimensions
Figure 3.3 Experimental Setup
4. Result & Discussion
All resultant data for this concept of fins used in solar air heater has been carried out in typically sunny days in month of April. Where in Maximum Solar Radiation arrived at 910W/m2 and The Experiment was conducted from 10:00 AM in morning to 04:00PM in Evening. All data has been measured with defined Instrument. Solar Radiation has been measured with the help of digital solar meter. Wind velocity and mass flow rate of air outlet has been measured with the help of anemometer, all Temperatures have been measured with the help of J type Thermocouple and value has been indicated in the j-type digital indicator. Flow rate has been regulated with the help of control valve at 10 mm. 20mm, 25mm & 30mm pressure difference
4.1 Temperature variation of air in Simple DPSAH without fins with 10dp
[image:3.595.40.280.509.749.2]Figure 4.1 Temperature Vs Time Vs Solar Radiation for 10mm dp & Simple DPSAH
4.2 Temperature variation of air in Simple DPSAH with fins with 10dp
[image:4.595.308.565.248.468.2]From the Above Figure 4.2, it has been observed that the all temperatures have been increased with respected to the time by attaching the fins. The maximum solar radiation in both type of solar air heater has been observed at 02:00PM. The maximum Temperature has been achieved with 10mm pressure difference in the Top absorber plate at 02:00PM for finned obserber plate in case of finned and without fin obserber plate, The Temperatures has been gradually increased with respected to the time up to 02:00PM and it has been decreases gradually after 02:00PM.
Figure 4.2 Temperature Vs Time Vs Solar Radiation for 10mm dp with fins
4.3 Temperature variation of air in Simple DPSAH without fins with 20dp
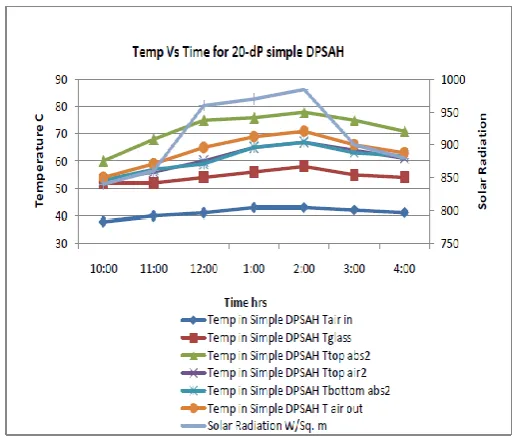
We can the see the result in the fig-4.3. Result show that a small change in mass flow rate changes the maximum temperature of air and plate. The maximum solar radiation is observed at 2:00PM. The maximum temperature has been observed at 2:00PM 86 ᵒC. lowest temperature recorded in air inlet of 27ᵒC. the maximum temperature of air inlet is recorded at 35 ᵒC. from 10:00am to 2:00PM it has been gradually increased and after 2:00PM it has been gradually decreased with respected to the solar radiation. Air outlet maximum temperature has been observed is 69 ᵒC.
Figure 4.3 Temperature Vs Time Vs Solar Radiation for 20mm dp & Simple DPSAH.
4.4 Temperature variation of air in Simple DPSAH with fins with 20dp
[image:4.595.39.556.498.734.2]Attaching the fins on lower surface of observer plate is enhancing the heat transfer rate AS we seen that small change in mass flow rate is increase the maximum and minimum temperature of obserber plat and air. The maximum solar radiation is observed at 2:00PM. The maximum temperature has been observed at 2:00PM 84 ᵒC. lowest temperature recorded in air inlet of 26ᵒC. the maximum temperature of air inlet is recorded at 35 ᵒC. from 10:00am to 2:00PM it has been gradually increased and after 2:00PM it has been gradually decreased with respected to the solar radiation. Air outlet maximum temperature has been observed is 64 ᵒC.
4.5 Temperature variation of air in Simple DPSAH without fins with 25dp
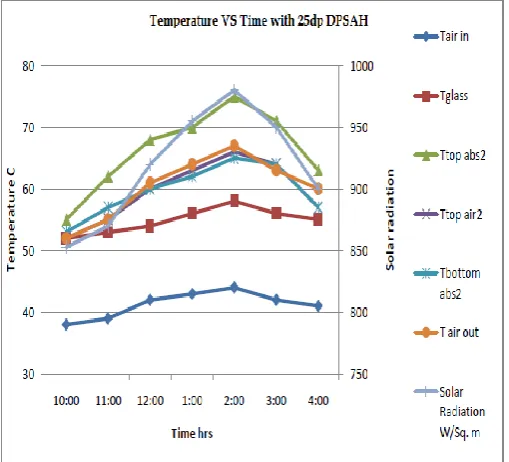
[image:5.595.308.561.250.459.2]By increase the mass flow rate pressure drop is increases and maximum temperature of air and observer plate decreases. The maximum solar radiation is observed at 2:00PM. The maximum temperature has been observed at 2:00PM 80 ᵒC. lowest temperature recorded in air inlet of 26 ᵒC. the maximum temperature of air inlet is recorded at 34 ᵒC. from 10:00am to 2:00PM it has been gradually increased and after 2:00PM it has been gradually decreased with respected to the solar radiation. Air outlet maximum temperature has been observed is 63 ᵒC.
Figure 4.5 Temperature Vs Time Vs Solar Radiation for 25mm dp & Simple DPSAH
4.6 Temperature variation of air in Simple DPSAH with fins with 25dp
From the Above Figure 4.6, it has been observed that the all temperatures have been increased with respected to the time. We get the optimum parameter if concern the pressure drop and temperature gradient.It also helps to reduce the external irreversibility of the system. The Temperatures and
[image:5.595.38.293.404.635.2]solar radiation have been gradually increased with respected to the time up to 02:00PM and it has been decreases gradually after 02:00PM. From the charts it has been observed that Temperatures glass temperature, absorber top surface temperature, and Air temperature in upper section, temperature of absorber bottom surface, air-in, and air-out increases with time gradually and it decreases after 02:00PM gradually. From the charts Top surface of absorber plate has een o served the largest temperature 78 in olar ir eaters and then after op a sor er plate, ottom a sor er plate, air outlet, op ir, glass temperature and n espectively From igher to Lowest direction. he maximum out let air temperature has een o served 75 .
Figure 4.6 Temperature Vs Time Vs Solar Radiation for 25mm dp & with fins
5. CONCLUSIONS
The pressure drop along the collector increases as the collector length increases for the all mass flow rates. At the lower mass flow rate of 0.0073kg/s the pressure drop for the fin solar air heater is 4.01% whereas it increases by around 15.4 % for themaximum mass flow rate 0.132kg/s without fins. And it is increased by around 19.60% at maximum mass flow rate with finned surface Also, increasing the collector length became ineffective beyond the mass flow rate of 0.017kg/s for the fin solar air heater. The thermal efficiency decreases as pressure drop increases. To overcome this and enhance the heat transfer from SAH heater finned is more significant. It increases the heat transfer rate with minimum pressure drop so thermal efficiency of the system is increase.
REFERENCES
[2] Yang, Ming, et al. "Design and optimization of a solar air heater with offset strip fin absorber plate." Applied Energy 113 (2014): 1349-1362
[3] Singh, Nikhil, and Vishal Francis. "Investigating the Effect of Water Temperature and Inclination Angle on the Performance of Single Slope Solar Still: A Taguchi Approach."
[4] Morimoto, T., et al. "Optimization of heat treatment for fruit during storage using neural networks and genetic algorithms." Computers and Electronics in Agriculture 19.1 (1997): 87-101.
[5] Kassem, Abd El-Wahab S., Al-Sulaiman, Mohammed A. “Predicting Drying Efficiency during olar Drying Process of Grapes Clusters in a Box Dryer using Artificial Neural Network.” ustralian Journal of asic & pplied Sciences;2011, Vol. 5 Issue 6, p230
[6] Jadhav, Deepak Baburao, et al. "Solar cabinet drying of bitter gourd: Optimization of pretreatments and quality evaluation." International Journal of Food Engineering 6.4 (2010).
[7] Medugu, D. W. "Performance study of two designs of solar dryers." Arch. Appl. Sci. Res 2.2 (2010): 136-148
[8] Vijay ingh isht et. al. 2017 nil Kumar Patil “ eview and performance evaluation of roughened solar air heaters” ci. es 3.2 (2017)
[9] A.J. Mahmood a, L.B.Y. Aldabbagh et. al. (2015) “ nvestigation of single and dou le pass solar air heater with transverse fins and a package wire mesh layer”