© 2017, IRJET | Impact Factor value: 5.181 | ISO 9001:2008 Certified Journal
| Page 848
TURNING PARAMETER OPTIMIZATION FOR MATERIAL REMOVAL RATE
OF AISI 4140Alloy STEEL BY TAGUCHI METHOD
Mohd Shadab Siddique
1, Mohammad Nehal Akhtar
2, Mohammad Wajahat Iqbal
3, Nizam Beg
4,
Mohd Ziaul Haq
51,4
M.Tech. (Industrial Production Engineering)
2,3,5
Assistant Professor, Azad Institute of Engineering and Technology, Lucknow
---***---ABSTRACT- In this research work machining of the AISI 4140 Alloy steel with the help of coated carbide insert of TNMG 432 PD M400 C7 CVD Al2O3 is performed. Analysis of the Material removal rate is done experimentally with specific input values of feed, depth of cut and speed and gradually the optimal condition is found out. A relation between the inputs and the output is determined and thereafter, the analysis is done how the inputs affected the output. With the help of ANOVA (Analysis of Variance), the most effective parameter selected from the input to obtain the optimal combination for Material removal rate and possible conclusions are made at the end.
KEYWORDS: AISI 4140 Alloy steel , CNC turning, Minitab17, MRR, Taguchi method,
1. INTRODUCTION
Machining is one of the manufacturing processes in which the dimensions, shape or surface properties of machined parts are changed by removing the excess material. The turning process is carried out on a lathe machine and the automatic turning process is performed by Computer numerical control (CNC) lathe machine. The three primary factors in any basic turning operation are cutting speed, feed, and depth of cut. Other factors which further influences the machining are type of material and tool geometry [1]
Rishu Gupta and Ashutosh Diwedi investigated the material removal rate and surface roughness in the turning of Aluminium Alloy 6061 by carbide inserts was in terms of main cutting parameters such as cutting speed, feed rate, depth of cut in addition to tool nose radius, using a statistical approach. An array, Signal-to-Noise ratio and Analysis of Variance were employed to find out the effective cutting parameters and nose radius on the surface roughness. The obtained results indicated that the feed and nose radius are the most significant factor for optimization of Surface roughness (Ra). Material removal rate (MRR) is affected by the parameter depth of cut followed by the nose radius. [2].
In the study done by R. Suresh, performance of multilayer hard coatings (TiC/TiCN/Al2O3) on cemented carbide substrate using chemical vapor deposition (CVD) for machining of hardened AISI 4340 steel was evaluated. An attempt has been made to analyze the effects of process parameters on machinability aspects using Taguchi technique. Response surface plots are generated for the study of interaction effects of cutting conditions on machinability factors. The correlations were established by multiple linear regression models. The linear regression models were validated using confirmation tests. The analysis of the result revealed that, the optimal combination of low feed rate and low depth of cut with high cutting speed is beneficial for reducing machining force. Higher values of feed rates are necessary to minimize the specific cutting force. The machining power and cutting tool wear increases almost linearly with increase in cutting speed and feed rate. The combination of low feed rate and high cutting speed is necessary for minimizing the surface roughness.[3]
© 2017, IRJET | Impact Factor value: 5.181 | ISO 9001:2008 Certified Journal
| Page 849
2. EXPERIMENTAL SET UP AND CUTTING CONDITIONS
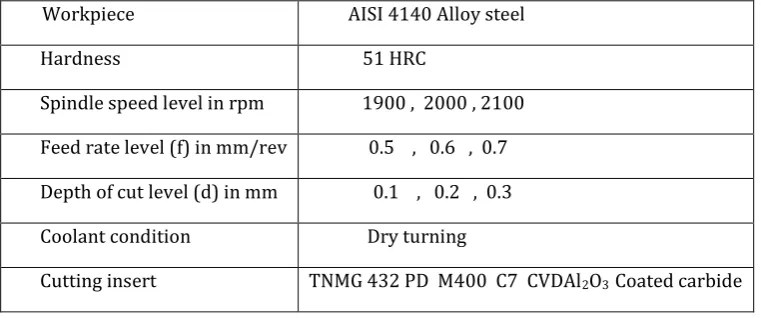
[image:2.595.109.490.225.384.2]The experiment was carried out with a Smarturn linear tool CNC lathe machine. The experiment was carried out in dry condition without using cutting fluid. The cutting condition of alloy steel rod in the turning operation is spindle speed, feed rate, and depth of cut parameters taken on the basis of optimizes the output value with the given input. The cutting condition also includes the cutting insert and the turning operation take place in the absence of cutting fluid. The cutting condition of work piece material as shown in Table 2.1.
Table 2.1: Cutting condition of experiment
2.1Workpiece Material
Machining of the AISI 4140 Alloy steel with the help of coated carbide insert of TNMG 432 PD M400 C7 CVD Al2O3 is performed. The Chemical composition of work piece material as shown in Table 2.2.
Table2. 2: Chemical composition
C Si Mn Cr Mo P S Fe
0.36-0.44 0.10-0.40 0.65-1.10 0.75-1.20 0.15-0.35 0-0.4 0-0.4 Bal
2.2 Material removal rate calculation
The initial and final weight of specimen is measured and time recorded for complete turning process in each experimental trial. Then labeling is done in order to identify the experimental trial number. The each trial is conducted twice in order to record the accurate data. The material removal rate is calculated using following equation.
MRR =(Wi -W f)/(ρs Xcycle time) mm³/sec
Where, Wi = Initial weight of work piece in grams , W f = Final weight of work piece in grams ,X= Machining time in seconds, ρs = Density of HSS steel= 8.10x 10ˉ³ gm/mm³ .
3. RESULTS AND DISCUSSION
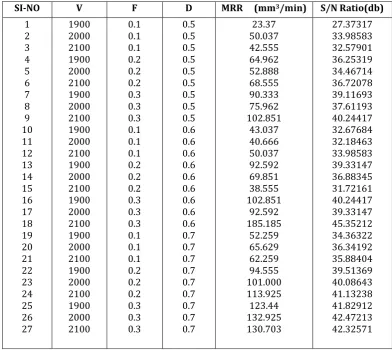
The experiment was conducted with a plan developed to analyse the effects of input parameters speed (V), feed (F) and depth (D) on the Material removal rate. Table shows the results of the experiments for Material removal rate and SN ratio. The results of the ANOVA with Material removal rate (MRR) are shown in Tables 3.1. The significance level α=1.15, and confidence level of 95% for Surface roughness is taken. The sources which are having a P-value less than 0.15 can be said as the significant parameters.
Workpiece AISI 4140 Alloy steel
Hardness 51 HRC
Spindle speed level in rpm 1900 , 2000 , 2100
Feed rate level (f) in mm/rev 0.5 , 0.6 , 0.7
Depth of cut level (d) in mm 0.1 , 0.2 , 0.3
Coolant condition Dry turning
© 2017, IRJET | Impact Factor value: 5.181 | ISO 9001:2008 Certified Journal
| Page 850
Table 3.1: Experimental Detail
3.1ANOVA for MRR
Table 3.1(a): ANOVA for MRR
Source DF SS MS
F-value P-value % Contribution
V 2 900.7 450.3 0.85 0.461 0.256
F 2
20567.4 10283.7 19.50 0.001 58.542
D 2 5179.9 2589.9 4.91 0.041 14.743
V*F 4 2312.1 578.0 1.10 0.421 6.581
V*D 4 457.3 114.3 0.22 0.922 1.301
F*D 4 1497.2 374.3 0.71 0.608 4.261
R-Error 8 4217.9 527.2 12.005
Total 26
35132.4
S = 22.96 R-Sq = 88.0% R-Sq(adj) = 61.0%
SI-NO V F D MRR (mm3/min) S/N Ratio(db)
[image:3.595.100.493.123.473.2]© 2017, IRJET | Impact Factor value: 5.181 | ISO 9001:2008 Certified Journal
| Page 851
Table 3.1(b) : Response Table for MRR
Level V F D
1 76.38 47.76 63.50
2 75.73 77.43 79.49
3 88.29 115.20 97.41
Delta 12.56 67.44 33.91
Rank 3 1 2
Fig 3.1 (a): Main effect plot for mean
[image:4.595.132.466.503.722.2]© 2017, IRJET | Impact Factor value: 5.181 | ISO 9001:2008 Certified Journal
| Page 852
Table 3.1(b)shows the response table of Material removal rate. Based on this analysis, high Material removal rate is obtained at speed 2100, feed 0.3, and DOC 0.6. In the analysis, feed is shown as the most influencing parameter followed by DOC and then speed. The main effect plots are used to determine the optimal design conditions to obtain the optimal Material removal rate. It is evident from Fig. that MRR is Max at the third level of feed, third level of depth of cut and third level of speed.
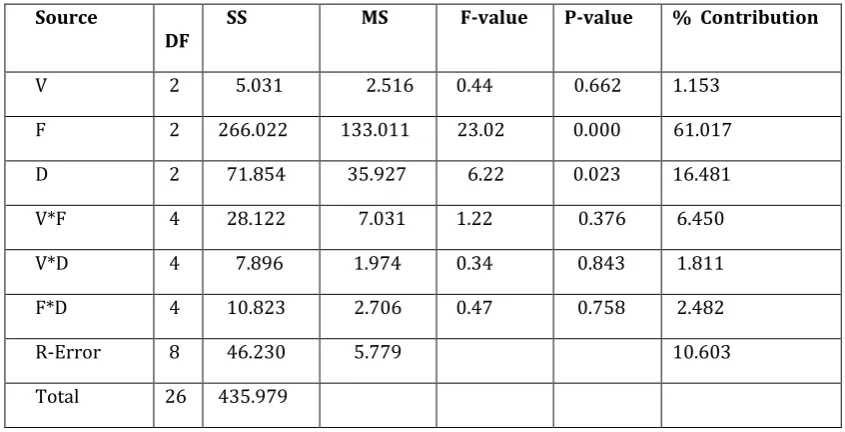
3.2ANOVA for SN ratios of MRR
Table 3.2(a): ANOVA for SN ratios of MRR
Source
DF SS MS F-value P-value % Contribution
V 2 5.031 2.516 0.44 0.662 1.153
F 2 266.022 133.011 23.02 0.000 61.017
D 2 71.854 35.927 6.22 0.023 16.481
V*F 4 28.122 7.031 1.22 0.376 6.450
V*D 4 7.896 1.974 0.34 0.843 1.811
F*D 4 10.823 2.706 0.47 0.758 2.482
R-Error 8 46.230 5.779 10.603
Total 26 435.979
S = 2.404 R-Sq = 89.4% R-Sq(adj) = 65.5%
Table 3.2(b) Response table for SN Ratios of MRR
Level V F D
1 36.74 33.26 35.37
2 37.04 37.35 36.86
3 37.77 40.95 39.33
Delta 1.03 7.68 3.96
Rank 3 1 2
[image:5.595.84.510.207.431.2] [image:5.595.86.509.213.429.2] [image:5.595.152.444.503.640.2]© 2017, IRJET | Impact Factor value: 5.181 | ISO 9001:2008 Certified Journal
| Page 853
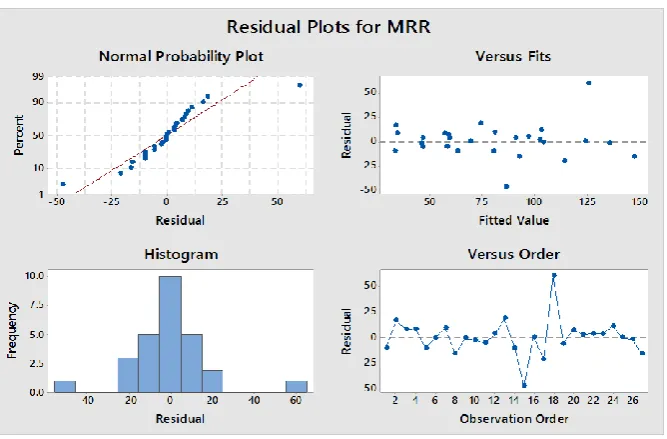
Fig 3.2 (a): Residual plot for SN ratio
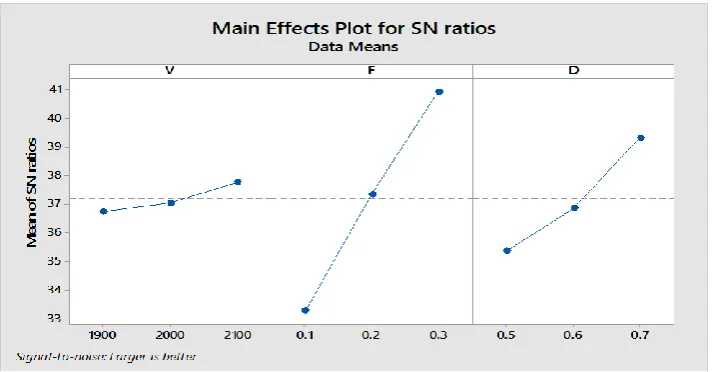
Fig 3.2 (b): Main effect plot for SN ratio
Based on the ANOVA results in Table 3.2(a) the percentage contribution of various factors of Signal to Noise ratios for
material removal rate is identifiable. Here, Feed is the most influencing factor followed by DOC. The percentage contribution of feed and DOC towards surface roughness is 61.017% and 16.481 % respectively. So The optimal combination for S/N ratio for material removal rate is speed 2100, feed 0.3, and DOC 0.6.
The main effect plots for S/N ratio of MRR are used to determine the optimal design conditions to obtain the optimal condition for max material removal rate. It is evident from Fig.3.2(b) that S/N ratio of material removal rate is max at the third level of feed , third level of depth of cut and third level of speed .
3.3 Correlation
Multiple linear order regression model have been implemented at confidence level of 95% to obtain the correlation between the machining parameters (speed, feed and depth) and the measured Material removal rate (MRR) . Regression equation is used to find the optimum machining output value at any cutting parameters. We can apply this equation for optimum values for machining output. The obtained correlation equations were as follows:
Regression Equation for MRR
[image:6.595.120.477.330.516.2]© 2017, IRJET | Impact Factor value: 5.181 | ISO 9001:2008 Certified Journal
| Page 854
3.4 Contour plot for MRR.
Fig.3.4: Contour plot for MRR.
Fig.7.1(a) show the contour plots of the interactions of (D×F), (F×V) and (D×V) for Material removal rate (MRR) . These
plots can help to predict the values for MRR at any point on Contour . The contour plot show the value of MRR on different area with given input variable.As from the above Fig we see MRR is lower for blue colour and higher for dark green colour. Thus we can say the value of MRR Increase from blue to green colour.
8. Conclusions
After completing the experiments the followings were concluded:
1.From the analysis, it was found that, the multilayer coated carbide inserts have performed well and provide us with an optimal operating condition for Material removal rate at a combination of speed of 2100 rpm, feed of 0.3 mm/rev and depth of 0.6 mm.
2. From response table Mean analysis of MRR . The most effecting factors on MRR is feed followed by DOC.
3. From response table Signal to noise ratio analysis of MRR . The most effecting factors on MRR is feed followed by DOC.
4. From the regression equation the output parameters can be optimized for any machine with different combination of input parameters
Refrence:
[1] Aswathy V G1, Rajeev N2, Vijayan K3., “Effect of machining parameters on surface roughness, material removal rate and roundness error during the wet turning of Ti-6Al-4V alloy” Int. Journal of Applied Sciences and Engineering Research, Vol. 4, Issue 1, 2015
[2]. Rishu Guptha and Ashutosh Diwedi. 2014. Optimization Of Surface Finish And Material Removal Rate With Different Insert Nose Radius For Turning Operation On CNC Turning Center, International Journal of Innovative Research in Science, Engineering and Technology,3,13540-13547
[3] Some studies on hard turning of AISI 4340 steel using multilayer coated carbide tool R. Suresh, S. Basavarajappa, G.L. Samuel.
[4] Aggarwal Aman, Singh Hari, Kumar Pradeep, Singh Manmohan, “Optimizing power consumption for CNC turned parts using response surface methodology and Taguchi’stechnique—A comparative analysis”Journal of Materials Processing Technology, 2008, pp. 373–384.
[5] R.M. Sundaram, B.K. Lambert, Mathematical models to predict surface finish in fine turning of steel, Part 2, Int. J. Prod. Res. 19(5) (1981) 557–564.
V 2100
F 0.3
D 0.7
Hold Values F*V
2100 2050 2000 1950 1900 0.30
0.25
0.20
0.15
0.10
D*V
2100 2050 2000 1950 1900 0.70
0.65
0.60
0.55
0.50
D*F
0.30 0.25 0.20 0.15 0.10 0.70
0.65
0.60
0.55
0.50
> – – – – – < 40
40 60
60 80
80 100
100 120
120 140
140 MRR