Image Segmentation based on Histogram Analysis
and Soft Thresholding
T. V. Sai Krishna
Associate Professor, CSE QIS College of Engg& Tech
Ongole, AP
A. Yesu Babu
Principal & Professor Sir CRR College of Engg
Eluru, AP
ABSTRACT
Most researched area in the field of object oriented image processing procedure is efficient and effective image segmentation. Segmentation is a process of partitioning a digital image into multiple regions (sets of pixels), according to some homogeneity criterion. In this paper, we introduce a spatial domain segmentation framework based on the histogram analysis and soft threshold. The histogram analysis uses discontinuity and similarity properties of image statistics in tandem with distribution of pixels to define the binary label for a homogenous region. The soft threshold used for classification is determined based on the localized statistics of the image in consideration for merging of the regions. Simulation results and analysis would verify that the proposed algorithm shows good performance in image segmentation without choosing the region of interest.
General Terms
Pattern Recognition, Image Segmentation, Medial Image Analysis, Security.
Keywords
Image segmentation, object recognition, object extraction, soft threshold, medical image analysis
1.
INTRODUCTION
Automated image processing is a useful tool for quickly evaluating a great deal of data, but machines are not yet as competent as people. Machine image processing has many military and civilian applications including target identification from satellite imagery, terminal guidance of smart bombs, user authentication for security systems, tumor identification from CAT scans, and blood cell counts from stained microscope slides. Unfortunately, machines do not process images as accurately as humans [1]. Hence forth, the need for an image processing algorithm that could classify or cluster an image into several parts (regions) according to the feature of image.
Segmentation is the process of partitioning an image into non-intersecting regions such that each region is homogeneous and the union of no two adjacent regions is homogeneous. Several segmentation algorithms are been proposed for various applications. We can classify the existing segmentation algorithms into four classes based on the image features employed by the algorithm they are as follows [2]:
1. Region-based segmentation: These algorithms expand each region pixel by pixel within in the 8-neighborhood based on quantized value. So that each region thus obtained have homogeneous pixels of similar values with reference to the quantized value.
2. Data clustering based segmentation: These algorithms employ that the homogeneous regions are connective in nature. The characteristic of data clustering is based on fact that each pixel of a cluster does not certainly connective in its neighborhood.
3. Edge-based segmentation: These algorithms utilize the concept of edge detection or similar frameworks as the markers for segmentation. Some of the commonly used edge detection methods are gradient operators and Hilbert transforms.
4. Hybrid based segmentation: These algorithms are proposed based on using two or all three of above mechanisms in a specific order based on the application requirement. Most of researchers are focusing or order and extent to which a mechanism needs to incorporated so that it would time efficient and application effective.
It is a well known fact that the segmentation of nontrivial images is one of the most difficult tasks in image processing. The success or failure of computerized analysis procedures depends on the accuracy of Segmentation process in consideration [3]. For this reason, considerable care and time is being spent to improve the probability and effectiveness of rugged segmentation algorithms. In this paper, we introduce a time domain segmentation framework based on histogram analysis and soft threshold. The proposed system used the two basic properties of the image pixels i.e. discontinuity and similarity in tandem to define the segmentation process within a localized region of digital media. In brief, the proposed approach partitions the image based on abrupt changes in intensity (i.e. background to foreground) based on the histogram analysis. This process is combined with merging of similar regions based on a set of predefined criteria or soft thresholding.
The following paper has been organized as follows. In this correspondence, Section 2 describes about various existing segmentation techniques and the basic architecture of the threshold based segmentation. Section 3 presents the new framework for classifying each image pixels into uniformity or non- uniformity pixels based on localized image statistics. The proposed system and its algorithm are explained in section 4 with detail illustrations. Section 5 deals with the experiments results and the analysis of the proposed segmentation algorithm. Section 6 concludes the paper.
2.
BACKGROUND
be classified to the cluster of seed point or not [4]. Unfortunately, this method is a time consuming and initial seed point needs to be specified.
Unlike most of supervised and region growing algorithms, fast scanning algorithm do not need seed point. In brief, the concept of fast scanning algorithm [5] is to scan from the upper-left corner to lower-right corner of the whole image and determine if we can merge the pixel into an existed clustering. The merged criterion is based on our assigned threshold. If the difference between the pixel value and the average pixel value of the adjacent cluster is smaller than the threshold, then this pixel can be merged into the cluster.
Lei Li et.al [6] proposed an improved method for color segmentation which uses the FSVM (fuzzy support vector machines) algorithm in the HSI (hue-saturation-intensity) color space. Their system offers better effect and lower computational complexity on color image segmentation than most of existing methods. It was noticed that HSI color system has a good capability of representing the colors of human perception. Unfortunately, the conversions of color space causes loss of valuable and time consuming process on the whole. Wen bing Tao et.al [7] introduced a novel approach that provides effective and robust segmentation of color images. By incorporating the advantages of the mean shift (MS) segmentation and the normalized cut (Ncut) partitioning methods. In addition, they illustrate that the low computational complexity makes their method feasible for real-time image segmentation processing. It also preprocesses an image by using the MS algorithm to form segmented regions that preserve the desirable discontinuity characteristics of the image. Further, this proposed method allows a low-dimensional image clustering with significant reduction of the complexity compared to conventional graph partitioning methods that are directly applied to the image pixels. In addition, the image clustering using the segmented regions reduces the sensitivity to noise and results in enhanced image segmentation performance.
Cheng-Wan An et.al [8] proposed an adaptive segmentation approach for color image in RGB space based on Rival Penalized Competitive Learning (RPCL). Initially, histograms of Red, Green, and Blue component colors are segmented by adaptive threshold segmentation algorithm for gray image. Then some possible colors of original image are specified through combining those components' segmented areas and false colors not appearing in image are removed. Finally those possible colors are converged to the main actual colors of original image by RPCL. Then original image is segmented by those learned centers without specifying the number of initial classes in advance. Ming-Xin Zhang et.al [9] proposed conventional image segmentation based on rough-set theory. The new distance matrix is defined by using the vector angle and Euclidean distance. And then according to this new distance matrix, the space binary matrixes of each color component are calculated. Further, the color image segmentation is implemented by selection of threshold values and region merging through introducing a histogram based on roughness. This proposed approach yields better segmentation which is more intuitive to human vision compare with the existing conventional image segmentation.
Chunming Li et.al [10] introduced a new variation level set formulation in which the regularity of the level set function is intrinsically maintained during the level set evolution. Level set is derived as the gradient flow that minimizes energy functional with a distance regularization term and an external energy that drives the motion at desired locations. The
distance regularization obtained by a potential function, which is able to maintain a desired shape of the level set function, particularly a signed distance profile near the zero level set. The distance regularization effect eliminates the need for re-initialization and thereby avoids its induced numerical errors. Further, this framework simpler and more efficient finite difference scheme can be used to implement the DRLSE formulation.
Thus to address the limitation of the commonly used existing segmentation algorithms, we design an effective spatial domain segmentation framework based on the histogram analysis and soft threshold. The proposed system used the two basic inherent image properties in tandem to define the segmentation process. These classify the image pixels into discontinuity or similarity localized region of digital media based on the histogram analysis. Then the small image regions are combined based on homogenous of the image pixel distribution using soft thresholding.
3.
REGION CLASSIFICATION
In this section, we illustrate basic statistics utilized in design of the proposed segmentation algorithm with respect to each inherent image feature used. The goal of segmentation with reference to the authors is typically to locate certain objects of interest which may be depicted in the image using a non manual process. Henceforth, segmentation could be viewed as a computer vision problem.
It is statistical fact that the success of an image processing algorithm increases with the prior knowledge about the image in consideration.
3.1
Histogram Analysis
A histogram of the image shows the relative frequency of occurrence for each pixel value in a given digital image (of range {0 – 255}). The histogram offers a detail and convenient summary of the intensities in an image, but is unable to convey any information regarding spatial relationships between pixels [1].
A common histogram technique for determining a coarse segmentation is scale-space filtering method. Since, instead fixed initial seed value a better choice would be a histogram derived threshold seed values. Further, this method includes some knowledge of the distribution of the image, and will result in less misclassification [11].A binary image matrix map is created based on the histogram zero-crossings of all the scales that is considered image fingerprint. In addition, by examining this fingerprint the colors present in the image can be determined. The maximum value and minimum value of the histogram is found by taking the second derivative and looking for the zero-crossings.
a) b)
Fig 1: a) Original Lena image b) Histogram of the Lena image with 1st and 2nd peak points marked along with zero
[image:2.595.320.539.599.712.2]In this framework, first the original image is projected via the most prominent peak of the histogram. The portion of the color space is projected to determine the complete color volume of that cluster. We repeat this procedure with the remaining data, thus obtaining the complete color space labels within the homogenous area. A detail perspective regarding peak points and the zero cross-over regions of the histogram of a digital image of ‘Lena’ are explained using the figure 1
3.2
Statistical Inference
In this framework, we incorporate few basic statistical measures to compare the homogeneity of the selected regions in consideration. In this section, we introduce some of the common used statistical defined values that could be used in comparison of the image regions.
3.2.1
Image Mean
The image mean can be defined as the average pixel value of an image in consideration. In terms of grey scale image, the image mean is equal to the average brightness or intensity of a digital image. Mathematically, image mean ‘α’ can be presented as follows
Where, ‘α’ is the image mean and ‘im’ is the digital image in consideration of size ‘m*n’. Further, this statistical measure defines where two regions within certain constraints could be merged or not.
3.2.2
Image Variance
The image variance can be defined as the spread of the pixel value of an image in consideration. In terms of grey scale image, the image mean is equal to the average brightness or intensity of a digital image. Mathematically, image mean ‘α’ can be presented as follows
[image:3.595.79.258.531.674.2]
Where, ‘β’ is the image variance, ‘α’ is the image mean and ‘im’ is the digital image in consideration of size ‘m*n’. Further, this statistical measure defines where a region is homogenous within certain constraints or contains image pixels over a broader range.
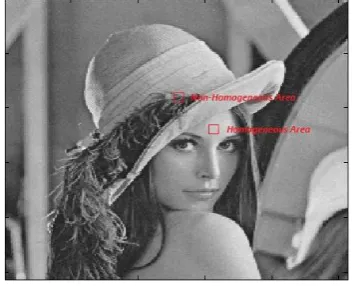
Fig 2: Shows the Homogenous area (image variance = 23.57) and Non-homogeneous area (image variance =
345.18) within the Lena image
Standard deviation of the image/region is defined as the square root of the image/region variance. Mathematically, the standard deviation can be expressed as
3.3
Thresholding
Thresholding is one of the oldest, simplest and most popular techniques used in the image processing. Most of the commonly used thresholding techniques literature is concerned with classifying pixels into object or background classes could for instance appear from noise. The simplest way of choosing the threshold value would be a fixed value, based on predefined constraints.
It is well known facts that threshold techniques make decisions based on local pixel information and are effective when the intensity levels of the pixels fall squarely outside the range of levels in consideration. Since the pixel information fall on non-squarely, even with adaptive threshold, it is still difficult to segment some regions with similar properties [12].
We introduce the threshold minimizer for merging of two homogenous regions under certain constraints that are defined dynamically based on the size and statistics of the region in consideration. We propose that if the absolute difference between the average intensities of two neighboring regions (within size constraints range) is smaller than the contrast threshold Tc, then the two regions are merged.
3.4
Region Grouping
The success of the segmentation approach is directly related region classification or grouping of image pixels and features. There are several approaches established for feature calculation that can be classified according to the way the image pixels are grouped for feature calculation. Smeulders et al. [13] differentiate four types of grouping:
1. Strong segmentation denotes the segmentation of an image according to real world objects.
2. Weak segmentation is the term used for data-driven grouping of an image into homogeneous regions. 3. Sign spotting reveals whether objects of (almost)
fixed shape and a known semantic interpretation are present in an image and where they are located. 4. Partitioning divides images into geometrical areas,
regardless of the image data may have to improvise.
Saurabh Agrawal et al. [14] proposed a novel classification based on localized statistics for analyzing corrupted pixels to non-corrupted pixels within an image. They have designed variation measure that is based on the localized statistical calculations that are dependent on median based statistics.
1. Low variation pixels indicates the pixels are within a homogeneous area
2. Medium variation pixels indicates the pixels are close to the edge area in a given digital image 3. High variation pixels indicates the pixels are within
the edge area
We focus on classifying image pixels into discontinuity and similarity regions based on localized image statistics.
3.5
Outliners
The outliners are predefined criteria that are employed for selection of the threshold values. In addition, we have also defined the outliners for merging of the homogeneous areas and also size of the regions is also considered.
4.
PROPOSED ALGORITHM
Inputs: - Input Image. The cover image may be of any image format using the 8-bit, power of two’s representation. The proposed algorithm may also be applied on 24-bit, each color layer images treated as an individual 8-bit image.
Histogram Analysis. The histogram analysis of an image is considered as a probability distribution over the pixels values. Further, it provides a means to determine the information content of the image but it would not take spatial factors into consideration. A localized frame work should therefore be able to determine automatically the skewness introduced by non-uniformity (heterogeneous edge and texture) regions varying above the uniformity (homogeneous) regions. Further, the thresholds should be chosen based on the distance between the valleys to peaks of the histogram.
Binary Label Matrix. The binary label matrix is the key feature of the proposed segmentation process as the efficiency of the segmentation process depends on the how wide the binary label matrix id defined. The aim is to retain as much information as possible in the binarized image by choosing a split in which each of the two distributions is as uniform as possible. This method has the advantage of not having to estimate any parameters, but does not help us decide on the Multimodality of the histogram.
Binary label matrix is defined where each label (1, 2... m) are estimated based on the homogeneity of the region. There are various overlapping regions and distinct labels with
similar homogeneity value. Henceforth, we have soft thresholding process that would merge the regions of similar homogeneity and size of the region is also incorporated as the thresholding parameter.
Soft Threshold based System. Soft threshold based technique is one of the commonly used image processing operation for digital filtering. The proposed system uses the soft thresholding to evaluate each binary label with reference to the input image and calculate the combined homogeneity of the region.
It is noted that if the combine homogeneity of the two regions reduce the average image statistics of the combined region with respect to each region individually then the regions are recommend for merging. If the merging is not recommended as the region is small compared to predefined criteria then also in certain conditions they are merged based on the neighborhood.
Outputs: - Segmented Image.
[image:4.595.76.525.366.596.2]The Segmentation process is a straightforward process where all necessary parameters are dictated based on the histogram analysis or soft thresholding. Input image is segmented into various uniform and non-uniform regions without any loss or integrity with reference to the input with highest efficiency and low time complexity.
Fig 3: Block diagram of the proposed segmentation algorithm
5.
COMPUER SIMULATION
Computer simulations were simulated using MATLAB software package. Analysis was done using 100 color images of varying sizes, texture and contour. These images were taken using 2 digital cameras Nikon D100 and Canon EOS Digital Rebel and modified in Photoshop to attain a smooth histogram. In addition, for testing the effectiveness and efficiency of the proposed system varying images with different image features are employed.
a) b)
Fig 4: Experiment for a synthetic airplane image (a) Input Image. (b) Objects detected based on proposed
segmentation algorithm
[image:5.595.56.281.75.187.2]a) b)
Fig 5: Experiment for a Coins image (a) Input Image. (b) Objects detected based on proposed segmentation
algorithm
Figure 5 shows the segmentation results of a coins image with objects having weak heterogeneous edge regions. Figure 5 a) shows the input image to our model. The figure 5 b) shows the segmentation results that is obtained by proposed model. It could be viewed that the proposed segmentation is effective in recognizing the objects in a weak heterogeneous edge regions.
5.1
Comparison Analysis
In comparison analysis, we compare the proposed segmentation with existing SPF based supervised segmentation algorithm proposed by savan oad et. al [15]. The comparison results have proved that the proposed system operates effectively in various kinds of image. Due to space constraint we limit the comparison to three images of varying uniformity and non-uniformity regions.
a) b)
c)
Fig 6: Experiment for a flower image a) Input Image. b) Objects detected based on proposed segmentation algorithm c) Object detection using SPF function (closed
contour) [15]
Figure 6 shows the segmentation results of a flower image with objects having heterogeneous and texture edge regions. Figure 6 a) shows the input image to our model. The figure 6 b) shows the segmentation results that is obtained by the proposed model. In addition, figure 6 c) introduces the segmented object based on SPF method [15]. It could be viewed that the proposed segmentation is effective in recognizing the objects in comparison with the existing system.
a) b)
c)
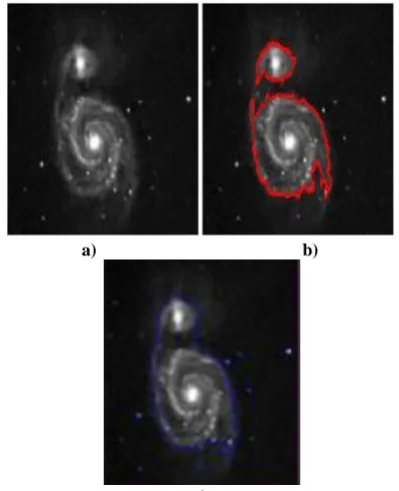
Fig 7: Experiment for a galaxy image a) Input Image. b) Objects detected based on proposed segmentation algorithm c) Object detection using SPF function (closed
contour) [15]
[image:5.595.54.283.85.313.2] [image:5.595.328.528.367.613.2] [image:5.595.56.280.570.732.2]Further, the proposed detected two separate constellations whereas existing method has detected them as single entity. The soft threshold mechanism employed in our system limited the detection of each star or white dots as an entity.
Figure 8 shows the segmentation results of a galaxy image with objects having heterogeneous and texture edge regions. Figure 8 a) shows the input image to our model. The figure 8 b) shows the segmentation results that is obtained by the proposed model. In addition, figure 8 c) introduces the segmented object based on SPF method [15]. It could be viewed that the proposed segmentation is effective in recognizing the objects in comparison with the existing system. Further, the proposed detected similar to the existing SPF based segmentation algorithm.
a) b)
c)
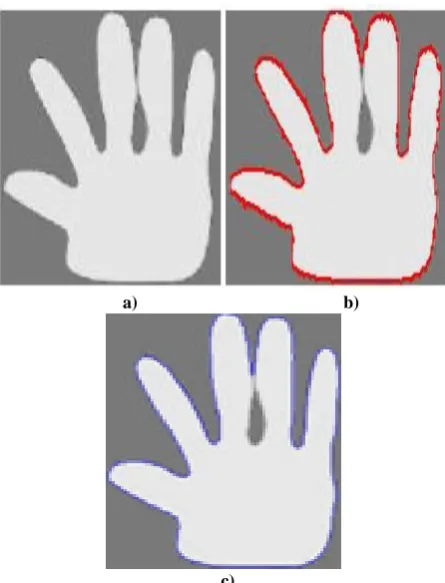
Fig 8: Experiment for a Synthetic hand image a) Input Image. b) Objects detected based on proposed segmentation algorithm c) Object detection using SPF
function (closed contour) [15]
The simulation analysis show that the proposed algorithm is superior to the existing supervised segmentation algorithms and in some cases on synthetic images it segments similar to the existing algorithms.
6.
CONCLUSION
In this paper, we introduced a spatial domain segmentation framework based on the histogram analysis and soft thresholding process. The histogram analysis offered a better means to classify the image into various binary labels based on the image statistics of the region. The soft threshold used for classification and merging of the regions based on the localized statistics (i.e. uniformity and non-uniformity) of the image in consideration. Simulation results and analysis proved that the proposed algorithm shows good performance in image segmentation without choosing the region of interest.
7.
REFERENCES
[1] R. C. Gonzalez and R. E. Woods, Digital Image Processing, 3rd edition, Prentice Hall, New Jersey 2008. [2] D. Comaniciu and P. Meer, “Mean shift: a robust approach toward feature space Analysis,” IEEE Transactions on Pattern Analysis and Machine Intelligence, vol. 24, no. 5, pp. 603-619, May 2002 [3] N. R. Pal and S. K. Pal, "A review on image
segmentation techniques," Pattern Recognition, vol. 26, pp. 1277-1294, 1993.
[4] R. Adams, and L. Bischof, “Seeded region growing,” IEEE Transactions on Pattern Analysis Machine Intelligence, vol. 16, no. 6, pp. 641-647, June, 1994. [5] J. J. Ding, C. J. Kuo, and W. C. Hong, “An efficient
image segmentation technique by fast scanning and adaptive merging,” CVGIP, Aug. 2009.
[6] Lei Li, Jin-Yan Li and Wen-Yan Ding, “A new method for color image segmentation based on FSVM,” IEEE proceedings of the Ninth International Conference on Machine Learning and Cybernetics, Qingdao, pp. 664-668, July 2010
[7] Wenbing Tao, Hai Jin, and Yimin Zhang, “Color image segmentation based on mean shift and normalized cuts,” IEEE Transactions on Systems, Man, and Cybernetics-Part B: Cybernetics, Vol. 37, No. 5, Oct 2007
[8] Cheng-Wan An, Gui-Zhi Li, Guo-Sheng Yang, and Min Tan, “Color image adaptive segmentation based on rival penalized competitive learning,” IEEE Proceedings of the Third International Conference on Machine Learning and Cybernetics, Shanghai, pp.2558-2662, Aug 2004 [9] Ming-Xin Zhang, Cai-Yun Zhao, Zhao-Wei Shang, Hua
Li and Jin-Long Zheng, “An algorithm based on rough-set theory for color image segmentation,”IEEE Proceedings of the International Conference on Wavelet Analysis and Pattern Recognition, Qingdao, July 2010. [10] Chunming Li, ChenyangXu, ChangfengGui and Martin
D. Fox, “Distance regularized level set evolution and its application to image segmentation,”IEEE Transactions on Image Processing, Vol. 19, No. 12, pp.3243-3253 [11] Carlotto, Mark J. “Histogram analysis using scale-space
approach,”IEEE Transactions on Pattern AnaP. 2007 Modeling and Simulation Design. AK Peters Ltd.
[12] XiaoJun Du, “Image segmentation and its applications based on Mumford-Shah model,” Ph.D Doctoral Thesis, Concordia University, Canada, April 2011
[13] A. W. W. Smeulders, M. Worring, S. Santini, A. Gupta, and R. Jain, “Content based image retrieval in the end on the early years,” IEEE Transactions on Pattern Analysis and Machine Intelligence 22(12), pp. 1349-1380, 2000
[14] A. Saurabh, Yadav J. S, and Ravindranath C. C, “A novel weighted median switching filter for denoising corrupted images” International Journal of Computer Applications, Vol. 64, No.21, pp:5-11, 2013.
[image:6.595.56.279.227.519.2]