A Comparative Study of Data Clustering Algorithms
Geet Singhal
Bachelor of Technology (I.T.)Northern India Engineering College, GGSIPU
Shipra Panwar
Bachelor of Technology (I.T.)Northern India Engineering College, GGSIPU
Kanika Jain
Bachelor of Technology (I.T.)Northern India Engineering College, GGSIPU
Devender Banga
Assistant Professor (I.T.)Northern India Engineering College, GGSIPU
ABSTRACT
Data clustering is a process of partitioning data points into meaningful clusters such that a cluster holds similar data and different clusters hold dissimilar data. It is an unsupervised approach to classify data into different patterns. In general, the clustering algorithms can be classified into the following two categories: firstly, hard clustering, where a data object can belong to a single and distinct cluster and secondly, soft clustering, where a data object can belong to different clusters. In this report we have made a comparative study of three major data clustering algorithms highlighting their merits and demerits. These algorithms are: k-means, fuzzy c-means and K-NN clustering algorithm. Choosing an appropriate clustering algorithm for grouping the data takes various factors into account for illustration one is the size of data to be partitioned.
Keywords
k-means algorithm, c-means algorithm, k-nn algorithm, Euclidian distance, Hard clustering, Soft clustering.
1.
INTRODUCTION
Data Mining is a knowledge discovery process. It helps you to understand the substance of a data in a special unsuspected way. It unearths patterns and trends in the raw data you never knew existed. As Joseph P. Bigus stated - “Data Mining is the efficient discovery of valuable, non-obvious information from a large collection of data. [1] It centres around the automated discovery of new facts and relationships in data.”[2]
1.1
Knowledge Discovery Phases
There are four phases of knowledge discovery process:
1. Determination of Business objectives. 2. Selection and Preparation of Data.
3. Applications of Suitable Data Mining Techniques. 4. Evaluation and Application of Results.
Discovery of relationships and patterns are the key results of data mining. Several types of analytical software are available: statistical, machine learning, and neural networks. Generally, any of four types of relationships are sought. [2]:
Cluster
A cluster refers to similar data grouped together on the basis of the similarity of certain properties. For example, data mining in market analysis can be done by forming clusters of data pertaining to different time spans.
Classes
Stored data is used to locate data in predetermined groups. For example, a departmental store could mine the data related to the purchases made by the customer to determine their
choices and preferences, and hence expand their sales by introducing attractive offers suitable to the particular group of customers.
Sequential patterns
Data mining is done to anticipate behavioral patterns and trends. For example, an equipment retailer could predict the likelihood of a backpack being purchased based on a consumer's purchase of sleeping bags and hiking shoes.
Associations
Associations between data can be found by mining the data from the data warehouse.
1.2
Data Mining Techniques
Data mining has many techniques. Some of them are explained below:
Genetic Algorithms
These are those algorithms which are based on the concept of mutations and genetic evolution. The agenda here is ‘Survival of the fittest’. These algorithms mimic the real world occurrences.
Neural Networks
They model and shape the behaviour of human brain. They simulate biological systems, where learning is dependent upon the connections between the neurons. They are useful in pattern recognition and data classification.
Nearest Neighbour Method
This technique is sometimes referred to as k-Nearest Neighbour technique. Here, a list of nearest neighbours is analysed and the class with predominance is assigned to the test object.
Data Visualization
This involves formation of graphical illustrations using graphic tools. These include flowcharts, diagrams, and so on.
Decision trees
These are hierarchical structures to facilitate decision making. These are useful in classification of data based on certain decisions.
1.3
Cluster Detection Techniques
Clustering is the process of partitioning and grouping a set of objects in such a way that objects in the same group (called a
distinction is made between independent and dependent variables. Variables participate equally in the functioning of data mining algorithm. [2]
Components of a Clustering Task
Typical pattern clustering activity involves the following steps. [3]:
pattern representation (optionally including feature extraction and/or selection),
definition of a pattern proximity measure appropriate to the data domain,
clustering or grouping,
data abstraction (if needed), and
assessment of output
Cluster analysis itself is not one specific algorithm, but the general task to be solved. It can be achieved by various algorithms that differ significantly in their notion of what constitutes a cluster and how to find them efficiently.
It is used in many fields, including machine learning, pattern recognition, image analysis, information retrieval, and bioinformatics. The concept of a "cluster" cannot be precisely defined, which is one of the reasons why there are so many clustering algorithms. The notion of a cluster, as found by different algorithms, varies significantly in its properties. [2]
Some of the clustering models include:
Centroid -based
They include the k-means algorithm where a centroid is computed and the clusters, based on similarity with the centroid, are made
Graph
-based
The internal nodes of the graph, which are connected with each other through edges, form a cluster.
Density
-based
Here, the density of records in a particular segment determines the formation of a cluster. Clustering is done on the basis of the density of the records in a particular segment. Example: DBSCAN
Connectivity
based
It builds models based on distance connectivity between two nodes.
Group
based
It provides the grouping information for the given data set and do not provide a refined model.
Distribution
based
The clusters are computed using statistical distribution of data sets.
Clustering may be classified into two broad types:
Soft Clustering
Here each data object can belong to two or more clusters.
Hard Clustering
In this type, a data object belongs to a definite and distinct cluster.
2.
LITERATURE REVIEW
“Analysis and Comparison of Efficient Techniques of Clustering Algorithms in Data Mining” In this paper, the author(s) present the comparison of data mining algorithms
for clustering. With each algorithm, they provide a description of the algorithm, discuss the impact of the algorithm, and review current and further research on the algorithm. These algorithms cover classification, clustering, statistical learning, association analysis, and link mining, which all are among the most important topics in data mining research and development. [4]
“Research Paper on Cluster Techniques of Data Variations” In this paper, the author(s) provides a brief introduction to cluster analysis. They presented a brief view of recent techniques which uses a concept-based clustering approach. [5]
“BoostCluster: Boosting Clustering by Pairwise Constraints” In this paper, the author(s) present a boosting framework for data clustering, termed as BoostCluster that is able to iteratively improve the accuracy of any given clustering algorithm by exploiting the pairwise constraints. Their empirical study shows that the proposed boosting framework is effective in improving the performance of a number of popular clustering algorithms (K-means, partitioned Single Link, spectral clustering), and its performance is comparable to the state-of-the-art algorithms for data clustering with side information. [6]
“Landscape of Clustering Algorithms” In this paper, the author(s) revisits conventional categorization of clustering algorithms and makes an attempt to relate them according to the partitions obtained. They empirically study the similarity of clustering solutions obtained by many traditional as well as relatively recent clustering algorithms on a number of real-world data sets. Sammon’s mapping and a complete-link clustering of the inter-clustering dissimilarity values are performed to detect a meaningful grouping of the objective functions. They found that only a small number of clustering algorithms are sufficient to represent a large spectrum of clustering criteria. [7]
“Efficient and Effective Clustering Methods for Spatial Data Mining” In this paper, the author(s) developed a new clustering method called CLARANS[8]which is based on randomized search. They also developed two spatial data mining algorithms that use CLARANS. Their analysis and experiments showed that with the assistance of CLARANS, these two algorithms are very effective and can lead to discoveries that are difficult to obtain with current spatial data mining algorithms. Furthermore, the experiments conducted to compare the performance of CLARANS with that of existing clustering methods showed that CLARANS is the most efficient of all.
3.
CLUSTERING ALGORITHMS
Clustering algorithms can be categorized based on their cluster model. The most appropriate clustering algorithm for a particular problem often needs to be chosen experimentally, unless there is a mathematical reason to prefer one cluster model over another.
Some of the clustering algorithms that we have studied in this research paper are:
3.1
The k-means Algorithm
efficiently. Patterns within a valid cluster are more similar to each other than they are to a pattern belonging to a different cluster.[9]
In the clustering problem, we are given a set of n data points in real d-dimensional space, Rd, and an integer k, the main problem is to determine a set of k points in Rd, called centroids, so as to minimize the mean squared distance from each data point to its nearest centroid. The given measure is known as squared-error distortion. Such type of clustering falls into the category of Variance-Based.
The k-means method is found to be effective in producing good clustering results for many practical applications. [9]However, a direct algorithm of k-means method requires time proportional to the product of number of patterns and number of clusters per iteration. This is computationally highly expensive especially for large datasets. The k-means algorithm is a simple iterative method to partition or group a given dataset into a number of clusters, k. k is the number of clusters specified by the user. Here, the number of cluster k is assumed to be fixed. This algorithm operates on a data set of d-dimensional vectors, D = {xi | i = 1, . . . , N }, where xi∈ d denotes the ith data point. The algorithm is initialized by picking k points in D as the initial k cluster representatives or centroids. Initial centroids are often chosen randomly. The centroid is (typically) the mean of the points in the cluster. Techniques employed for selecting these initial seeds or centroids include random sampling from the dataset, setting them as the solution of clustering a small subset of the data or perturbing the global mean of the data k times. ‘Closeness’ is measured by Euclidean distance, cosine similarity, correlation, etc. [9]
In the clustering problem, we have a training data set {x(1), . . . , x(m)}, and have to group the data into ‘k’clusters. Here, x(i)∈R^n. It is an unsupervised learning problem.
The algorithm is as follows:
1. Initialize cluster centroids µ1, µ2, . . . , µk ∈R^n randomly.
2. Repeat until convergence:
{
For each i, set
C(i) =arg min ││x(i)│─µj││2 j
For each j, set
µj :=
}
In the algorithm above, k (a parameter of the algorithm) is the number of clusters we want to find; and the cluster centroids µj represent our current guesses for the positions of the centers of the clusters. To initialize the cluster centroids (in step 1 of the algorithm above), we could choose k training examples randomly, and set the cluster centroids to be equal to the values of these k examples. (Other initialization methods are also possible.) Result can vary significantly depending on initial choice of seeds.
The k-means algorithm is popular because it is easy to implement, and its time complexity is O(n), where n is the number of patterns. A major problem with this algorithm is that it is sensitive to the selection of the initial partition and
may converge to a local minimum of the criterion function value if the initial partition is not properly chosen. [12]
Advantages
If variables are huge, then K-Means most of the times computationally faster than hierarchical clustering, if we keep k small.
K-Means produce tighter clusters than hierarchical clustering, especially if the clusters are globular.
Disadvantages
Difficult to predict K-Value.
With global cluster, it didn't work well.
Different initial partitions can result in different final clusters.
It does not work well with clusters (in the original data) of different size and different density
3.2
The c-means Algorithm
Fuzzy clustering also known as Fuzzy ISODATA, is a powerful unsupervised method for the analysis of data and construction of models. Objects on the boundaries between several classes are not forced to fully belong to one of the classes, but rather are assigned membership degrees between 0 and 1 indicating their partial membership. Fuzzy c-means algorithm is most widely used.
FCM is representative for the method of overlapping clustering. It uses fuzzy sets to cluster data, so each point may belong to two or more clusters with different degrees of membership. In this case, data will be associated to an appropriate membership value.[10]
ALGORITHM
1. Initialize U =[uij] matrix ,U(0)
2. At k-step calculate the centers vectors C(k) =[cj] with U(k).
Ci =
3. Update U(k), U(k+1)
4. dij = i –cj)
Uij =
5. if ││U(k+1) –U(k) ││< Є then STOP ;
Otherwise return to step 2.
Here m is any real number greater than i, µij is the degree of membership of xi in the cluster j, xi is the ith element of d-dimensional measured data, and cj is the d-dimensional center of the cluster
.
This algorithm works by assigning membership to each data point corresponding to each cluster center on the basis of distance between the cluster center and the data point. More the data is near to the cluster center more is its membership towards the particular cluster center. [10]
Advantages
Unsupervised
Converging
Limitations
Long computational time
Sensitivity to the initial guess (speed, local minima)
[image:4.595.94.250.181.315.2] Sensitivity to noise and One expects low (or even no) membership degree for outliers (noisy points).
Fig. 1 : The c-means Graph
3.3
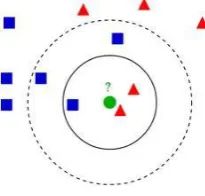
The k-NN Algorithm
k-NN Algorithm, or k-Nearest-Neighbor algorithm is a clustering algorithm which facilitates classification and clustering of similar data for a consolidated and manageable form. k-NN does not involve any dependencies on parameters, and hence, is easy to understand. In the conventional process of Rote Classifying, there’s an exact matching to the training sets. [9]The Rote Classifier learns the entire training-set, and classifies the test objects only when the object’s attributes match exactly to the training-set. This is a serious drawback since some of the objects do not match exactly to the training sets, and hence are not classified. This needs to be resolved by the use of an algorithm that takes into consideration the closeness factor as well.
A k-NN algorithm uses a different approach. It takes into consideration a group of ‘k’ objects in the training sets that are closest (distance-wise) to the test object. For k=1, the algorithm may be simply known as nearest neighbor algorithm, since it shall take into account only the single nearest neighbor. The number of nearest neighbors is found and the classes of these neighbors are observed. The class which has the dominance is assigned to the test object.
Fig. 2 : The k-NN distribution
For a training set D and test object (x,y), the k-NN algorithm calculates the distances, or the similarities between z and all
the objects (x,y) belonging to the training set D. With this, it comes to a nearest neighbor list Dz. The occurrences of various classes in this Dz are then computed, and the dominant class in the Dz is assigned to the test-object. [9]The classes are represented by ‘y’ whereas the data is represented by ‘x’. This is illustrated by the following formula.
Majority Class: )
a
where ‘a’ is the label of the class, yi is the label of the ith class of the nearest neighbor, and I is a function which returns a value of 1 when the arguments after all the iterations. Hence it gives the class label with the maximum number of occurrences.
Input: D, a set of n training objects & test object z = (xˊ,yˊ).
Process: Compute d(xˊ, x), which is the distance between z and every other object (x,y) ϵ D. Select Dz ⊆ D, which is the set of n closest training objects to z.
Output: )
v
k-NN is very simple to understand and easy to implement. So it should be considered in seeking a solution to any classification problem. [11]
Advantages
K-NN is easier to implement and debug. This is because the whole process is transparent.[11]
k-NN is very effective in a case when the analysis of neighbors is equally useful to their explanation.
k-NN may improve the accuracy of the classifier. This is due to some Noise Reduction techniques implemented exclusively on it. For example, Case-Retrieval Nets, [11] which elaborate the Memory-Based Classifier Idea, may improve run-time performance in large cases.
Disadvantages
k-NN may give poor run-time performance in a case when the training set is large sized. This is because all work is done at the runtime.[11]
Since all features contribute to classification and similarity, k-NN may be sensitive to many redundant and irrelevant features.
Some techniques such as Support Vector Machines [11] and Neural Networks may perform better than k-NN in cases when the classification tasks are difficult.
4.
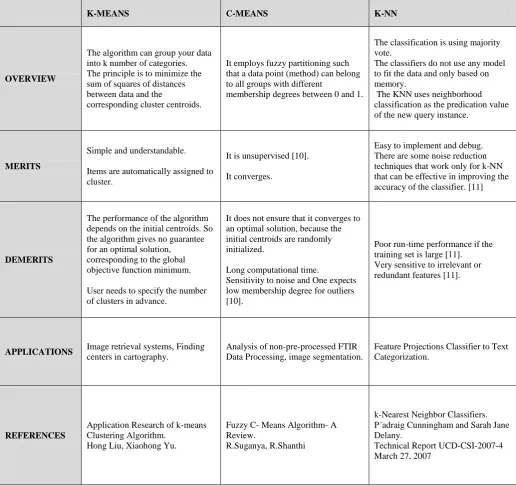
COMPARISON TABLE
[image:4.595.115.218.584.682.2]Table 1 : Comparison of K-Means, C-Means, and K-NN Clustering Algorithms
5.
CONCLUSION
In this paper the authors have reviewed the three major clustering algorithms, namely, the k-means, the fuzzy c-means and the K-NN clustering algorithm and have made a comparative study taking account their merits and demerits and all other factors which may influence the criterion in choosing an appropriate clustering algorithm for partitioning a given data set.
In k-means algorithm, the main principle is to minimize the sum of squares of distances between data and the corresponding cluster centroids. Hence, the distance measure is the quintessential criterion in classification and formation of clusters.
The KNN algorithm uses neighborhood classification as the predication value of the new query instance. Hence, being a hard clustering algorithm, it gives less precise clusters than other soft-clustering algorithms.
The fuzzy c-means algorithm, on the other hand, is a soft clustering algorithm. It uses fuzzy sets to cluster data, such that each data point may belong to two or more clusters (overlapping clustering) with different degrees of membership. The data objects on the boundaries between several clusters are not forced to fully belong to one of the clusters, but are rather assigned membership degrees between 0 and 1 indicating their partial membership.
K-MEANS C-MEANS K-NN
OVERVIEW
The algorithm can group your data into k number of categories. The principle is to minimize the sum of squares of distances between data and the
corresponding cluster centroids.
It employs fuzzy partitioning such that a data point (method) can belong to all groups with different
membership degrees between 0 and 1.
The classification is using majority vote.
The classifiers do not use any model to fit the data and only based on memory.
The KNN uses neighborhood classification as the predication value of the new query instance.
MERITS
Simple and understandable.
Items are automatically assigned to cluster.
It is unsupervised [10].
It converges.
Easy to implement and debug. There are some noise reduction techniques that work only for k-NN that can be effective in improving the accuracy of the classifier. [11]
DEMERITS
The performance of the algorithm depends on the initial centroids. So the algorithm gives no guarantee for an optimal solution, corresponding to the global objective function minimum.
User needs to specify the number of clusters in advance.
It does not ensure that it converges to an optimal solution, because the initial centroids are randomly initialized.
Long computational time.
Sensitivity to noise and One expects low membership degree for outliers [10].
Poor run-time performance if the training set is large [11]. Very sensitive to irrelevant or redundant features [11].
APPLICATIONS Image retrieval systems, Finding
centers in cartography.
Analysis of non-pre-processed FTIR Data Processing, image segmentation.
Feature Projections Classifier to Text Categorization.
REFERENCES
Application Research of k-means Clustering Algorithm.
Hong Liu, Xiaohong Yu.
Fuzzy C- Means Algorithm- A Review.
R.Suganya, R.Shanthi
k-Nearest Neighbor Classifiers. P´adraig Cunningham and Sarah Jane Delany.
Based on the various constraints and conventions, it was observed that the Fuzzy c-means algorithm is the most widely used algorithm of all the three.
6.
ACKNOWLEDGMENTS
The authors would like to thank their mentor Mr. Devender Banga, for his valuable inputs and guidance. They also thank their institution for providing them the required facilities and constant support.
7.
REFERENCES
[1] Joseph P.Bigus. “Data Mining With Neural Networks”,Mcgraw-Hill (Tx), 1996
[2] Paulraj Pooniah. “Data Warehousing Fundamentals”, Wiley; 2 edition (May 24, 2010).
[3] Jain, A. K. and Dubes, R. C. (1988) Algorithms for Clustering Data. Prentice Hall, Englewood Cliffs, NJ. [4] Shiv Pratap, Singh Kushwah, KeshavRawat and Pradeep
Gupta. Analysis and Comparison of Efficient Techniques of Clustering Algorithms in Data Mining.
[5] Arpit Gupta, Ankit Gupta and Amit Mishra.Research Paper On Cluster Techniques Of Data Variations, IJATER, 2011 Volume 1.
[6] Yi Liu, Rong Jin, and Anil K. Jain. “BoostCluster: Boosting Clustering by Pairwise Constraints”, KDD 2007, USA.
[7] Anil K. Jain, Alexander Topchy, Martin H.C. Law,and Joachim M. Buhmann. “Landscape of Clustering Algorithms.” ICPR 2004, Vol.1
[8] Raymond T. Ng and JiaweiHany. “Efficient and Effective Clustering Methods for Spatial Data Mining”. 20th VLDB Conference, 1994
[9] Shiv Pratap Singh Kushwah, KeshavRawat, Pradeep Gupta. “Analysis and Comparison of Efficient Techniques of Clustering Algorithms in Data Mining”, IJITEE 2012, Volume 1, Issue 3.
[10]R.Suganya, R.Shanthi . “Fuzzy C- Means Algorithm- A Review” IJSRP, Volume 2, Issue 11, November 2012 Edition.
[11]P´adraig Cunningham1 and Sarah Jane Delany. “k-Nearest Neighbour Classifiers Technical Report”, UCD-CSI-2007-4March 27, 2007
[12]A.K.Jain, M.N. Murty and P.J. Flynn. “Data Clustering:
A Review” ACM Computing Surveys, Vol. 31, No. 3,