Enhancement of Linearity of Optical Density
in Automated Analyzer
Maninder Preet Singh
Student
Centre for Development Of Advanced Computing A Scientific Society of The Ministry Of Communication And Information Technology,
(Govt. Of India)
A-34, Industrial Area, Phase Vlll, Mohali
Vikas Kumar Goel
Sr. Project Manager at C-DAC, Mohali. Centre for Development Of Advanced Computing
A Scientific Society of The Ministry Of Communication And Information Technology,
(Govt. Of India)
A-34, Industrial Area, Phase Vlll, Mohali
ABSTRACT
The value of absorption of light energy is dependent on the number of molecules present in absorbing material and the thickness of the medium. Thus, intensity of light energy leaving the absorbing substance is used as an indication of concentration of that particular substance. If the thickness i.e. path length of the light energy in the sample holder, normally the flow through cell and intensity of incident light energy are kept constant, then the amount of light energy transmitted out of the absorbing media is proportional to the concentration of the media. Usually the transmitted light energy and concentration are related to Lambert’s and Beer’s law of photometry. However, the Lambert’s and Beer’s law of photometry is valid or linear up to the optical density of 2.0. In the presented work, it is proposed to facilitate the Lambert’s and Beer’s law of photometry to go beyond optical density of 2.0 and measure the concentrations of sample at high value.
Keywords
OD Optical Density, SCU Signal Conditioning Unit, ADC Analog /Digital Converter
1. INTRODUCTION
The absorption of light by a substance can be quantized for practical use with the help of two basic laws. Beer’s Law: When a beam of monochromatic light enters an absorbing medium, the intensity of light coming out decreases exponentially with the increase in the concentration of light-absorbing constituent in the medium. Lambert’s Law: This law states that, under similar conditions, that the intensity of light coming out decreases exponentially with the increase in the length of the medium through which light passes. The following quantitative relationships can be drawn.
2.
RELATED
WORKS
Colorimetry is a powerful sensing principle that detects a target analyte based on a reaction induced colour change. The approach can be highly sensitive and selective when a sensing material that reacts specifically with the analyte is found, but the specific reaction is usually accompanied by slow recovery and irreversibility, making continuous monitoring of air quality difficult. Consequently, colorimetry is often one-time only and single-point measurement. To overcome the difficulty, the present work reports a combined microfluidic and colorimetric approach that measures time evolution of a
colour gradient along a microfluidic channel via a complementary metal-oxide-semiconductor (CMOS) imager. The change of the colour gradient provides continuous monitoring of the analyte concentration over many hours, and the principle and capability of the approach is demonstrated by theoretical simulation, and experimental validation with real samples.[1]
The bio-chemical analyzer (BCA) is a kind of instrument which is used to measure some clinical or chemical targets in samples (blood). Since light source’s energy is different and samples have different spectrum absorbance in different wavelength. Energy attenuation of ultraviolet (UV) wavelength is large; otherwise. The noise which exist in the electronic circuits and the astigmatism which exist in the ray-route system, both of which will reduce the luminosity nicety in the UV wave-band. In this paper, Virtual Instrument (VI) technique and the method of software optimizing algorithm are used to enhance measurement veracity of the luminosity value, and the exposure time of linear CCD is auto-adjusted to expose separately for strong light and week light. From experiment results, we can obtain that the capability and signal to noise ratio (SNR) of the system are greatly improved, the spectrum range of spectrophotometer for BCA can reach 300 ~ 800nm and the distinguish of wavelength is less than 10nm. [2]
The “Gold standard” for testing blood glucose in Colorimeters is the measurement of glucose in a plasma sample obtained from a vein. This method involves a chemical reaction activated by an enzyme called Glucose Oxidase. Most of the Colorimeters used for the Glucose measurement in Clinical laboratories perform well in the 100 - 400mg/dL range of blood glucose. Due to the requirement of highly monochromatic source and photo detector, an error of 5 to 20% is common in these Colorimeters. This paper aims to mitigate the error in measurement by modernizing the plasma glucose testing equipment i.e., Colorimeter with White Source and Colour Sensor through Colour measurement technique for better clinical diagnosis. As presumed, experimental results show that this modified Colorimeter can perform well with better accuracy even above the Glucose concentration of 400 mg/dL.[3]
11 are discussed, and the considerations leading to the choice of
photo-cells for the analyzers are considered. The analyzing equipment and the means of achieving positive identification of samples are described. The requirements for controlling the machine are discussed and the application of computer-control to the machine and the logging of output data is described. [4]
Clinical laboratories have the responsibility for providing a variety of tests that are crucial to the prevention, diagnosis, and treatment of disease. Currently, they are faced with a growing task in that the half billion tests they now perform annually will double within the next 5 years under the stress of an increasing demand for health services. This is a critical problem whose solution lies in the automation of these laboratories since technical help is in short supply and would be too costly to employ in the amounts needed even if they were available. This paper deals with some of the social, medical, and technical considerations surrounding the automation of them laboratories, and research and development activities of significance. It is imperative that engineers join with clinical scientists in these efforts, as their contributions in the area of basic and applied research and in the development of the instruments, devices and systems required for total automation of the clinical laboratory are particularly important. [5]
A recent development of interest in analytical instrumentation provides a system for the continuous automatic determination of a wide variety of biochemically important compounds by colorimetry. The system is controlled by a multichannel, peristaltic proportioning pump which accurately delivers fixed volume ratios of samples and reagents to other components. Purification or separation of the constituent to be analyzed is effected by continuous dialysis and, after appropriate chemical treatment, optical density is measured in a ratio-recording dual beam colorimeter fitted with a flow curette. The system can analyze different samples on a continuous basis or monitor changes in a continuous sample stream. Operations require a minimum of technical attendance. The system has application in many areas of medical research: routine determination of classical clinical constituents for diagnosis and treatment; study of chemical pharmacology in vivo and in vitro; biochemical aspects of proteins, amino acids, and enzymes; organ and tissue perusal studies in physiology; microbial metabolism and assay; screening of experimental pharmacodynamics agents. The design and operation of the instrument system will be treated in general terms and the application and results in the aforementioned fields of research will be discussed. Economies in time and financial expenditure will be summarily noted.[6]
Ultraviolet/visible (UV/VIS) absorption spectroscopy has been used in the clinical laboratory for many years. The technique has appeal, as it is almost universal in its application. Although much of the routine work is performed using high-throughput dedicated clinical analysis systems, absorption spectroscopy still has a place in most clinical laboratories. [7]
3.
ABSORBANCE
When a light beam is passed through a solution contained in a transparent glass vessel, it interacts with the solution in following ways:
Part of the light beam is absorbed by the solution.
Some part is transmitted through the solution.
And balance is reflected back.
Fig1: Absorbance
Absorbance is also termed as optical density. The light absorbed by a solution is dependent on no. of molecules present in the solution. The absorbed light is not measurable, therefore, the intensity of transmitted light may be used as an indication of the concentration of solution.
Say, I0 and It be the intensity of incident and transmitted light respectively,
Then, the ration of intensity of transmitted light to incident light is known as TRANSMITTANCE (T).
Thus, Transmittance T = It / I0
Or % Transmittance (%T) = (It / I0) x 100
The logarithm to the base 10 of reciprocal of the transmittance is known as ABSORBANCE.
Hence, Absorbance = log10(1 / T) Or
= log10(I0 / It)
As we know, Absorbance = log10(1 / T)
Optical density is given by:
OD= log10(100 / T)
Or = log10(100) - log10(T)
= log10(10)2 - log10(T) = 2 log10(10) - log10(T)
= 2 - log10(T) { log10(10) = 1}
4.
O
PTICALD
ENSITYE
NHANCEMENTThe optical density of sample can ideally go maximum up to 2.0. This can be mathematically obtained from the above given equation.
Get three to five samples of samples with typical optical densities in multiples.
Make suitable dilutions of these samples, so that the final OD is the range between 0.1 and 0.25.
Recalculate the ODoff-line of undiluted samples by multiplying these values with the used dilution factors.
Enter the specified pairs of ODprimary and ODoff-line values for computing the calibration polynomial.
The best fitted polynomial between ODprimary and ODoffline represents the user-defined ODoff-line value. The OD values may go beyond 2.0 to 3.0 in this way. The same procedure may be adopted to go beyond 3.0 optical densities. But at very high sample concentrations, other non-linear factor will also contribute in non-non-linear optical density. Therefore, that modeling is must before going for further OD enhancement
5.
R
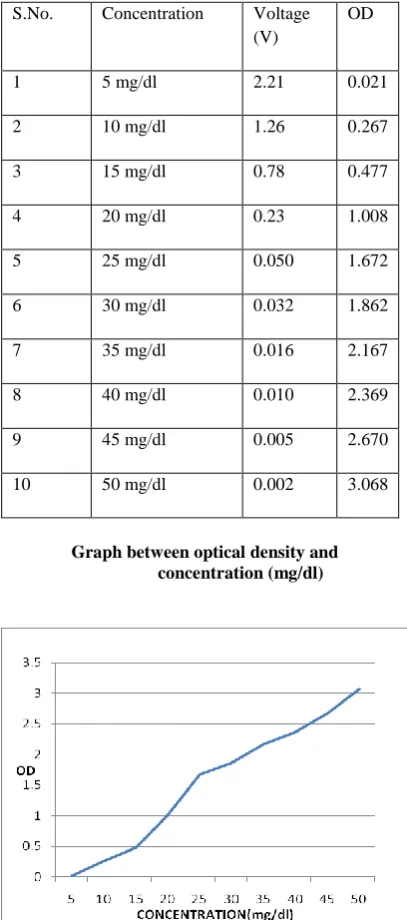
ESULTS [image:3.595.347.551.152.613.2]The ODs are computed using the voltage signals obtained using the photodiode followed by signal conditioning unit and ADC circuit. Normally, all the ODs are computed with respect to water. Water is taken as reference liquid with 100% transmission of light or the most dilute liquid with sample concentration of zero. The OD calibration curve is shown in fig. given below at selected filters.
Table 1- filter 340nm
Table 2- filter 405nm
Table 1
OD Vs Voltages at Filter 340 nm
Voltage with Water, V
H2O= 2.34
S.No. Concentration Voltage (V)
OD
1 5 mg/dl 2.21 0.021
2 10 mg/dl 1.26 0.267
3 15 mg/dl 0.78 0.477
4 20 mg/dl 0.23 1.008
5 25 mg/dl 0.050 1.672
6 30 mg/dl 0.032 1.862
7 35 mg/dl 0.016 2.167
8 40 mg/dl 0.010 2.369
9 45 mg/dl 0.005 2.670
10 50 mg/dl 0.002 3.068
13
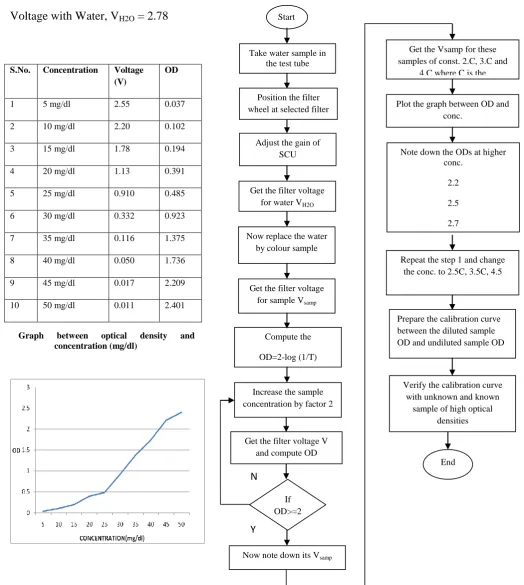
Table 2
OD Vs Voltages at Filter 405 nm
Voltage with Water, V
H2O= 2.78
Flow Diagram of given Methodology:
S.No. Concentration Voltage
(V)
OD
1 5 mg/dl 2.55 0.037
2 10 mg/dl 2.20 0.102
3 15 mg/dl 1.78 0.194
4 20 mg/dl 1.13 0.391
5 25 mg/dl 0.910 0.485
6 30 mg/dl 0.332 0.923
7 35 mg/dl 0.116 1.375
8 40 mg/dl 0.050 1.736
9 45 mg/dl 0.017 2.209
10 50 mg/dl 0.011 2.401
Verify the calibration curve with unknown and known
sample of high optical densities
Repeat the step 1 and change the conc. to 2.5C, 3.5C, 4.5 Note down the ODs at higher
conc.
2.2
2.5
2.7
Plot the graph between OD and conc.
Get the Vsamp for these samples of const. 2.C, 3.C and
4.C where C is the
concentration at OD=2.0
Now note down its Vsamp If
OD>=2 Get the filter voltage V
and compute OD Increase the sample concentration by factor 2
Compute the
OD=2-log (1/T) Get the filter voltage
for sample Vsamp Now replace the water
by colour sample Get the filter voltage
for water VH2O Adjust the gain of
SCU Start
Take water sample in the test tube
Position the filter wheel at selected filter
Prepare the calibration curve between the diluted sample OD and undiluted sample OD
End
Y
N
Graph between optical density and
CONCLUSION
The presented work gives an easy and convenient tool for enhancing the optical density of the beyond 2.0. A fine accuracy has been observed while using the calibration curve when plotted for different wavelengths. The enhanced optical density computation and calibration can be programmed in the microcontroller of the bio-chemistry instruments so that the auto-checking of high concentration samples are tested out with some flags so that the user or lab personnel’s are aware that the sample is of high concentration.
REFERENCE
[1] Rui Wang, Amlendu Prabhakar, Rodrigo A. Iglesias, Xiaojun Xian, Xiaonan Shan, Francis Tsow, Erica S. Forzani, and Nongjian Tao 2012 A Microfluidic-Colorimetric Sensor for Continuous Monitoring of Reactive Environmental Chemicals.
[2] Zhong Ren , Guodong Liu , Zhen Huang , Lvming Zeng , Bilin Shao 2008. “Research of spectrophotometer for bio-chemical analyzer based on automatic adjustment of the integration time of linear CCD” National Natural Science Foundation of China
[3] A.Sivanantha Raja, K.Sankaranarayanan 2007 “Performance analysis of a Colorimeter” International Conference on Intelligent and Advanced Systems.
[4] R. Wyld 1972 “An Automatic Biochemical Analyser” The Radio and Electronic Engineer.
[5] James F. Dicson 1969“Automation of Clinical Laboratories”.
[6] Jacques M. Kelly 1961“Application of Continuous Automatic Colorimetry in Medical Research” IRE Transections on Biomedical Electronics.