http://dx.doi.org/10.4236/wjcs.2014.47019
How to cite this paper: Rajput, R.S., Das, S., Chauhan, S., Bisoi, A.K. and Vasdev, S. (2014) Comparison of Cardiac Output
Comparison of Cardiac Output
Measurement by Noninvasive Method
with Electrical Cardiometry and Invasive
Method with Thermodilution Technique
in Patients Undergoing Coronary Artery
Bypass Grafting
Randhir Singh Rajput1, Sambhunath Das1, Sandeep Chauhan1, A. K. Bisoi2, Sumit Vasdev1
1Department of Cardiothoracic and Vascular Anaesthesia, CN Centre, All India Institute of Medical Science, New Delhi, India
2Department of Cardiothoracic and Vascular Surgery, CN Centre, All India Institute of Medical Science, New Delhi, India
Email: [email protected]
Received 9 May 2014; revised 9 June 2014; accepted 9 July 2014
Copyright © 2014 by authors and Scientific Research Publishing Inc.
This work is licensed under the Creative Commons Attribution International License (CC BY).
http://creativecommons.org/licenses/by/4.0/
Abstract
Conclusions: The present study indicates that the electric cardiometry device yields numerically comparable results to cardiac outputs derived from the PAC during the cardiac surgery. Therefore, electrical cardiometry can be used to evaluate haemodynamic variables with clinically acceptable accuracy, when invasive methods are to be avoided or not available.
Keywords
Electric Cardiometry, Thermodilution, Pulmonary Artery Catheter, Non Invasive Cardiac Output, Thoracic Electrical Bioimpedance
1. Introduction
Assessment of the cardiac output (CO) is recommended during the initial evaluation of haemodynamically com-promised patients, which often takes place in the operating room, emergency department or the intensive care unit (ICU) [1] [2]. The thermodilution method of deriving CO using a pulmonary artery catheter (PAC) is con-sidered as the gold standard for measuring cardiac output [3] [4]. The invasive character of PAC derived CO and associated risks [5]-[7] have led to an increased interest in non invasive methods [8] to monitor cardiac output.
Electrical Cardiometry (EC) is a new monitor for non-invasive method of measuring continuous cardiac out-put monitoring based on measurement of thoracic electrical bioimpedance. Bioimpedance CO is based on the principle that cyclical increases in blood volume in the great vessels, as well as alignment of red blood cells in the thoracic aorta resulting from increased velocity, cause concomitant decreases in the electrical impedance in the chest. An alternating current of low amplitude is introduced and simultaneously sensed by electrodes placed around the neck, and laterally on the thorax to measure thoracic electrical bioimpedance. Changes in thoracic bioimpedance are induced by ventilation and pulsatile blood flow, and processing of the signal results in a cha-racteristic impedence (Z) waveform. For measurement of Stroke volume (SV), only the cardiac-induced pulsa-tile component of the total change in electrical impedance is analyzed (dZ/dt), as the respiratory component is filtered out. EC interprets the maximum change in thoracic electrical bioimpedance as the ohmic equivalent of the mean aortic blood flow acceleration and further transforms it into an equivalent of mean aortic blood flow velocity.
Electrical Cardiometry (EC) is often confused with the traditional bioimpedance technology most commonly known as impedance cardiography (ICG). Though both methods use sensors placed on the thorax, traditional bioimpedance or ICG methods rely on the assumption of periodical volumetric changes in the aorta to determine SV and cardiac output (CO). In short, ICG attributes the steep increase in the conductivity waveform (dZ) to a volumetric expansion of the aorta during systole, while EC contributes the increase in conductivity to the orien-tation change of the RBCs to determine the velocity of the blood flow. Thus, the algorithm and evident accuracy of EC compared to ICG is what separates the two methods. EC method may be used for measuring cardiac out-put in a wide spectrum of diseases and patient populations including neonates and children, while ICG is limited to relatively healthy adults.
Cardiac output measurement using EC has been studied in post operative period especially in ICU. Very few studies have been conducted for monitoring CO using EC in open chest cardiac surgery. Hence, in this study we compared the EC with the routinely established method of TDCO by PAC during coronary artery bypass graft-ing (CABG) usgraft-ing cardio pulmonary bypass (CPB).
2. Materials and Methods
2.1. Patients & Clinical Procedures
medica-tions, mechanical ventilation and IABP and coagulopathies. Premedication consisted of intramuscular 0.1 mg/kg morphine and 0.5 mg/kg promethazine. After applying pulse oximeter and five lead EKG, venous access was established and right radial artery cannulation was done after infiltration of local anesthetic. Induction of anaes-thesia was performed with thiopentone 4 mg/kg, fentanyl 3 ug/kg and rocuronium 1 mg/kg. After intubation of the trachea, the lungs were ventilated with 50% oxygen in air. The ventilator rate was adjusted to maintain an end tidal carbon dioxide of 35 - 40 mm Hg. A balloon tipped, flow-directed PAC (7.5F, Edwards, Irvine, CA) was placed via the right internal jugular vein up to the wedge position and the correct position was confirmed by pressure tracings. The PAC was connected to Philips IntelliVue monitor. The Electrical cardiometry monitor was set up by applying four surface sensors first: approx 5 cm above left base of the neck, second on the left base of neck, third on the lower left thorax at level of xiphoid and the fourth one on the lower left thorax approx 5 cms below the 3rd electrode at the level of anterior axillary line. Electrical cardiometry monitor (Electrical Cardiometry monitor, ICON Cardiotronics, Inc., La Jolla, CA 92307; Osypka Medical GmbH, Berlin, Germany) was connected to the sensor cable and the patient data were fed.
2.2. Data Recording
The double Cardiac output data were obtained, one from electric cardiometry site and second from the PAC at same point of time and at six predefined time intervals: (1) T1, 10 min after anesthetic induction when arterial cannula and PAC were in situ and electric cardiometry electrode had been placed (2) T2, 10 min after skin inci-sion (3) T3, 10 min after sternotomy, (4) T4, before going to CPB (5) T5, 10 min after sternal closure (6) T6, after skin closure. The thermodilution CO measurements with the PAC were performed with injections of 10 ml of ice-cold 0.9% saline. The average of three readings was taken. None of the measurements were recorded dur-ing a hemodynamically unstable phase, durdur-ing arrhythmias or directly after vasopressor bolus or modification. The results were analyzed in a comparison of cardiac outputs at the six time points between Electrical Cardi-ometry and thermodilution technique.
2.3. Statistical Analysis
Statistical analysis was performed using the method described by Bland and Altman [9]. Bias was defined as the mean difference between cardiac outputs derived from two sites or methods. Limits of agreement were calcu-lated arbitrarily as ±1.96 SD of the bias. The percentage error (1.96 SD/mean CO) was calcucalcu-lated according to Critchley and Critchley [10] for comparison of CO values. The precision of the reference PAC derived CO was measured within the study according to Cecconi et al. [11] as
PAC
Precision = ×2 CE
where CE = coefficient of error and
CE=CV n
where CV = coefficient of variation of single measurement n = number of measurements.
The coefficient of variation (CV) was calculated as the standard deviation divided by mean. The precision of the cardiac output derived from femoral artery (FEMCO) using FloTrac/Vigileo system and TEB was calculated. (17)
(
) (
2)
2b a b a
Precision = PE − − precision
(
) (
2)
2c a c a
Precision = PE− − precision
Precisionb = precision of the cardiac output from femoral artery (FEMCO), Precisionc = precision of the cardiac output from electric cardiometer (TEBCO),
Data are given as mean and the 95% confidence interval of the mean or the SD as appropriate. Accuracy of the noninvasive devices was defined as the agreement between thermodilution cardiac output (TD-CO) and FEMCO assessed measurements using the method of Bland and Altman.
We used ROC analysis to better illustrate the trending capability of TEBCO. The change in TEBCO needed to predict an acute change in CO larger than 15% of TDCO was tested. The Sensitivity and specificity of cutoff value to predict change in TDCO was used to create a Receiver Characteristic curves analysis with a cutoff val-ue of 15% [12].
To test the inter-changeability of the technique, mountain plot tool was used as complementary to Bland and Altman method is used [13]. A P value < 0.05 was considered significant.
3. Results
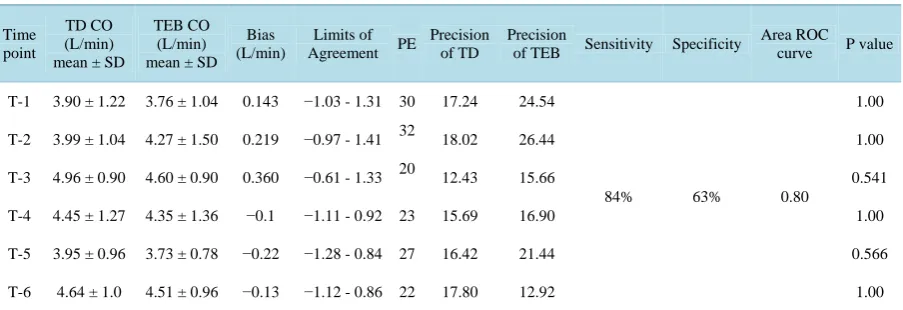
The 25 patients included in the study, at the 6 time point interval generated 300 data of cardiac output in total for analysis. The demographic data of the patients are listed in Table 1. The hemodynamic data over the different time intervals is given inTable 2.
A total of 300 data of cardiac output data were compared with TDCO and TEBCO. The TDCO value range from 1.8 - 6.9 L·min−1 with a mean of 4.39 ± 1.16 L·min−1 and TEBCO range from 1.8 - 7.1 L·min−1 with a mean of 4.21 ± 1.16 L·min−1.
The averaged Bland-Altman analysis for TDCO and TEBCO (Figure 1) revealed a mean bias of 0.18 and limits of agreement were −1.25 - 0.89 L·min−1
and the percentage error (PE) ranges from 22% - 32%. The preci-sion for the TDCO was measured to be ±16.2% and the precipreci-sion for TEBCO was ±19.6%.
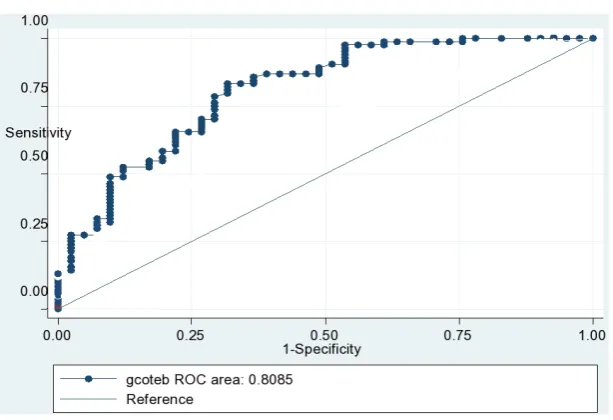
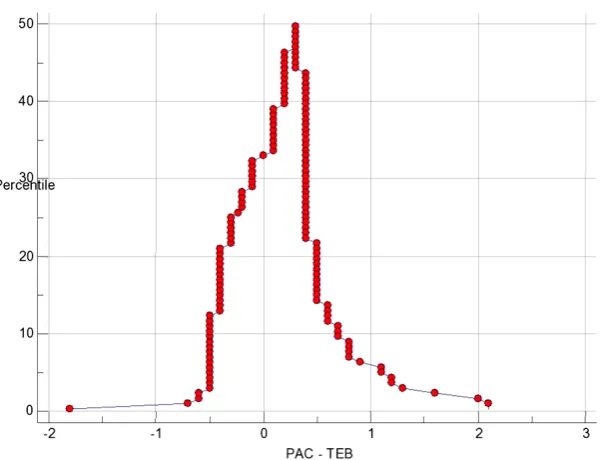
[image:4.595.87.539.543.698.2]It is desirable for TEBCO to be both highly sensitive and highly specific for acute changes in CO. A 15% change of TEBCO values were examined and the sensitivity and specificity of these values to detect an acute change in TDCO was calculated and plotted (Figure 2). The overall performance of a device can be described by the area under the ROC curve, the larger the area, the better the performance. Mountain plot between TDCO and TEBCO (Figure 3) shows a median percentile of 0.25 and value of 97.5 percentile is 1.525.
Table 1. Demographic data (Patients n = 25).
Age (years) 62.32 ± 5.12
Gender (M/F) 20/5
Height (cm) 163.8 ± 9.56
Weight (Kg) 67.36 ± 9.70
BSA (cm2) 1.630 ± 0.201
(BSA-Body Surface Area).
Table 2. Comparison of TDCO and TEBCO.
Time point
TD CO (L/min) mean ± SD
TEB CO (L/min) mean ± SD
Bias (L/min)
Limits of Agreement PE
Precision of TD
Precision
of TEB Sensitivity Specificity
Area ROC curve P value
T-1 3.90 ± 1.22 3.76 ± 1.04 0.143 −1.03 - 1.31 30 17.24 24.54
84% 63% 0.80
1.00
T-2 3.99 ± 1.04 4.27 ± 1.50 0.219 −0.97 - 1.41 32 18.02 26.44 1.00
T-3 4.96 ± 0.90 4.60 ± 0.90 0.360 −0.61 - 1.33 20 12.43 15.66 0.541
T-4 4.45 ± 1.27 4.35 ± 1.36 −0.1 −1.11 - 0.92 23 15.69 16.90 1.00
T-5 3.95 ± 0.96 3.73 ± 0.78 −0.22 −1.28 - 0.84 27 16.42 21.44 0.566
T-6 4.64 ± 1.0 4.51 ± 0.96 −0.13 −1.12 - 0.86 22 17.80 12.92 1.00
2.0
1.0
0.0
-1.0
-2.0
-2.5 -1.5 -0.5 0.5 1.5
+1.96 SD
Mean
1 2 3 4 5 6 7 8
Mean of TEB and PAC
0.89
-0.18
[image:5.595.161.465.86.275.2]-1.25 -1.96 SD
Figure 1. Bland Altman analysis of TEBCO and TDCO. Shows bias = 0.18 (solid line). Standard deviation = 0.50. The dashed lines indicate the limits of agreement (1.96 times the standard deviation).
Figure 2. Receiver operator characteristic curve demonstrating the ability of TEBCO to detect 15% change in TDCO, yield 84% sensitive and 63% specificity for TEBCO in identifying an acute change in CO.
4. Discussion
In the present study, two different methods for cardiac output measurement were compared to see the efficiency of new transthoracic bioimpedence device. The results of the present study indicate that the device yields nu-merically comparable results to cardiac outputs from the PAC during cardiac surgery.
[image:5.595.161.468.314.524.2]Figure 3. Mountain plot between TDCO and TEBCO shows median percentile of 0.25 and 97.5 percentile of 1.525.
By combining the errors of both the test and the reference method using an errorgram, Critchley and colleagues demonstrated that a mean percentage error of approximately 30% between two different methods is clinically acceptable if the inherent errors in both techniques are similar to the expected error in thermodilution CO mea-surements. Thus, according to objective criteria, the agreement between TEBCO and TDCO, which was as-sessed in the present study, can be judged as acceptable, and these two techniques can be used interchangeably.
The CO measured from two sites at same point of time demonstrated increase in mean CO at post CPB as compared to the pre CPB period. This difference could be due to vasodilatation seen after bypass which leads to increase in cardiac output in relation to a low systemic vascular resistance. The bias between TEBCO and TDCO was small, the limits of agreement were narrow and the percentage error was within acceptable limits are comparable at pre and post CPB which shows that all three monitoring device are comparable during different time of cardiac surgery.
Comparing TEBCO with TDCO During transition from T-1 period to T-2 period when sternotomy was done, the analysis shows that the bias between TEBCO and TDCO was small, the limits of agreement were narrow and the percentage error was within acceptable limits are comparable. The percentage error of TEB (T-1) when the chest was closed is 30% and at T-2 when chest was open is 32% which demonstrate that sternotomy had lit-tle or no effect on the cardiac output reading which remain consistently same and comparable with that of
TDCO [16]. Our results are similar from those reported by Sageman et al. [17], Gujjar et al.[18], Suttner et al.
[19], and Chakravarthy et al. [20], who found TEB technology accurate and interchangeable with TD in post cardiac surgical patients.
Sharma et al. [21] measured CO with NICOMON based on transthoracic electrical bioimpedance and com-pared it with thermodilution method in patients after off pump coronary artery bypass graft surgery and the ef-fect of ventilation(mechanical and spontaneous) on CO. They conclude a fair correlation between TD CO and TEB CO measurement among post-OPCAB patients during controlled ventilation. However correlation was weak in spontaneously breathing patients.
The technique of cardiac accelerometry may be sensitive to the placement of the electrodes on the body, vari-ations in patient body size, and other physical factors that impact on electric conductivity between the electrodes and the skin (e.g., temperature and humidity) [22] [23].
[image:6.595.166.468.80.310.2]no side effect or complication, work in patient with AF, arrhythmia, pacing and not associated with any compli-cation. The disadvantage associated with electric cardiometry was that the parameters are not available during electrical interference (electric cautery).
5. Conclusion
In conclusion we found a fair correlation between cardiac output measurement by noninvasive method with electric cardiometry and invasive gold standard method with thermodilution derived pulmonary artery catheter. Electric cardiometry can provide cardiac output evaluation with clinically acceptable accuracy. Therefore, elec-trical cardiometry can be used to evaluate haemodynamic variables in cardiac surgical patients, when invasive methods are to be avoided or not available.
Limitations
The present study had enrolled small numbers of patients. The postoperative ICU data were not analyzed. Less number of Female patients, so chance of gender bias.
References
[1] Dellinger, R.P., Carlet, J.M., Masur, H., et al. (2004) Surviving Sepsis Campaign Management Guidelines Committee. Surviving Sepsis Campaign Guidelines for Management of Severe Sepsis and Septic Shock. Critical Care Medicine, 32, 858-873.http://dx.doi.org/10.1097/01.CCM.0000117317.18092.E4
[2] Shoemaker, W.C., Wo, C.C., Chan, L., et al. (2001) Outcome Prediction of Emergency Patients by Noninvasive Hae-modynamic Monitoring. Chest, 120, 528-537.http://dx.doi.org/10.1378/chest.120.2.528
[3] Swan, H.J.C., Ganz, W., Forrester, J., et al. (1970) Catheterization of the Heart in Man with Use of a Flow-Directed Balloon-Tipped Catheter. The New England Journal of Medicine, 283, 447-451.
http://dx.doi.org/10.1056/NEJM197008272830902
[4] De Waal, E.E.C., De Rossi, L. and Buhre, W. (2006) Pulmonary Artery Catheter in Anaesthesiology and Intensive Care. Anaesthesist, 55, 713-730.
[5] Connors Jr., A.F., Castele, R.J., Farhat, N.Z., et al. (1985) Complications of Right Heart Catheterization. A Prospective Autopsy Study. Chest, 88, 567-572.http://dx.doi.org/10.1378/chest.88.4.567
[6] Peters, S.G., Afessa, B., Decker, P.A., et al. (2003) Increased Risk Associated with Pulmonary Artery Catheterization in the Medical Intensive Care Unit. Journal of Critical Care, 18, 166-171.http://dx.doi.org/10.1016/j.jcrc.2003.08.006
[7] Robin, E.D. (1987) Death by Pulmonary Artery Flow-Directed Catheter. Time for a Moratorium? Chest, 92, 727-731.
http://dx.doi.org/10.1378/chest.92.4.727
[8] Chaney, J.C. and Derdak, S. (2002) Minimally Invasive Hemodynamic Monitoring for the Intensivist: Current and Emerging Technology. Critical Care Medicine, 30, 2338-2345.http://dx.doi.org/10.1097/00003246-200210000-00025
[9] Bland, J.M. and Altman, D.G. (1986) Statistical Method for Assessing Agreement between two Methods of Clinical Measurements. Lancet, 8476, 307-310.http://dx.doi.org/10.1016/S0140-6736(86)90837-8
[10] Critchley, L.A. and Critchley, J.A. (1999) A Meta-Analysis of Studies Using Bias and Precision Statistics to Compare Cardiac Output Measurement Techniques. Journal of Clinical Monitoring and Computing, 15, 85-91.
http://dx.doi.org/10.1023/A:1009982611386
[11] Cecconi, M., Rhodes, A., Poloniecki, J., et al. (2009) Bench-to-Bedside Review: The Importance of the Precision of the Reference Technique in Method Comparison Studies—With Specific Reference to the Measurement of Cardiac Output. Critical Care, 13, 201.http://dx.doi.org/10.1186/cc7129
[12] Cook, N.R. (2010) Methods of evaluating novel biomarkers—A New Paradigm. International Journal of Clinical Practice, 64, 1723-1727.http://dx.doi.org/10.1111/j.1742-1241.2010.02469.x
[13] Krouwer, J.S. and Monti, K.L. (1995) A Simple, Graphical Method to Evaluate Laboratory Assays. European Journal of Clinical Chemistry and Biochemistry, 33, 525-527.
[14] Mackenzie, J.D., Haites, N.E. and Rawles, J.M. (1986) Method of Assessing the Reproducibility of Blood Flow Mea-surement: Factors Influencing the Performance of Thermodilution Cardiac Output Computers. British Heart Journal, 55, 14-24.http://dx.doi.org/10.1136/hrt.55.1.14
[15] Stetz, C.W., Miller, R.G., Kelly, G.E. and Raffin, T.A. (1982) Reliability of the Thermodilution Method in the Deter-mination of Cardiac Output in Clinical Practice. American Review of Respiratory Disease, 126, 1001-1004.
Cardiac Output during Cardiac Surgery: Evaluation of a Second-Generation Bioimpedance Device. Journal of Cardio-thoracic and Vascular Anesthesia, 15, 567-573.http://dx.doi.org/10.1053/jcan.2001.26533
[17] Sageman, W.S., Riffenburg, R.H. and Spiess, B.D. (2002) Equivalance of Bioimpedeceand Thermodilution in Mea-suring Cardiac Index after Cardiac Surgery. Journal of Cardiothoracic and Vascular Anesthesia, 16, 8-14.
http://dx.doi.org/10.1053/jcan.2002.29635
[18] Gujjar, A.R., Muralidhar, K., Banakal, S., Gupta, R., Sathyaprabha, T.N. and Jairaj, P.S. (2008) Non Invasive Cardiac Output by Trans Thoracic Electrical Bioimpedance in Post Cardiac Surgery Patients: Comparison with Thermodilution Method. Journal of Clinical Monitoring and Computing, 22, 175-180.http://dx.doi.org/10.1007/s10877-008-9119-y
[19] Suttner, S., Schollhorn, T., Boldt, J., Mayer, J., Rohm, K.D., Lang, K., et al. (2006) Non Invasive Assessment of Car-diac Output Using Trans Thoracicelectrical Bioimpedance in Hemodynamically Stable and Unstable Patients after Cardiac Surgery: A Comparison with Pulmonary Artery Dilution. Intensive Care Medicine, 32, 2053-2058.
http://dx.doi.org/10.1007/s00134-006-0409-x
[20] Chakravarthy, M., Rajeev, S. and Jawali, V. (2009) Cardiac Index Measurement by Invasive, Semi Invasive and Non Invasive Techniques: A Prospective Studying Postoperative Off Pump Coronary Artery Bypass Surgery Patients. Journal of Clinical Monitoring and Computing, 23, 175-180.http://dx.doi.org/10.1007/s10877-009-9179-7
[21] Sharma, V., Singh, A., Kansara, B. and Karlekar, A. (2011) Comparison of Transthoracic Electrical Bioimpedance Cardiac Output Measurement with Thrmodilution Method in Post Coronary Artery Bypass Graft Patients. Annals of Cardiac Anaesthesia, 14, 104-110.
[22] Marik, P.E., Pendelton, J.E. and Smith, R. (1997) A Comparison of Hemodynamic Parameters Derived from Transtho-racic Electrical Bioimpedance with Those Parameters Obtained by Thermodilution and Ventricular Angiography. C rit-ical Care Medicine, 25, 1545-1550. http://dx.doi.org/10.1097/00003246-199709000-00023
[23] Wang, D.J. and Gottlieb, S.S. (2006) Impedance Cardiography: More Questions than Answers. Current Cardiology Reports, 8, 180-186. http://dx.doi.org/10.1007/s11886-006-0031-0
[24] Sathyaprabha, T.N., Pradhan, C., Rashmi, G., Thennarasu, K. and Raju, T.R. (2008) Noninvasive Cardiac Output Measurement by Transthoracic Electrical Bioimpedence: Influence of Age and Gender. Journal of Clinical Monitoring and Computing, 22, 401-408.http://dx.doi.org/10.1007/s10877-008-9148-6
[25] Imai, M., Hanaoka, Y. and Kemmotsu, O. (1994) Valve Injury: A New Complication of Internal Jugular Vein Cannu-lation. Anesthesia & Analgesia, 78, 1041-1046.
[26] Heath, K.J., Woulfe, J., Lownie, S., et al. (1998) A Devastating Complication of Inadvertent Carotid Artery Puncture. Anesthesiology, 89, 1273-1275.http://dx.doi.org/10.1097/00000542-199811000-00035
currently publishing more than 200 open access, online, peer-reviewed journals covering a wide range of academic disciplines. SCIRP serves the worldwide academic communities and contributes to the progress and application of science with its publication.
Other selected journals from SCIRP are listed as below. Submit your manuscript to us via either