Community Sense and Response Systems
Thesis by
Matthew N. Faulkner
In Partial Fulfillment of the Requirements for the Degree of
Doctor of Philosophy
California Institute of Technology Pasadena, California
2014
c 2014
Acknowledgements
I am indebted to a number of people for their guidance and support throughout my time at Cal-tech. Foremost among these is my advisor, Andreas Krause, who shared his immense enthusiasm for research, taught me that effective communication is an important component of impact, and encouraged me through the twists and turns of my graduate career. I am also particularly grateful to my co-advisors Mani Chandy and Tom Heaton for their thoughtful and friendly advice, and to Joel Tropp and Yaser Abu-Mostafa for their insights towards improving this thesis.
Contents
Acknowledgements iii
Abstract 1
1 Introduction 2
1.1 From smart devices to sensitive devices . . . 3
1.2 The sensed world . . . 3
1.3 Reliable actions from unreliable data . . . 4
1.4 The Caltech Community Seismic Network . . . 5
1.4.1 Community Sensors . . . 6
1.4.2 Applications . . . 6
1.5 Decentralized Event Detection . . . 7
1.5.1 Leveraging “normal” data . . . 10
1.5.2 Learning on smartphones with Coresets . . . 10
1.5.3 Understanding Spatial Phenomena . . . 12
1.6 Contributions and Outline of the thesis . . . 14
2 Related Work 16 2.1 WSNs and Community sensing . . . 16
2.2 Seismic networks . . . 17
2.3 Decentralized detection . . . 19
2.4 Anomaly Detection . . . 19
2.5 Sparse detection . . . 20
2.6 Scan statistics. . . 21
2.7 Basis Learning . . . 21
2.8 Theoretical results on mixtures of Gaussians. . . 22
3 The Caltech Community Seismic Network 23
3.1 Goals . . . 23
3.2 Crowdsourcing environmental sensing . . . 25
3.3 Are consumer sensors adequate? . . . 26
3.4 Systems Challenges. . . 28
3.5 CSN Architecture. . . 30
3.5.1 CSN messages . . . 31
3.5.2 Advantages of Cloud Computing . . . 32
3.6 Desktop Client . . . 33
3.7 Android apps for community sensing . . . 34
3.7.1 Goals and Challenges . . . 34
3.7.2 Design choices . . . 36
3.7.3 An interface of Fragments . . . 36
3.7.4 Event Detection . . . 37
3.7.5 Data Logging . . . 38
3.7.6 Observations about Android for CSR systems . . . 38
4 Decentralized Anomaly Detection 40 4.1 The Decentralized Detection Problem . . . 40
4.2 Online Decentralized Anomaly Detection. . . 43
4.3 Experimental Evaluation. . . 47
4.3.1 Decentralized detection: device-level performance. . . 49
4.3.2 From sensor performance to network performance . . . 50
5 Rapid detection of structured spatial patterns 54 5.1 Preliminaries . . . 55
5.1.1 Lower Bounds for Sensor Performance . . . 55
5.1.2 Analyzing groups of sensors by Geocell. . . 56
5.1.3 Simulation Platform . . . 57
5.2 Naive Event Association . . . 58
5.3 Spatial Aggregation by Geocell . . . 58
5.4 Beyond Geocells: learning spatial dependencies . . . 60
5.4.1 The weak spatial detection problem . . . 61
5.4.2 Detecting sparsifiable events. . . 63
5.5 Sparsifying Basis Learning. . . 69
5.6 Implementation in Wireless Sensor Networks . . . 72
5.6.2 Online Detection . . . 73
5.7 Preserving user privacy . . . 74
5.8 Experiments. . . 76
5.8.1 Synthetic Data . . . 77
5.8.2 Gnutella P2P network data . . . 79
5.8.3 Japan seismic network data . . . 79
5.8.4 Dense and participatory seismic networks . . . 81
6 Coresets for scalable and resource-constrained GMM learning 84 6.1 Background and Problem Statement . . . 87
6.2 Efficient Coreset Construction via Adaptive Sampling . . . 89
6.2.1 Sketch of Analysis: Reduction to Euclidean Spaces . . . 91
6.2.2 Streaming and Parallel Computation . . . 92
6.2.3 Fitting a GMM on the Coreset using Weighted EM. . . 94
6.3 Extensions and Generalizations . . . 94
6.4 Experiments. . . 95
7 Conclusion 98 Bibliography 101 A Supplemental Material: Chapter 6 111 A.1 A Geometric Approach for Mixture of Gaussians . . . 111
A.2 Coresets For Semi-Spherical Mixtures of Gaussians . . . 114
List of Figures
1.1 CSN volunteers contribute data from low-cost accelerometers (left) and from Android
smartphones via the CSN appCrowdShake (right). . . 6
1.2 A satellite-based damage map from Haiti, following the January 12, 2010 earthquake,
depicts localized variation in damage. Sensors could provide such information to
emer-gency teams without waiting for aerial photos. Image provided by Google. . . 8
1.3 A map of peak acceleration amplitudes experienced in Long Beach, California during
the Carson earthquake, as recorded by Signal Hill Petroleum. The map shows large
variations in peak acceleration and the effects of a minor fault line. . . 9
1.4 A coreset for Gaussian Mixture Models is a small, weighted subset of the data that
allows us to fit a model that is “almost as good as” a model fit to the full dataset. The
green bars denote the scalar weightsγj associated with each selected point. . . 11
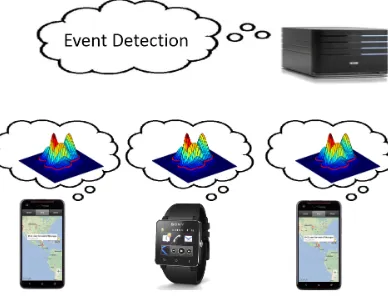
1.5 An architecture for decentralized event detection: each consumer device runs a client
application for modeling its sensor data and transmits pick messages about
poten-tial events. A cloud server receives the stream of pick messages, and detects spapoten-tial-
spatial-temporal events. . . 14
2.1 A CISN sensor station installed in a “borehole”. Installing and maintaining such
sta-tions represents significant investment, but provides exceptional quality. . . 18
3.1 A map of peak acceleration amplitudes during the Carson and Compton earthquakes,
as recorded by Signal Hill Petroleum in Long Beach California. The maps shows large
variations in peak acceleration and the effects of a minor fault line, indicated by the
overlaid line. Information on localized shaking intensity is valuable to emergency teams,
3.2 The low spatial density of many existing sensor networks makes it difficult to
accu-rately reconstruct spatial phenomena from measurements. For example, the Southern
California Seismic Network has roughly 100 sensors in the Los Angeles area. Using
the present configuration of sensors, interpolation provides a crude estimate of an ideal
radial pattern. Increasing the number of sensors allows even simple interpolation to
adequately reconstruct the signal. . . 25
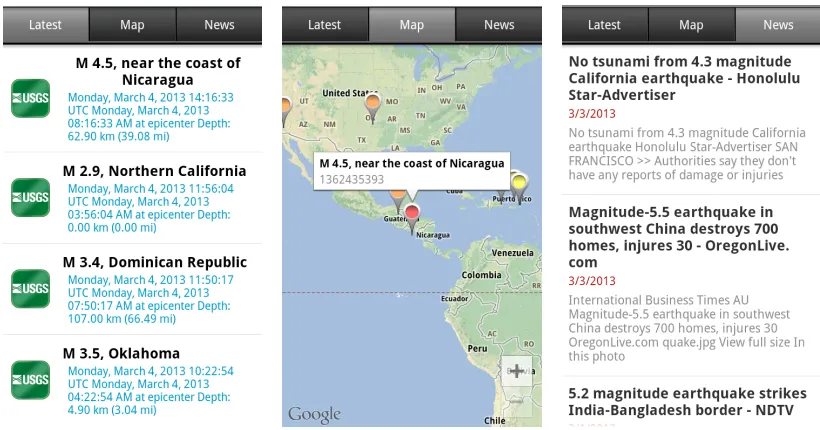
3.3 CrowdShake, a free Android app, allows volunteers to join the CSN network, contribute
data, and access daily information about earthquakes worldwide. . . 26
3.4 A shake table is used to reproduce the acceleration of historic quakes. . . 27
3.5 Android accelerometers accurately record strong shaking during a shake table
experi-ment. (a) Ground truth. (b) Android phone. (c) Android phone in backpack. . . 28
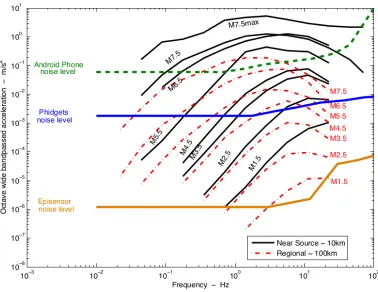
3.6 The accelerometers in smartphones (e.g., Android) and USB sensors (e.g., 16-bit
Phid-get accelerometers) are capable of sensing moderately large earthquakes.
Scientific-quality sensors (e.g., the 24-bit Episensor) are capable of measuring quakes well below
the level of human perception. Figure courtesy of Ming Hei Cheng. . . 29
3.7 Eccentric weights oscillate Millikan Library, demonstrating that CSN hardware can
observe resonant frequencies in buildings. . . 30
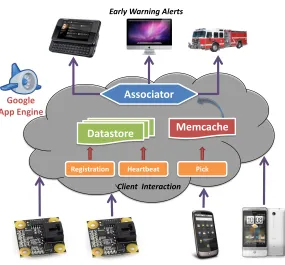
3.8 The CSN cloud maintains the persistent state of the network in Datastore, performs
real-time processing of pick data via Memcache, and serves notifications and data
products. . . 31
3.9 (a) An “Orange Box” sensor station contains a small SheevaPlug computer, a 16-bit
Phidget USB sensor (b), and an optional backup power supply. It allows volunteers to
deploy a sensor with low effort and maintenance. . . 34
3.10 CSN-Droid stores and processes sensor data locally on an Android phone or tablet;
sends pick messages during potential quakes; receives alerts; and responds to data
requests. . . 35
3.11 The CSN-Droid user interface provides a simple Map view of worldwide earthquakes,
and visualized the device accelerometer time series. . . 36
3.12 The distribution of Android OS versions over time shows substantial software
fragmen-tation. Notably, it is rare for the majority of devices to run any single OS version.
Image courtesy of Wikimedia Commons.. . . 38
4.1 (a) Seismic waves (P- and S-waves) during an earthquake. (b) Anticipated user
inter-face for early warning using our Google Android application. (c) 16-bit USB MEMS
4.2 CSN sensors produced picks (blue and red bars) for both P-wave and S-wave of the
Anza M3.6 earthquake. Time series plots are arranged by distance to quake epicenter. 50
4.3 In all plots, the system-level false positive rate is constrained to 1 per year and the
achievable detection performance is shown. (a,b) Sensor level ROC curves on
magni-tude M5-5.5 events, for Android (a) and Phidget (b) sensors. . . 51
4.4 (a) Detection rate as a function of the number of sensors in a 20 km×20 km cell. We
show the achievable performance guaranteeing one false positive per year, while varying
the number of cells covered. (b,c) Detection performance for one cell, depending on
the number of phones and Phidgets. . . 52
4.5 Actual detection performance for the Baja event (100 iterations averaged). Note that
our approach outperforms classical hypothesis testing, and closely matches the
pre-dicted performance. . . 53
5.1 ROC curves for (a) Phidget and (b) Android. (c) Detection performance vs. distance
from epicenter under the guarantee of at most 1 false message per hour for the Phidget
and 1 false message every 5 minutes for the Androids. . . 55
5.2 (a) Single cell of varying number of Phidgets observing 3 levels of seismic events of
M5.5 and lower. (b) Single cell of varying number of Androids observing 3 levels of
seismic events of M5.5 and lower. (c) Number of pick messages received by the system
as a function of time since the event started. . . 56
5.3 Snapshot of simulated detection of a M5.5 event 80 km outside the great Los Angeles
area. There are 100 desktop clients and 1000 Android clients distributed according to
population density. The snapshot is taken 20 seconds after the event occurred. . . 57
5.4 Detection of a M5.5 event with (b) 2000 Androids and (c) 20 Phidgets in the three
scenarios described in Figure 5.5. This result guarantee at most 1 false alarm per
year at the system-wide level. Results computed using the geocell-based association
algorithm are compared to those using the naive algorithm. . . 59
5.5 Regions of different sizes and shapes are activated in different sequence for each of the
three scenarios. The rainbow-colored rings indicate the order of activation. Red: first.
Purple: last . . . 59
5.6 Sparsification ||BTx||
0 ||x||0 exploits spatially coherent activation patterns, while
small||x||0 produces fewer activations. The data are drawn from a quad-tree of height
5.7 Illustration of the transform (a), constant b0 not shown. (b) Latent Tree Model for
d = 2 and p = 4. The sensors y measure the pattern x = [x1, . . . , x4] up to some
noise. The pattern is structured hierarchically; variableszi represent the variables of
the latent tree. . . 65
5.8 Smooth `1 approximation functions used in ICA with the linear `1 penalty function
plotted in blue solid line. . . 71
5.9 Even simple statistics such as pick rates can reveal patterns of activity and occupancy
in the area around a sensor. A Phidget sensor in an office setting (above) shows high
ambient noise (human activity) during weekday business hours, while a Phidget in a
home (below) shows typical evening and weekend activity. . . 74
5.10 Thm. 5.4.2 implies a relationship between the number of sensors and the maximum
per-sensor error rateπrequired to achieve a given system-wide false positive rate. Here,
the system-wide false positive rate is fixed at 0.1, and the maximum allowable error
rate is plotted as a function of the number of sensors, across a range of values for β.
α= 0.5. . . 75
5.11 Comparing the three bases —SLSA,ICA,haarto baselines — global average (and single
max in (a)) on a synthetic data set generated from the latent tree model. Figures (b)
and (c) evaluate two different false positive constraints. The learned bases significantly
outperform the baselines under strong noise. . . 76
5.12 Detection performance as a function of network sizep= [36,72,108,216,432,648,864,1080,1296]
using all 20,000 training samples. The learned bases show more than 5x performance
improvement compared to the baselines in (a) and (b). . . 76
5.13 Detection performance as a function of of training data size. (a)(b) shows it only takes
approximately 2,000 samples for bothICAandSLSA to achieve the same performance
as using all 20,000 samples. SLSAis 10 times faster to train thanICAas shown in (c). 78
5.14 Experiment with Gnutella-P2P network. (a) visualizes∼1/10 of the total network with
a sample activation pattern colored. Blue: first infected node, Red: nodes subsequently
infected through the cascade. (b)(c) shows that the learned bases achieve and exceed
the state of the art algorithms that use additional prior knowledge of the network. . 78
5.15 There are approximately 1,000 (≈ 1 per 20 km2) seismic stations that observe and
record on average 500+ seismic events that occur in Japan each day. Among those 1,000
stations, ≈ 800 are Hi-net stations, pictured here. These research-grade sensors are
professionally installed and maintained and therefore experience very little instrument
5.16 (a) Japan’s seismic network frequently exhibit localized activation patterns (circled).
Colors indicate raw accelerations (red: large shaking, blue: no shaking). The learned
bases are able to capture these nonuniform patterns with basis elements such as the
ones in (b) and show 2x better detection performance compared to the baselines (c),
while algorithms with hard-coded patterns such as SS-r20 fail to perform well in this
scenario. . . 81
5.17 Locations and magnitudes of Southern California quakes since 1973. . . 81
5.18 CSN network. (a) plots the layout of 128 sensors and epicenter of 4 recorded events.
(b) The learned bases detect on average several seconds faster than the baselines under
the constraint of at most one false alarm a year. . . 82
5.19 Long Beach array. (a) shows the layout of 1,000 stations and 5 recorded events. (b)
Under the constraint of at most one false alarm a year, the learned bases detect on
average 0.1 seconds faster than the baselines, which is significant considering it only
takes 1 second for the seismic wave to travel through the network and only 0.5 seconds
for the network to be saturated with signals. . . 83
6.1 A coreset for mixture models is a small, weighted subset of the data that provides
approximation guarantees on the “goodness” of models learned from it. . . 85
6.2 Illustration of the coreset construction for example data set (a). (b,c) show two
it-erations of constructing the set B. Solid squares are points sampled uniformly from
remaining points, hollow squares are points selected in previous iterations. Red color
indicates half the points furthest away from B, which are kept for next iteration. (d)
final approximate clustering B on top of original data set. (e) Induced non-uniform
sampling distribution: radius of circles indicates probability; color indicates weight,
ranging from red (high weight) to yellow (low weight). (f) Coreset sampled from
dis-tribution in (e). . . 89
6.3 Level sets of the distances between points on a plane (green) and (disjoint)k-dimensional
subspaces are ellipses, and thus can represent contour lines of the multivariate Gaussian. 91
6.4 Tree construction for generating coresets in parallel or from data streams. The bottom
ovals denote (k, )-coresets computed for disjoint sets of data. Each higher-level oval
represents the result of a “merge-and-compress” operation, where a (k, )-coreset is
computed from the union of the coresets beneath it. When performed in this way, the
approximation error grows logarithmically with the number of “leaf” coresets. . . 93
6.5 Experimental results for three real data sets. We compare likelihood of the best model
obtained on subsetsC constructed by uniform sampling, and by the adaptive coreset
Abstract
The proliferation of smartphones and other internet-enabled, sensor-equipped consumer devices enables us to sense and act upon the physical environment in unprecedented ways. This thesis considers Community Sense-and-Response (CSR) systems, a new class of web application for acting on sensory data gathered from participants’ personal smart devices. The thesis describes how rare events can be reliably detected using a decentralized anomaly detection architecture that performs client-side anomaly detection and server-side event detection. After analyzing this decentralized anomaly detection approach, the thesis describes how weak but spatially structured events can be detected, despite significant noise, when the events have a sparse representation in an alternative basis. Finally, the thesis describes how the statistical models needed for client-side anomaly detection may be learned efficiently, using limited space, via coresets.
Chapter 1
Introduction
Phones, wearable sensors, and home sensing are dramatically increasing the number of ways we measure the physical world. The quantity and variety of sensors in these devices promise to make applications more powerful and intuitive by allowing online services to observe the user’s immediate physical context, and infer the broader environmental context from multiple users’ data. Systems utilizing networked consumer-owned sensors - collectively referred to here as sensor-aware apps
- can have sweeping impact on how we collect, access, and act on information relevant to our physical world. For example, commercial products like Google Glass, the Jawbone activity tracking wristband, the Nest home thermostat, and the FitBit are already quantifying sensory data about our environment, our health, and our homes. Inevitably, such devices bought for personal use will provide information that, when viewed in aggregate, provides insight into large-scale social and environmental phenomena.
1.1
From smart devices to sensitive devices
In the last several years, mobile computing has drastically reshaped the way that people produce and access information and is now the dominant means of internet access worldwide. While it is easy to think of mobile devices simply as smaller computers, smart devices like phones and tablets also possess an array of sensors such as gyroscopes, cameras, accelerometers, and compasses not present on traditional computers. The smartphone and tablet market has certainly paved the road technologically for inexpensive internet-enabled, battery-powered sensor devices, but perhaps equally importantly, mobile computing has created the expectation that web services should be ubiquitously available during daily life. I conjecture that the omnipresence of mobile devices has also led many people to an expectation or desire that digital services be cognizant of their immediate physical context, providing contextually relevant information as needed and retreating unobtrusively at other times.
These trends partly explain the recent emergence of so many sensor-oriented consumer devices. Many products in this space are directly marketed towards personal sensing, environmental sensing, and providing contextually relevant information. Examples of personal sensing include health and wellness sensors such as the Basis smart watch, or the Nike FuelBand activity tracker and fitness monitor. Home-oriented products from Nest (such as thermostats and smoke alarms) technologically refresh familiar domestic products with the intent of optimizing their owner’s immediate environment through unobtrusive measurements and mobile-friendly interfaces. Google’s recent $3B acquisition of Nest and its foray into wearable technologies (Glass and Android Wear) demonstrate the web giant’s increasing interest in sourcing physically relevant information to better provide its users with “The right information at just the right time”.
1.2
The sensed world
“The paramount value of the devices, in a sense, lies not in the hardware itself but the interconnectedness of that hardware. As the devices talk to each other, by building an aggregate picture of human behavior, they anticipate what we want before even we know.” (Marcus Wohlsen, on Google’s $3B acquisition of Nest)
intent of these products is to sense the user’s personal environment, the same technology is equally applicable to sensing city-wide or global environments.
Burke [16] first coined the termparticipatory sensingto describe potential applications that “task deployed mobile devices to form interactive, participatory sensor networks that enable public and professional users to gather, analyze and share local knowledge,” and indeed, the last several years have witnessed the creation of several projects that seek to crowdsource sensor data from public volunteers or app users via consumer hardware and web technologies. For example, applications of participatory sensing include:
• Understanding traffic flows [63, 98, 68, 12]
• Identifying sources of pollution [6, 2]
• Monitoring public health [83]
• Responding to natural disasters like hurricanes, floods, and earthquakes [24, 35, 37, 66]
• Predicting adoption of trends and estimating app installation rates [90]
Additionally, [14] provides an excellent overview of how the tools of the social and mobile Web facilitate crowdsourcing data from individuals and their sensor devices, with an emphasis on human participation in sharing and understanding data.
These systems are made possible by volunteer sensors and low-cost web solutions for data col-lection and storage. However, as these systems mature, they will undoubtedly extend beyond data collection and begin to take real-time action on the community’s behalf. For example, traffic net-works may reroute traffic around an accident, or a seismic network may automatically slow trains to prevent derailing.
1.3
Reliable actions from unreliable data
In principle, sensing the world through consumer hardware is merely an HTTP PUT away. However, one of the main claims of this thesis is that acting on data from community sensors is fundamentally different from acting on data from scientific sensors, as well as fundamentally different from acting on data from most web applications. The potential scale of raw data is vast, even by the standards of large web applications. Community sensors are also exposed to noisy, dynamic environments, and data recorded by community sensors often include signals produced by the people who operate them. Additionally, many of the desired applications push the limits of our current understanding of physical phenomena.
volume of raw data that could be produced by such a CSR network is astounding by any standard. Smartphones and other consumer devices often have multiple sensors, and can produce continuous streams of GPS position, acceleration, rotation, audio, and video data. While events of interest (e.g., traffic accidents, earthquakes, disease outbreaks) may be rare, devices must monitor continuously in order to detect them. Beyond obvious data heavyweights like video, rapidly monitoring even a single accelerometer or microphone produces hundreds of megabytes per day. Such data rates become challenging when we consider sensor-aware apps containing tens of thousands or millions of devices. For example, equipping taxi cabs with GPS devices or air quality sensors could easily yield a network of 50,000 sensors in a city like Beijing [109]. At these scales, even collecting a small set of summary statistics becomes daunting: if 500,000 sensors reported a brief status update once per minute, the total number of messages would rival the daily load in the Twitter network.1
Non-traditional sensors. Community devices are also different from those used in traditional scientific and industrial applications. Beyond simply being lower in accuracy (and cost) than “pro-fessional” sensors, community sensors may be mobile, intermittently available, and affected by the unique environment of an individual’s home or workplace. For example, the accelerometer in a smartphone could measure earthquakes, but will also observe user motion.
Complex phenomena. By enabling sensor networks that densely cover cities, community sensors make it possible to measure and act on a range of important phenomena, including traffic pat-terns, pollution, and natural disasters. However, due to the previous lack of fine-grained data about these phenomena, CSR systems must simultaneously learn about the phenomena they are built to act upon. For example, a community seismic network may need to use measurements of frequent smaller quakes in order to obtain the models of ground composition needed to accurately estimate damage during rare, large quakes.
These challenges are compounded by the need to make reliable decisions in real-time, and with performance guarantees. For example, choosing the best emergency response strategies after a natu-ral disaster could be drastically aided by real-time sensor data. However, false alarms and inaccurate data can have high costs; consequently, rigorous performance estimates and system evaluations are prerequisites for automating real-world responses.
1.4
The Caltech Community Seismic Network
CSR systems have the potential to change how we understand and act on city-wide physical phenom-ena like natural disasters. One compelling example if this is the Caltech Community Seismic Network
(CSN) project. CSN is a system for real-time earthquake measurement and response. In contrast to traditional seismic networks that use a relatively small number of high quality seismometers, CSN emphasizes large numbers of consumer-grade sensors that are owned and operated by volunteers in the community. While this presents numerous challenges, it also promises a degree of spatial resoultion that would be infeasible for traditional networks. Indeed, given that smartphones, game consoles, and many wearable devices are equipped with MEMS accelerometers, it’s fair to say that millions of sensors have already been deployed and are merely waiting to be harnessed. Using even a fraction of these sensors could provide a high spatial density that makes possible a range of ap-plications in disaster response and earth science. The CSN system is used as a motivating example throughout much of this thesis; it is presented in detail in Chapter3, and is outlined here.
Figure 1.1: CSN volunteers contribute data from low-cost accelerometers (left) and from Android smartphones via the CSN appCrowdShake (right).
1.4.1
Community Sensors
The CSN project is designed to incorporate large numbers home and personal sensor devices that stream data to cloud applications. To better understand how these devices can be used for event detection and response, the CSN project has developed client applications for home (desktop) and personal (phone and tablet) platforms. Fig.1.1illustrates a USB accelerometer that volunteers may connect directly to their home laptop or desktop and an Android app for phones and tablets. These client types differ drastically in their ambient noise profiles, as well as in available computation and network resources. For example, continuously transmitting data may be acceptable for a desktop client, but would be an excessive drain on battery power and bandwidth for a mobile client.
1.4.2
Applications
per city. Instrumenting a city block-by-block or building-by-building offers the opportunity for several valuable applications, including detailed disaster response planning, earth science, building health monitoring, and earthquake early warning.
Disaster response planning. Given that a large earthquake is likely to produce varying levels of damage throughout a city, emergency response teams would benefit from detailed maps of damage severity while planning emergency responses. At present, aerial photos and satellite images are used to assess damage after severe earthquakes, as shown in Fig.1.2. This reconnaissance costs precious time. Instead, a city-wide network of sensors could provide fine-grained estimates of shaking intensity as a proxy for damage levels.
Earth science. The complex patterns of acceleration caused by earthquakes are due in part to variations in subsurface structure, and the particular details of the fault rupture process. High spatial sensor density provides observations of these effects, reducing the need for model interpolation between sensor locations.
Building health monitoring. Earthquakes may damage buildings in ways that are not readily apparent, but that could be inferred from sensors. For example, changes in a building’s resonant frequency may indicate a loss of stiffness resulting from cracks or broken welds. Similarly, the occur-rence of structural damage may manifest in acoustic or accelerometer data. Estimates of structural health could be used to prioritize post-quake inspections and help determine which buildings are safe to re-enter.
Earthquake Early Warning. Earthquake Early Warning (EEW) is another exciting application of community seismic networks. EEW operates on the principle that once an earthquake is detected, warning messages can be transmitted ahead of the relatively slow seismic waves. Warning times of tens of seconds to a minute are possible, though warning depends on the speed of detection and the distance from detectors to the recipient of the warning message. Consequently, large numbers of sensors may help in rapidly detecting an event. Community networks may also allow countries with limited seismic infrastructure - such as Haiti, Peru, or India - to establish early warning systems.
1.5
Decentralized Event Detection
Figure 1.2: A satellite-based damage map from Haiti, following the January 12, 2010 earthquake, depicts localized variation in damage. Sensors could provide such information to emergency teams without waiting for aerial photos. Image provided by Google.
in Long Beach, CA demonstrates this in Fig.1.3. How could we detect the quake, and estimate its location and magnitude as quickly as possible?
One direct approach from detection theory for determining the occurrence of an event (i.e., quake) from noisy observations is to collect all data centrally, and perform classification using a likelihood ratio test:
P[ all measurements|strong quake ] P[ all measurements|no quake ]
> τ (1.1)
This test declares a detection if the ratio exceeds a pre-determined threshold τ. Unsurprisingly, this involves transmitting a daunting amount of data; a global network of 1M phones would be transmitting 30TB of acceleration data per day! Additionally, the likelihood ratio test requires the distribution of all sensor data, conditioned on the occurrence or non-occurrence of a strong earthquake. Each community sensor is unique, and so modeling these distributions requires modeling each sensor individually.
Figure 1.3: A map of peak acceleration amplitudes experienced in Long Beach, California during the Carson earthquake, as recorded by Signal Hill Petroleum. The map shows large variations in peak acceleration and the effects of a minor fault line.
[99]: each sensor individually performs a hypothesis test, for some thresholdτ, and picks only when
P[ one sensor’s measurements|strong quake ]
P[ one sensor’s measurements|no quake ] > τ. (1.2)
Similarly, the Cloud server performs a hypothesis test on the number of picks S received at a given time, and declares a detection when a thresholdτ0 is exceeded:
Bin(S;rT;N)
Bin(S;rF;N)
≥τ0, (1.3)
The parametersrT andrF are the true positive and false positive pick rates for a single sensor, and
Bin(·, p, N) is the probability mass function of the Binomial distribution. Asymptotically optimal decision performance can be obtained by using the decision rules (1.2) and (4.2) with proper choice of the thresholdsτ andτ0 [99]. Additionally, collecting picks instead of raw data may help preserve user privacy by reducing the amount of raw sensor data that is centrally collected.
Challenges for the classical approach. While this classical, decentralized detection approach appears promising, detecting rare events from community sensors presents three main challenges:
1. How can we perform likelihood ratio tests on each sensor’s data, when we do not have enough data (e.g., measurements of large, rare quakes) to accurately model sensor behavior during an event?
3. How can we overcome the (strong) assumption of conditionally independent sensors, and in-corporate spatial dependencies?
Next, we will consider how the abundance of normal data can be leveraged to detect rare events for which we lack training data. Then, we will see that new tools from computational geometry make it possible to compute the needed probabilistic models on resource-constrained devices. Finally, learning on the server-side adapts data aggregation according to spatial dependencies.
1.5.1
Leveraging “normal” data
The client-side hypothesis test in (1.2) requires two conditional probability distributions. The nu-merator models a particular device’s acceleration during a strong quake, and due to the rarity of large quakes is impractical to obtain. In contrast, the denominator can be estimated from abundantly available “normal” data. Can we still hope to produce reliable picks?
It turns out that under mild conditions, a simple anomaly detection approach that uses only the probability of an acceleration time series in the absence of a quake can obtain the same asymptotically optimal performance. A given sensor now picks when
P[ one sensor’s measurements|no quake ]< τ. (1.4)
For an appropriate choice of threshold, this can be shown to produce the same picks as the full hypothesis test, without requiring a probabilistic model of sensor data during future, unknown quakes.
1.5.2
Learning on smartphones with Coresets
The above anomaly detection scheme makes use of the abundant “normal” data produced by each device, but leaves us the challenge of computing a distribution over the sensor data. In principle, each sensor could maintain a history of its observations, and periodically estimate a probabilistic model describing that data. On a mobile device, this means logging around 3GB of acceleration data per month. Storing and estimating models on this much data is a burden on volunteers’ smartphone resources. Could we accurately model a sensor’s data with (much) less storage?
ability to compress the 3GB of monthly acceleration data and still recover the same GMM that would have been learned from the full data. Fortunately, it turns out that the picture is drastically different for approximating a GMM: a GMM can be fit to an arbitrary amount of data, with an arbitrary approximation guarantee, using a finite amount of storage!
A tool from computational geometry, called a coreset, makes such approximations possible. Roughly, a coreset for an algorithm is a (weighted) subset of the input, such that running the algorithm on the coreset gives a constant-factor approximation to running the algorithm on the full input. Coresets have been used to obtain approximations for a variety of geometric problems, such as k-means and k-medians clustering.
Figure 1.4: A coreset for Gaussian Mixture Models is a small, weighted subset of the data that allows us to fit a model that is “almost as good as” a model fit to the full dataset. The green bars denote the scalar weightsγj associated with each selected point.
It turns out that many geometric coreset techniques can also provide approximations for statis-tical problems. Given an input dataset D, we would like to find the maximum likelihood estimate for the means and variances of a Gaussian mixture model, collectively denotedθ. A weighted setC
is a (k, )-coreset for GMMs if with high probability the (weighted) log likelihood on the sampled data, denotedL(C|θ), is anapproximation to the log likelihood on the full dataL(D|θ), for any mixture ofkGaussians:
(1−ε)L(D|θ)≤ L(C|θ)≤φ(D|θ)(1 +ε).
[44] showed that given inputD, it is possible to sample such a coresetC whose size isindependent
of the size of inputD(i.e., only depends polynomially on the dimension of the input, the number of Gaussiansk, and parametersε, δ), with probability at least 1−δfor all (non-degenerate) mixturesθ
C can obtain approximately the same likelihood as learning the model from the entire, arbitrarily largeD.
But how do we find C? [44] showed that efficient algorithms to compute coresets for projective clustering problems (e.g., k-means and generalizations) can provide coresets for GMMs. A key insight is that while uniformly subsampling the input may miss “important” regions of data, an adaptive sampling approach is likely to sample from “enough” regions to reliably estimate a mixture of k
Gaussians; weighting the samples accounts for the sampling bias. Previous work [59] also identified that coresets for many optimization problems can be computed efficiently in the parallel or streaming model, and several of those results apply here. In particular, a stream of input data can be buffered to some constant size, and then compressed into a coreset. Careful merging and compressing of such coresets provides an approximation to the entire stream so far, while using space and update time polynomial in all the parameters, and logarithmic inn.
1.5.3
Understanding Spatial Phenomena
Quake detection in community networks requires finding a complex spatio-temporal pattern in a large set of noisy sensor measurements. The start of a quake may only affect a small fraction of the network, so the event can easily be concealed in both single-sensor measurements and network-wide statistics. Data from recent high-density seismic studies, shown in Fig.1.3, demonstrate that localized variations in ground structure significantly impact the magnitude of shaking at locations only a kilometer apart. Consequently, effectively detecting earthquakes and estimating their impact requires algorithms that can learn subtle dependencies among sensor data, and detect changes within groups of dependent sensors.
The “classical” approach described in Sec. 1.5 assumes that the sensors provide independent, identically distributed measurements conditioned on the occurrence or non-occurrence of an event. In this case, the Cloud server would declare a detection if a sufficiently large number of sensors report picks. However, in many practical applications, the particular spatial configuration of the sensors matters, and the independence assumption is violated. Here, the natural question arises of how (qualitative) knowledge about the nature of the event can be exploited in order to improve detection performance.
Suppose that a small fraction of sensors in a large network observe the initial effects of a spatial phenomena. For example, a small number of smoke detectors may observe the start of a fire, or seismometers near a fault line may first observe shaking. If each sensor transmits a binary observation, the signal received by the Cloud server may be viewed as transmitting a vectorx∈Rp
separately.It turns out that this intuition (and some desirable analytic properties) can be captured by learning a orthonormal change-of-basis matrix that projects the binary messages received by the server onto a coordinate system that, roughly, aggregates groups of strongly correlated sensors. Given such a matrixBwith columnsbi, . . . ,bp, the server declares an event when
max
i b
T i y> τ
where τ again denotes some scalar threshold. To obtain reliable detection when the signal is weak (measured by the`0pseudo-norm,||x||0<
√
p), traditional hypothesis testing requires the error rate of each sensor (each element ofx) todecrease as the number of sensorspincreases. This is in stark contrast to our intuition that more sensors should be better, and in contrast to the “numerous-but-noisy” approach of community sensing. However, Chapter5shows that if the matrixBissparsifying, i.e., ||BTx||
0 =pβ, ||x||0 = pα, 0 < β < α <1/2, then the test maxibTi y > τ gives probability
of miss and false alarm that decays to zero exponentially as a function of the “sparsification ratio” ||x||0/||BTx||0, for any raterF <1/2 of pick errors. Effectively, this allows large numbers of noisy
sensors to contribute to reliable detection of signals that are observed only by a small fraction (||x||0)
of sensors.
Learning to sparsify. The success of the above result depends onB’s ability to concentrate weak signals. We could learn a basisBthat optimizes||BTx||
0by solving
min
B ||B TX||
0, subject toBBT =I (1.5)
whereXis a matrix that contains binary observations as its columns and||·||0is the sum of non-zero
elements in the matrix. The constraintBBT =Iensures thatBremains orthonormal.
(5.3) can be impractical to compute, and can be sensitive to noise or outliers in the data. Instead, we may wish to find a basis that sparsely represents “most of” the observations. More formally, we introduce a latent matrix Z, which can be thought of as the “cause”, in the transform domain, of the noise-free signalsX. In other wordsX=BZ. We desireZto be sparse, andBZto be close to the observed signalY. This suggests the next optimization, originally introduced for text modeling [20], as a heuristic for (5.3):
min
B,Z||Y−BZ|| 2
F+λ||Z||1, subject toBBT =I (1.6)
where|| · ||F is the matrix Frobenius norm, andλ >0 is a free parameter. (5.6) essentially balances
heuristically “sparsity-promoting”`1-norm.
Although (5.6) is non-convex, fixing eitherBor Zmakes the objective function with respect to the other convex. The objective can then be efficiently solved (to a local minima) via an iterative two-step convex optimization process.
Empirically, this approach gives strong performance in several event detection applications, in-cluding quake measurements of 1795 earthquakes following the Japanese Tohuku M9.0 quake, quake measurements from the Signal Hill dense seismic study, from the Community Seismic Network as well as simulated virus outbreaks in the Gnutella P2P network.
[image:25.612.229.423.277.428.2]1.6
Contributions and Outline of the thesis
Figure 1.5: An architecture for decentralized event detection: each consumer device runs a client application for modeling its sensor data and transmits pick messages about potential events. A cloud server receives the stream of pick messages, and detects spatial-temporal events.
The remainder of this thesis presents systems and algorithms for large-scale event detection in CSR systems. For reference, it is helpful to refer to Fig. 1.5, which presents a cartoon overview of a system where individual sensor clients communicate directly with a cloud server. The sensor clients are responsible for local data modeling and processing, while the (cloud) server performs system-wide event detection.
The second contribution of this thesis, presented in Chapter4, is theory for decentralized detec-tion of rare events, design choices for implementing the algorithm on Android devices, and experi-mental investigations of earthquake detection performance. This can be thought of as a particular implementation of the client-level processing and server-level event detection in Fig.1.5. This work first appeared in [37].
The third contribution, presented in Chapter 5, is theory and experimental investigation of detecting spatially-structured signals. In [36], I formulate an event detection model of sparse binary signals observed through a noisy binary channel, and demonstrate that a sparsifying transform (designed from domain knowledge or learned from data) allows a network of numerous-but-noisy sensors to detect otherwise weak events. Chapter 5 also discusses preliminary investigations, first published as joint work in [88], into detecting spatially structured signals. Notably, this work incorporates sensor models from [37] into a simulation framework developed by Annie Liu. This chapter can be thought of as providing a more advanced design for the server-level event detection component of the above system cartoon.
Chapter 2
Related Work
The work in this thesis centers on using mobile and cloud computing platforms to build sensor-aware applications capable of making reliable, real-time decisions, and as such is related to several bodies of research.
2.1
WSNs and Community sensing
Collecting and understanding sensor data is a key component of several disciplines, including wireless sensor networks (WSNs), community sensing, and participatory sensing.
Research in WSNs is similar in spirit to the concept of sensor-aware apps, but tends to differ in fundamental assumptions about target applications and resource availability. WSN research often assumes a network of limited-CPU devices with power-constrained short-range wireless radios, typically connected to each other and a centralized data sink via a multi-hop network. These assumptions have been partly motivated by a desire to perform long-term, unattended environmental monitoring. In such a setting, sensor devices may be required to operate on a strict power budget that precludes standard wifi or cellular communication.
Community / Participatory sensing has been used effectively in a variety of problem domains for environmental monitoring and data collection via community-owned or operated sensors. Several projects have used smartphones’ position and motion sensing to
• monitor traffic flows and road conditions [63, 98, 68, 12, 81, 62]
• Community-owned sensors offer great potential in environmental monitoring [83, 103] by
ob-taining up-to-date measurements of the conditions participants are exposed to.
• Mobile phones and body sensors are used to encourage physical activity by categorizing body motion and comparing activities to exercise goals [25],
• Identifying sources of pollution [6, 2],
• Responding to natural disasters like hurricanes, floods, and earthquakes [24, 35, 37, 66]
Additionally, [14] provides an excellent overview of how the tools of the social and mobile Web facilitate crowdsourcing data from individuals and their sensor devices, with an emphasis on human participation in sharing and understanding data.
Commercial Sensor-aware apps. Technology from these fields has found new application in several commercial applications. Waze1 crowd-sourced traffic and navigation, Nooly2 and
Weath-erSignal3 crowd-sourced weather apps, the Vaavud4wind meter for smartphones, and KitLocate’s5
tools for low-power position tracking and geofencing. A glance at TechCrunch will often provide a glimpse of the sensor appdu jour. The Funf open sensing framework6 is particularly relevant, as it
allows the creation of Android apps for sensor data collection.
2.2
Seismic networks
CSN should be viewed in light of existing traditional seismic networks, and in light of recent projects that explore lower-cost consumer sensor technologies. While these projects differ in their sensors, algorithms and scope, they share a common intent of detecting earthquakes, mapping their intensity, and providing warnings and data products for emergency responders.
Among non-traditional seismic networks, perhaps the most closely related system is the Quake-Catcher network [24]. While QuakeQuake-Catcher shares the use of MEMS accelerometers in USB devices and laptops, the CSN system differs in its use of algorithms designed to execute efficiently on cloud computing systems and statistical algorithms for detecting rare events, particularly with heteroge-neous sensors including mobile phones. Mobile phones create far more complex statistical challenges, but also promise to facilitate much larger groups of volunteers. Kapoor et al. [66] analyzes the in-crease in call volume after or during an event to detect earthquakes. Another related effort is the NetQuakes project [101], which deploys more expensive stand-alone seismographs with the help of community participation. Our CSN Phidget sensors achieve different tradeoffs between cost and accuracy.
Japanese seismic network. Japan experiences a large number of seismic events due to earth-quakes and volcanic activity, and contains several large seismic sensor networks. The Japan Me-tereological Agency (JMA) operates a seismic network containing roughly 1000 seismic sensors.
1www.waze.com 2www.nooly.com 3weathersignal.com 4vaavud.com 5www.kitlocate.com
Additionally, the National Research Institute for Earth Science and Disaster Prevention (NIED) currently operates 777 sensor stations, and Japanese local governments currently operate nearly 3000 sensor stations. The data from these sensors is used to detect earthquakes and produce esti-mates of hypocenter, magnitude and observed seismic intensity. The JMA uses information from these sensors to provide early warning alerts and issue reports to the public and disaster relief workers within minutes of a quake.
CISN. The California Integrated Seismic Network (CISN) is a collaboration among state, federal, and university organizations that perform earthquake monitoring. The network spans approximately 400 seismic stations located throughout California. The network is comprised of a variety of sensor types and technologies, including short-period, broadband, and strong-motion sensors. Fig. 2.1
[image:29.612.238.410.317.542.2]depicts a “borehole” seismic station in the CISN network. Using these sensors, CISN determines earthquake warnings using the P-wave pulse width and peak initial 3-second displacement amplitude [107].
Figure 2.1: A CISN sensor station installed in a “borehole”. Installing and maintaining such stations represents significant investment, but provides exceptional quality.
GPS displacement networks. Networks of high sample rate Global Positioning System (GPS) sensors seek to quickly and accurately observe surface displacements. Large earthquakes can produce centimeters to meters of ground surface displacement. Accurately estimating displacement in real-time and incorporating those estimates into early warning algorithms is a topic of ongoing research [74].
developed to process data from existing sparse networks of high-fidelity seismic sensors (such as the Southern California Seismic Network). The Virtual Seismologist [26] applies a Bayesian approach to EEW, using prior information and seismic models to estimate the magnitude and location of an earthquake as sources of information arrive. ElarmS [5] uses the frequency content of initial P-wave measurements from sensors closest to the epicenter, and applies an attenuation function to estimate ground acceleration at further locations. Recently, PreSEIS [13] uses a 2-layer feed-forward neural network trained on historic seismic data to estimate quake parameters including hypocenter location, moment magnitude, and earthquake rupture movement in real time.
We view our approach of community seismic networking as fully complementary to these efforts by providing a higher density of sensors and greater chance of measurements near to the epicenter. Our experiments provide encouraging results on the performance improvements that can be obtained by adding community sensors to an existing deployment of sparse but high quality sensors.
2.3
Decentralized detection
There has been a great deal of work in decentralized detection. The classical hierarchical hypothesis testing approach has been analyzed by Tsitsiklis [99]. Chamberland et al. [17] study classical hier-archical hypothesis testing under bandwidth constraints. Their goal is to minimizes the probability of error, under constraint on total network bandwidth. Wittenburg et al. [106] study distributed event detection in WSN. In contrast to the work above, their approach is distributed rather than decentralized: nearby nodes collaborate by exchanging feature vectors with neighbors before mak-ing decision. Their approach requires a trainmak-ing phase, providmak-ing examples of events that should be detected. Martinic et al. [80] also study distributed detection on multi-hop networks. Nodes are clustered into cells, and the observations within a cell are compared against a user-supplied “event signature” (a general query on the cell’s values) at the cell’s leader node (cluster head).
The communication requirements of the last two approaches are difficult to meet in community sensing applications, since sensors may not be able to communicate with their neighbors due to privacy and security restrictions. Both approaches require prior models (training data providing examples of events that should be detected, or appropriately formed queries) that may not be available in the seismic monitoring domain.
2.4
Anomaly Detection
they support the idea of using GMMs for anomaly detection could be extended to learn, for each phone, a GMM that adapts to non-stationary sources of data.
Davy et al. [31] develop an online approach for anomaly detection using online Support Vector machines. One of their experiments is to detect anomalies in accelerometer recordings of industrial equipment. They use produce frequency-based (spectrogram) features, similar to the features we use. However, their approach assumes the centralized setting.
Subramaniam et al. [97] develop an approach for online outlier detection in hierarchical sensor network topologies. Sensors learn models of their observations in an online way using kernel density estimators, and these models are folded together up the hierarchy to characterize the distribution of all sensors in the network. Rajasegarar et al. [92] study distributed anomaly detection using one-class SVMs in wireless sensor networks. They assume a tree topology. Each sensor clusters its (recent) data, and reports the cluster descriptions to its parent. Clusters are merged, and propagated towards the root. The root then decides if the aggregate clusters are anomalous. Both approaches above are not suitable for the community sensing communication model, where each sensor has to make independent decisions. Zhang et al. [110] demonstrate online SVMs to detect anomalies in process system calls in the context of intrusion detection. Onat et al. [89] develop a system for detecting anomalies based on sliding window statistics in mobile ad hoc networks (MANETs). However, their approach requires for nodes to share observations with their neighbors.
2.5
Sparse detection
Detecting a sparse signal in the presence of strong noise is challenging without placing some as-sumptions on the class of signals. Signals that possess tree-structured dependencies naturally lend themselves to wavelet analysis where the basis is supported on subtrees. Singh et al.[96] proposed using a natural Haar-like wavelet basis constructed from agglomerative hierarchical clustering to encode the dependencies for improved detection under strong noise. Gavish [50] and Lee [73] also propose multi-scale bases for signals with tree structure. [96] and [73] construct a transform using agglomerative clustering to identify hierarchical tree structure. Krishnamrurthy et al.[69] further extends the analysis to graph structured network defined over spanning trees.
of these rates. However, these results are asymptotic and appear computationally intractable for large sensor networks.
2.6
Scan statistics
Spatial and space-time scan statistics were first developed to monitor health data and disease out-breaks [70]. The main idea is to evaluate all subsets of the data for possible events. Of course, enumerating all possible O(2n) subsets is infeasible for even moderately sized problems, so later variations impose constraints on space and time to reduce the number of subsets, which is often done by scanning only subsets of distinct sizes and shapes [85, 86]. This approach reduces the com-plexity toO n2
(and toO(n) in [86]) but may also impair the detection performance if important signals are not well captured by tested subsets.
Linear Time Subset Scanning was recently developed to further reduce the complexity [86]. It states that for any scoring functionsG, e.g., the ratio of count to baselineG(si) =ci/bi, that satisfies
the LTSS property (that the subset S that maximizes sum of score F(S) must only consist some of the topk scoring stations), then onlyO(k) subsets should be evaluated to determine detection. However, this approach often gives undesirable spatially separated subsets and the spatial version that includes distance constraints suffers the same problem as predefined shape.
2.7
Basis Learning
Learning a sparsifying basis is intimately related to dictionary learning and topic models. Dictionary learning [4] attempts to find an overcomplete dictionaryD∈Rn,K,K > nthat can sparsely encode
signals inRn. Similarly, topic models [104] represent text data as a linear combination of a “topics”,
e.g., vectors of word frequencies. Topic models seek topics that sparsely approximate the documents, though the number of topics is significantly less than the number of words (i.e., the topic matrix is undercomplete).
ICA is a transformation method developed to recover nongaussian, statistically independent componentszfrom their linear combinationx[65], assuming that the linear transformation matrix
2.8
Theoretical results on mixtures of Gaussians
There has been a significant amount of work on learning and applying GMMs (and more general distributions). Perhaps the most commonly used technique in practice is the EM algorithm [33], which is however only guaranteed to converge to a local optimum of the likelihood. Dasgupta [28] is the first to show that parameters of an unknown GMMP can be estimated in polynomial time, with arbitrary accuracyε, given i.i.d. samples fromP. However, his algorithm assumes a common covariance, bounded excentricity, a (known) bound on the smallest component weight, as well as a separation (distance of the means), that scales as Ω(√d). Subsequent works relax the assumption on separation tod1/4 [29] andk1/4 [102]. [8] is the first to learn general GMMs, with separationd1/4.
[45] provides the first result that does not require any separation, but assumes that the Gaussians are axis-aligned. Recently, [82] and [9] provide algorithms with polynomial running time (except exponential dependence onk) and sample complexity for arbitrary GMMs. However, in contrast to our results, all the results described above crucially rely on the fact that the data setD is actually generated by a mixture of Gaussians. The problem of fitting a mixture model with near-optimal log-likelihood for arbitrary data is studied by [8], who provides a PTAS for this problem. However, their result requires that the Gaussians are identical spheres, in which case the maximum likelihood problem is identical to the k-means problem. In contrast, our results make only mild assumptions about the Gaussian components. Furthermore, none of the algorithms described above applies to the streaming or parallel setting.
2.9
Coresets
Approximation algorithms in computational geometry often make use of random sampling, feature extraction, and-samples [60]. Coresets can be viewed as a general concept that includes all of the above, and more. For a comprehensive survey on this topic, see [42]. It is not clear that there is any commonly agreed-upon definition of a coreset, despite several inconsistent attempts to do so [57, 43].
Coresets have been the subject of many recent papers and several surveys [3, 27]. They have been used to great effect for a host of geometric and graph problems, includingk-median [57],k-mean [43],
Chapter 3
The Caltech Community Seismic
Network
The Community Seismic Network project at Caltech is a collaboration between civil engineers, geophysicists, and computer scientists that seeks to rapidly detect earthquakes and provide real-time estimates of their impact using community-operated sensors. Given that large earthquakes are among the few scenarios that can threaten an entire city, the CSN project is built upon a vision of people sharing accelerometer data from their personal devices to collectively produce the information needed for effective real-time and post-event responses to dangerous earthquakes. To that end, CSN has partnered with more than a thousand volunteers in the Los Angeles area and cities around the world who contribute real-time acceleration data from their Android smartphones and low-cost USB-connected sensors. This chapter, based on [37], describes the project goals and challenges, as well as the client-server architecture implemented on Google App Engine, Android phones, and desktop computers. The main contribution is the design and implementation of the CSN-Droid and CrowdShake Android client.
3.1
Goals
of damage)immediately. Because sensors can detect the moderate P-wave shaking that precedes the damaging S-wave shaking, sensors are expected to report data before network and power are lost, and before cellular networks are overloaded by human communication.
[image:35.612.136.514.135.380.2](a) Carson (b) Compton
Figure 3.1: A map of peak acceleration amplitudes during the Carson and Compton earthquakes, as recorded by Signal Hill Petroleum in Long Beach California. The maps shows large variations in peak acceleration and the effects of a minor fault line, indicated by the overlaid line. Information on localized shaking intensity is valuable to emergency teams, and for mapping subterranean geological structures.
3.2
Crowdsourcing environmental sensing
The CSN project turns to volunteer participation from members of the community to obtain its sensor coverage. This community participation is ideal for seismic sensing for several reasons. First, community participation makes possible the densely distributed sensors needed for accurately mea-suring shaking throughout a city. For example, instrumenting the greater Los Angeles area at a spatial resolution of 1 sensor per square kilometer would require over 10,000 sensors. While tradi-tional seismometer stations cost thousands of dollars per sensor to install and operate, the same number of sensors could be reached if 0.5% of the area’s population volunteered data from their smartphones. The effects of finer spatial resolution are illustrated in Fig. 3.2. In this way, com-munity sensors can provide fine spatial coverage, and complement existing networks of sparsely deployed, high quality sensors.
Present
Ideal
1,000 stations
10,000 stations
Figure 3.2: The low spatial density of many existing sensor networks makes it difficult to accurately reconstruct spatial phenomena from measurements. For example, the Southern California Seismic Network has roughly 100 sensors in the Los Angeles area. Using the present configuration of sensors, interpolation provides a crude estimate of an ideal radial pattern. Increasing the number of sensors allows even simple interpolation to adequately reconstruct the signal.
Community sensors are also ideally situated for assisting the population during an emergency. In addition to collecting accelerometer data, the same smartphone app could be used to report the last-known location of family members, or give instructions on where to gather for help from emergency teams. In short, community sensing applications provide a new way for people to stay informed about the areas and people they care about.
CSN makes it easy for the community to participate by using low-cost accelerometers and sensors already present in volunteers’ Android phones. A free Android application on the Google Play app store calledCSN-Droidmakes volunteering data as easy as installing a new app. The CSN project also partners with LA-area schools and city infrastructure to freely distribute low-cost accelerometers from Phidget, Inc. that interface via USB to a host PC, tablet, or other internet-connected device. Phidget sensors have also been installed in several high-rise buildings to measure structural responses to earthquakes. Fig.3.3displays these sensors.
possi-bilities for decentralized event detection. Smartphones contain a rich suite of sensors, such as GPS, accelerometers, and cameras, that can gather information about a variety of geospatial phenomena. smartphones, tablets and laptops have accelerometers that are being used by our project and others [23, 1] to obtain seismic measurements. It is exciting that worldwide cellphone coverage is dramati-cally increasing, and that recent projects such as Google’s Project Loon (“Balloon powered internet for everyone”) seek to provide internet to remote and developing areas. Global internet access and smartphone availability make it possible to extend community networks to developing regions such as Haiti, which suffers from devastating earthquakes. We speculate that as smartphones become less expensive, they will be adopted in greater numbers within developing economies and will provide a substitute for unavailable centralized infrastructure.
Figure 3.3: CrowdShake, a free Android app, allows volunteers to join the CSN network, contribute data, and access daily information about earthquakes worldwide.
3.3
Are consumer sensors adequate?
The low cost and ready availability of consumer sensors makes them an enticing foundation for sensing applications, but we must first ascertain that they are capable of measuring the phenomena of interest. For CSN, this means experimentally verifying that accelerometers in USB devices and mobile phones can sense typical acceleration patterns for moderately large and dangerously large earthquakes.
Mean Std. Dev. Min. Diff. x (m/s2) -0.308843 0.0687218 0.0136203
y (m/s2) 0.116929 0.0620888 0.0136203 z (m/s2) 9.710770 0.0899053 0.0136200
t (s) 0.033375 0.0712159 0.0127570
Table 3.1: Mean, standard deviation, and minimum difference between measurements for the sam-pling rate (t) and accelerations along each of the three axes (x, y, z) recorded in one hour of stationary data on the Dev 1.
so it is necessary to empirically evaluate their sensitivity. As a simple baseline, Table3.1summarizes accelerometer recordings from an Android Dev Phone 1, which is functionally equivalent to the HTC Dream and T-Mobile G1, taken while the phone was stationary for one hour. Given that an M5 earthquake may produce accelerations of 0.5m/s2, and an M6 earthquake may produce accelerations
of 1.5m/s2, these measurements suggest that an Android phone near the epicenter of a moderately large quake (M5 or greater) is likely to observe the shaking. Additionally, this data reflects that accelerometer samples in Android are produced at a variable rate.
[image:38.612.240.413.352.483.2]Shake table validation.
Figure 3.4: A shake table is used to reproduce the acceleration of historic quakes.
Experiments with a large actuator called a “shake table” allow us to expose sensors to accurate reproductions of historic, moderately large (M4.5-6.5) earthquakes. The shake table demonstrates that both USB sensors and the lower quality phone accelerometers can detect the smaller initial shaking (P-wave) and stronger secondary shaking (S-wave) that produce the characteristic signature of an earthquake, as shown in Fig.3.5.
These results indicate that smartphone accelerometers are capable of observing acceleration produced by damaging earthquakes. Accelerometers in Android phones typically provide 12 to 14 bits of resolution; in contrast, 16 Phidget USB accelerometers provide significantly gerater sensitivity. Fig.3.6summarizes the capability of Android and Phidget sensors to detect earthquakes of different magnitudes.
5 10 15 20 −2
0 2 4
seconds
m/s
2
(a) 24-bit Episensor “ground truth”
5 10 15 20
−2 0 2 4
seconds
m/s
2
(b) Android phone on shake table
5 10 15 20
−2 0 2 4
seconds
m/s
2
(c) Android phone in backpack
Figure 3.5: Android accelerometers accurately record strong shaking during a shake table experi-ment. (a) Ground truth. (b) Android phone. (c) Android phone in backpack.
buildings caused by earthquakes.
Millikan Library on the Caltech campus is rather uniquely equipped with a large “oscillator”: a rotating eccentric weight on the roof of the building. This oscillator can be used to excite the building at a controlled frequency, and can be used to study the resonant frequencies (modes) of the building. Data shown in Fig. 3.7 indicates that USB sensors can measure the low frequency resonance of large buildings. This is relevant for structural monitoring aplications, as changes in a building’s resonant frequencies may indicate structural damage and a loss of stiffness.
3.4
Systems Challenges
The CSN project was designed in anticipation of several systems challenges that arise from net-working vast numbers of community sensors into a reliable, real-time event detection system. These challenges include: large message volumes, rare events, heterogeneous sensors and client platforms, complex environmental noise, and user privacy. While some of these challenges are particularly rele-vant to earthquake monitoring, they demonstrate the breadth of issues which need to be considered for a successful CSR system.
Message volume. A system that scales to tens of thousands or millions of sensors must limit the rate of message traffic so that it can be handled efficiently by the network and fusion center. For example, one million phones would produce approximately 30 Terabytes of accelerometer data each day. Another key challenge is to develop a system infrastructure that has low response time even under peak load (messages sent by millions of phones during an earthquake). Moreover, the Internet and computers in a quake zone are likely to fail with the onset of intensive shaking. So, data from sensors must be sent out to a distributed, resilient system that has data centers outside the quake zone.