Liquid-Liquid Equilibrium Behavior and In Vitro Digestion
Simulation of Medium Chain Fatty Acids
Ericsem Pereira, Antonio J. A. Meirelles, Guilherme J. Maximo
School of Food Engineering, University of Campinas, 80 Monteriro Lobato Street, 13083- 062 Campinas, Brazil
Abstract
The absorption of medium-chain fatty acids (MCFA) depends on the solubility of these components in the gastric fluid. Parameters such as the total MCFA concentration, carboxyl ionization level, and carbon chain length affect the solubility of these molecules. Moreover, the enzymatic lipolysis of solubilized triacylglycerol (TAG) molecules may depend on the carbon chain length of the fatty acids (FAs) components and their positions on the glycerol backbone. This present study aimed at investigating the effect of electrolyte usually formed during the gastric digestion phase on the solubility of MCFA, and evaluating the influence of the FA carbon chain length on the lipolysis rate during the in vitro digestion simulation. The results obtained here showed that the increasing of electrolyte concentrations tend to decrease the mutual solubility of systems composed by the caproic and caprylic fatty acids + sodium chloride, sodium bicarbonate, and potassium chloride solutions. We also observed that a conventional version of the thermodynamic UNIQUAC model was able to correlate the liquid-liquid phase behavior of the electrolyte solutions. Regarding the in vitro digestion simulation, the experimental data indicated that the action of the pancreatic enzyme occurred preferentially in TAG molecules comprised of short and medium-chain fatty acids.
Key words: Phase equilibrium; In vitro lipid digestion; Fats and oils.
Introduction
The gastric lipolysis contributes to 10-30% of overall lipolysis of dietetic
triglycerides, forming free fatty acids (FFA), mono- and diacylglycerols (MAG and DAG, respectively). During this process, the gastric lipolysis of triacylglycerol (TAG) molecules containing medium-chain fatty acids (MCFA) is more efficient than that of TAGs composed of long-chain fatty acids (LCFA) (Armand et al., 1999; Koziolek et al., 2018). However, the solubility of those triglyceride digestion products, such as FFA, is required for uptake and use by the body (Phan et al., 2015).
Such variables as total FA concentration, carboxyl group ionization level, carbon-chain length, and temperature affect the solubility of FA molecules in the gastric solution (Cistola et al., 1988; Shiau, 1990; Toro-Vazquez et al., 1991). Moreover, the FA solubility depends on the electrolyte concentration, as well as the ingesta temperature. The FA diffusion-based transference is affected by the ionic strength of the mixture, since the FA solubility is inversely proportional to the electrolyte concentration (Ayala-Bribiesca et al., 2017; Charlton & Smith, 1982). On the one hand, publications evaluating the concentration of calcium ions and their effects on the decreasing of LCFA availability to form mixed micelles and vesicles (Devraj et al., 2013), as well as sodium ions affecting the transport of FAs to a cellular level can be found elsewhere (Hofmann, 1976). On the other hand, study publications evaluating the correlation between the MCFA and gastric electrolyte concentrations are scarce.
Although the lipolysis mechanism, which takes place during the fats and oils digestion, is well known and registered in the literature (Mattson & Volpenhein, 1964),
fat emulsions formed during digestion behave differently, depending on their initial physio-chemical properties. For instance, while the stomach mediates the direct absorption of MCFA (C<12) through the gastric mucosa, LCFAs released in the stomach by digestion are the trigger to the secretion of hormones such as cholecystokinin, which mediate downstream food effects (Koziolek et al., 2018). Furthermore, the gastric lipolysis of TAG comprising MCFA is more efficient than that of TAG comprising LCFA since the latter does not dissociate from the lipid-water interface as readily as MCFAs rich TAG molecules.
time and money expensive, and often are involved in ethic disputes. Various in vitro
digestion protocols have been developed to simulate the lipid digestion, which in the vast majority considers only the intestinal phase (Bakala-N’Goma et al., 2015; Barker et al.,
2014; Williams et al., 2013). It is worth noting that the protocol developed by Minekus et al. (2014) proposed a standardized and practical in vitro static digestion method. This protocol is based on relevant physiological conditions, including the oral, gastric, and intestinal digestion phases.
Thus, this present study is aimed at: i) investigating the effect of electrolyte usually formed during the gastric digestion phase (potassium chloride (KCl), sodium bicarbonate (NaHCO3), and sodium chloride (NaCl)), on the solubility of MCFA; ii) evaluating the influence of the FA carbon chain length on the lipolysis rate during the in vitro simulation intestinal phase digestion of fats, oils, and pure TAG samples.
Methodology
Material
Liquid-liquid equilibrium behavior
The caproic (hexanoic acid) and caprylic (octanoic acid) acids were selected to investigate the effect of the electrolyte concentration on the solubility of MCFA. The salts were selected taking into account the electrolyte concentrations presented in the gastric
fluid, according to the literature (Minekus et al., 2014). Table 1 shows the fatty acids and salts used in this study.
Table 1. Material list
Name CAS code Supplier
Hexanoic acid 142-62-1 Sigma-Aldrich
Octanoic acid 124-07-2 Sigma-Aldrich
Potassium chloride 7447-40-7 Sigma-Aldrich
Sodium bicarbonate 144-55-8 Sigma-Aldrich
In vitro digestion simulation
Samples of tributyrin (Sigma-Aldrich, USA), muru-muru butter and Brazil nut oil, both supplied by Amazon Oil Industry (Brazil), were used in the gastrointestinal digestion simulation. While the pure TAG sample is composed by the short-chain fatty acid (SCFA) butyric acid (C4:0), the muru-muru butter is abundant in MCFA, particularly the lauric acid (C12:0). Meanwhile, the Brazil nut oil major component is a LCFA the oleic acid (C18:1), according to the FA compositions reported in a previous publication by our
research group (Pereira et al., 2019).
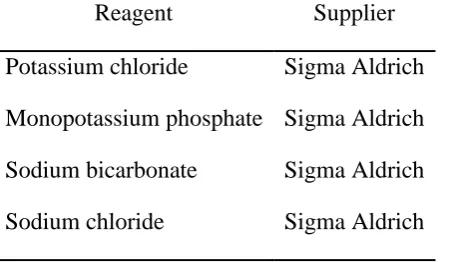
The reagents employed in the simulated gastric fluid (SGF) and simulated
intestinal fluid (SIF) preparations can be found in Table 2.
Table 2. Reagents used in the in vitro digestion simulation experiments
Reagent Supplier
Potassium chloride Sigma Aldrich
Monopotassium phosphate Sigma Aldrich
Sodium bicarbonate Sigma Aldrich
Magnesium chloride Sigma Aldrich
Ammonium carbonate Sigma Aldrich
Chloridric acid Merk
Sodium hydroxide Vetec
Calcium chloride Sigma Aldrich
Pepsin form porcine Sigma Aldrich
Pancreatin Sigma Aldrich
Bile extract Sigma Aldrich
Experimental method
Liquid-liquid equilibrium behavior
Different mass salt concentrations were tested in this study, as given in Table 3. These concentrations were defined from the suggested concentrations given in the literature for each salt (Minekus et al., 2014). All possible binary mixtures containing the selected FA and electrolyte solutions composed by one of the salts were tested. The components were mixed using a 1:1 mass ratio in equilibrium glass cells connected to a thermostatic bath (Cole Parmer, USA) for temperature control. The compounds were weighed in an analytical balance (XT220A, Precisa, Switzerland, precision de 2×10⁻⁴).
Then, the samples were stirred vigorously with a magnetic stirrer (Fisatom, Brasil) for 30
min at 37°C. All systems were left to rest for at least 24 h, to enable phase separation and to ensure the liquid-liquid equilibrium was attained. Samples of both phases were
collected in syringes for the components' quantification.
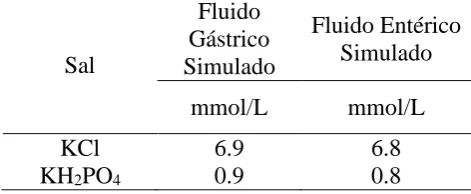
Table 3. Salt concentrations of simulated gastric fluid (Minekus et al., 2014)
Sal
Fluido Gástrico Simulado
Fluido Entérico Simulado
mmol/L mmol/L
KCl 6.9 6.8
NaHCO3 25 85
NaCl 47.2 38.4
MgCl2(H2O)6 0.1 0.33
(NH4)2CO3 0.5 0
Acidity and water contents were determined by titration, using the method 2201 (IUPAC, 1979), and Karl Fischer titration, according to the method Ca 2e-84 (AOCS, 2009) using a KF Titrino plus (model 870, Metrohm, Switzerland). The salt concentrations were calculated by the experimental water concentration, considering the initial concentration of each salt.
In vitro digestion simulation
The selected method to perform the in vitro digestion experiments is that one described by Minekus et al. (2014). This method is based on three steps. The first step, which simulates the oral digestion, was neglected due to the meaningless content of carbohydrates of the samples evaluated here. The experiments were conducted using equilibrium glass cells connected to a thermostatic bath (Cole-Parmer Polystat, USA) at 37 °C, under stirring with a magnetic stirrer (Fisatom, Brazil) at 200 rpm. The gastric digestion was simulated by the addition of the samples, without any previous treatment, SGF, prepared previously according to the protocol described by Minekus et al. (2014),
pepsin from porcine at 25.000 U/ml, calcium chloride solution at 0.3M, and chloridiric acid solution 1M to adjust the pH at 3.0. During the 120 min, in which the mixture remained under agitation, the mixture pH was controlled by a pH meter (Highmed, Brazil). Subsequently, the enteric digestion phase was simulated by the addition of FIS, prepared previously according to the protocol described by Minekus et al. (2014), pancreatin solution at 800 U/ml, calcium chloride solution at 0.3M, and sodium hydroxide solution 1M to adjust the pH at 7.0. Once again, the mixture pH was controlled with the help of a pH meter, and the mixture was maintained under agitation for 120 min. The proportions between samples, simulated fluids, calcium chloride solution, and enzymes can be found in the literature (Minekus et al., 2014).
evaporation using a convection forced air chamber (Marconi, Brazil). The concentration of remaining acylglycerols was determined by difference. In this study, all the measurements were performed at least in triplicate.
At this in vitro simulation study, the acidity content total composition of TAGs were determined at the beginning of the enteric digestion stage and at the end of this same digestion phase. The aim of this procedure was to evaluate the lipolysis rate for TAGs containing FA of various carbon chain length. The increasing of acidity content of the samples and decreasing of total TAG content were used to infer about the lipolysis rate of the several lipids evaluated here.
Modeling
Liquid-liquid equilibrium behavior
The software MATLAB was used for adjusting the binary interaction parameters of the UNIQUAC model, using the experimental equilibrium data for the evaluated systems. The interaction parameters estimation was based on the minimization of the composition objective function (Equation 1), using a modified Simplex method (Nelder & Mead, 1965).
S = ∑ ∑ ∑ [(𝜔𝑖𝑛𝑚
𝑂𝑃,𝑒𝑥𝑝 − 𝜔𝑖𝑛𝑚𝐴𝑃,𝑐𝑎𝑙𝑐 𝜎𝜔 𝑖𝑛𝑚 𝑂𝑃 ⁄ ) 2 + (𝜔𝑖𝑛𝑚 𝐴𝑃,𝑒𝑥𝑝 − 𝜔𝑖𝑛𝑚𝑂𝑃,𝑐𝑎𝑙𝑐 𝜎𝜔 𝑖𝑛𝑚 𝐴𝑃 ⁄ ) 2 ] 𝐶−1 𝑖 𝑁 𝑛 𝐷 𝑚 (1)
Where D is the total numer of data groups; N is the number of concentrations evaluated;
C is the total number of components; ωis mass fraction, and the subscripts i, n, and m are component, concentration, and group number, respectively; exp and calc are calculated and experimental compositions; σ is the standard deviation observed for the phase compositions; the superscripts OP and AP refers to the oil and aqueous phases, respectively.
Because of the presence of electrolytes, it was necessary use the databank available in the literature for parameters of the ions. Tables 4 and 5 show the UNIQUAC parameters related to the ions volume and area, as well as the functional groups of FAs. The systems were considered as pseudo-ternary [FA + water + salt]. The UNIQUAC
al., 2011; Thomsen et al., 1996).
Table 4. Volume and area parameters of the UNIQUAC model for salts
Salts MMa Rk Qk
KCl 74.55 12.6164 12.6276 KH2PO4 136.086 10.5392 10.6281
NaHCO3 84.0 12.4764 14.728
NaCl 58.44 11.7894 11.396 MgCl2(H2O)6 203.3 31.702 31.334
(NH4)2CO3 96.09 15.2037 15.3718
a MM: molar mass.
Table 5. Volume and area parameters of the UNIQUAC for fatty acids Functional
groups Rk Qk
Number of UNIQUAC Groups Caproic acid Caprylic acid
CH3 0.9011 0.85 1 1
CH2 0.6744 0.54 3 5
CH 0.4469 0.23 0 0
CH2COO 1.6764 1.42 1 1
CH=CH 1.1167 0.68 0 0
Results and discussion
Liquid-liquid equilibrium behavior
The experimental data obtained in the LLE study of the systems formed caproic acid and caprylic acid + electrolyte solution are presented in Tables 6 and 7, respectively.
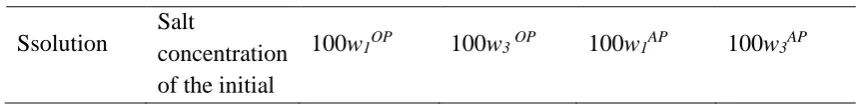
Table 6. Experimental data on the liquid-liquid equilibrium of systems composed by caproic acid (1) + electrolyte solution of potassium chloride, sodium bicarbonate, and sodium chloride (3) at 37 °C. 100w = % mass
Ssolution Salt concentration of the initial
mixture (% mass)
H2O + KCl
0.11 83.65 16.35 0.37 99.63
0.24 85.22 14.78 0.30 99.70
0.47 87.00 13.00 0.93 99.07
1.68 90.00 10.00 1.42 98.58
H2O + NaHCO3
0.44 85.76 14.24 0.49 99.51
0.86 83.74 16.26 0.80 99.20
1.68 79.34 20.66 0.85 99.15
6.74 66.67 33.33 1.06 98.94
H2O + NaCl
0.56 83.95 16.05 0.71 99.29
2.23 86.65 13.35 1.03 98.97
8.94 89.00 11.00 0.48 99.52
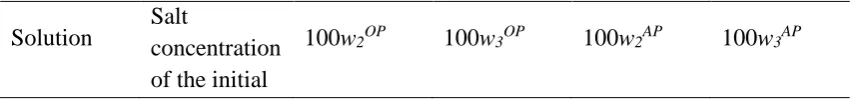
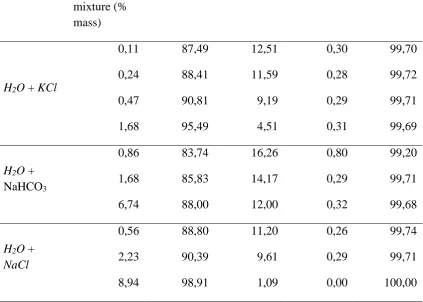
Table 7. Experimental data on the liquid-liquid equilibrium of systems composed by caprylic acid (2) + electrolyte solution of potassium chloride, sodium bicarbonate, and sodium chloride (3) at 37 °C. 100w = % mass
Solution Salt concentration
of the initial
mixture (% mass)
H2O + KCl
0,11 87,49 12,51 0,30 99,70
0,24 88,41 11,59 0,28 99,72
0,47 90,81 9,19 0,29 99,71
1,68 95,49 4,51 0,31 99,69
H2O + NaHCO3
0,86 83,74 16,26 0,80 99,20
1,68 85,83 14,17 0,29 99,71
6,74 88,00 12,00 0,32 99,68
H2O +
NaCl
0,56 88,80 11,20 0,26 99,74
2,23 90,39 9,61 0,29 99,71
8,94 98,91 1,09 0,00 100,00
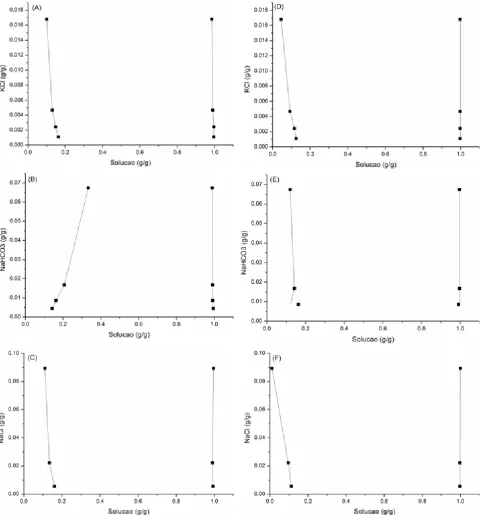
Figure 1. Experimental and predicted electrolyte concentration – aqueous solution concentration diagrams at 37 °C: (A) caproic acid + potassium chloride; (B) caproic
acid + sodium bicarbonate; (C) caproic acid + sodium chloride; (D) caprylic acid + potassium chloride; (E) caprylic acid + sodium bicarbonate; (F) caprylic acid + sodium
chloride. (•) experimental data; (‒ ‒ ‒) UNIQUAC.
electrolyte concentrations of the systems. Moreover, the model described the experimental mass cocentrations with an overall deviation of 0.13%.
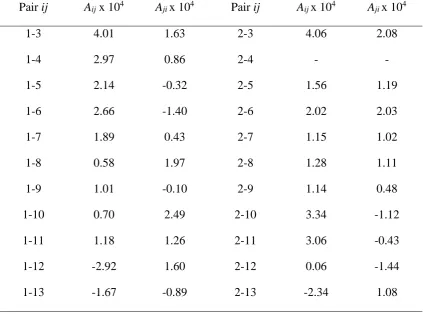
Table 8. Adjusted binary interaction parameters of the UNIQUAC model. Components: (1) caproic acid; (2) caprylic acid; (3, 6, 8, 11) KCl solutions at 13.8, 27.6, 53.2, and 106.4 mM, respectively; (5, 10, 13) NaHCO3 solutions at 50, 100, 200, and 400 mM,
respectively; (4, 7, 9, 12) NaCl solutions at 47.2, 94.4, 188.8, and 377.6 mM, respectively
Pair ij Aij x 104 Aji x 104 Pair ij Aij x 104 Aji x 104
1-3 4.01 1.63 2-3 4.06 2.08
1-4 2.97 0.86 2-4 - -
1-5 2.14 -0.32 2-5 1.56 1.19
1-6 2.66 -1.40 2-6 2.02 2.03
1-7 1.89 0.43 2-7 1.15 1.02
1-8 0.58 1.97 2-8 1.28 1.11
1-9 1.01 -0.10 2-9 1.14 0.48
1-10 0.70 2.49 2-10 3.34 -1.12
1-11 1.18 1.26 2-11 3.06 -0.43
1-12 -2.92 1.60 2-12 0.06 -1.44
1-13 -1.67 -0.89 2-13 -2.34 1.08
As one may notice from Figure 1 and the overall deviation between predicted and experimental results, the use of conventional UNIQUAC was satisfactory to describe the effect of several electrolyte concentrations on the systems. Hence, the use of more complex modeling approaches, considering the presence of ions, was not found to be critical. This class of sophisticated modeling approaches tends to decrease the flexibility of the modeling method and demands the inclusion of structural parameters related to the salt ions and water molecules.
are in agreement with the literature and can be explained by the increase of the ionic strength of the mixture, which limits the solubility of the FAs. It worth noting that electrolyte concentrations evaluated here are superior to those usually found in the gastric
fluid. Thus, the results obtained here suggest that the ingestion of salts, such as those evaluated in this study, tends to decrease the FA solubility in the gastric fluid.
Results and discussion
In vitro digestion simulation
Table 10 shows the obtained results for the in vitro digestion simulation experiments.
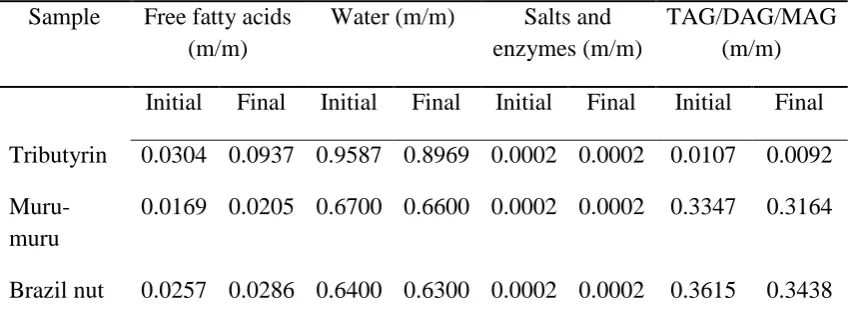
Table 10. Free fatty acids, water, salts, and enzyme contents of triglyceride samples submitted to the in vitro digestion simulation
Sample Free fatty acids (m/m)
Water (m/m) Salts and enzymes (m/m)
TAG/DAG/MAG (m/m)
Initial Final Initial Final Initial Final Initial Final
Tributyrin 0.0304 0.0937 0.9587 0.8969 0.0002 0.0002 0.0107 0.0092
Muru-muru
0.0169 0.0205 0.6700 0.6600 0.0002 0.0002 0.3347 0.3164
Brazil nut 0.0257 0.0286 0.6400 0.6300 0.0002 0.0002 0.3615 0.3438
It can be seen from Table 10 that the increases in acidity content between the initial and final point of the enteric digestion simulation stage were distinct for each lipid sample evaluated here. In the experiment performed with tributyrin, the increase in acidity content was 67.56%. Meanwhile, the muru-muru butter and Brazil nut oil experiments displayed acidity content increases of 17.56% and 10.14%, respectively. These results indicate that the action of the pancreatic enzyme, promoter of the lipolysis reaction, occurred preferentially in TAG molecules comprised by SCFA (C4:0) from the tributyrin
sample. Taking into account only the fat and oil samples evaluated here, it can be observed that the lipolysis rate of the muru-muru sample, comprised majorly by MCFA
These results can be explained by the specificity of the pancreatic lipase for the
sn-1 and sn-3 positions of the glycerol backbone and its higher activity for SCFA and MCFA, which are rapidly hydrolyzed by this enzyme (Singh & Gallier, 2013).
Accordingly, considering the results presented here, it can be inferred that the lipolysis took place at distinct rates, and the enzyme activity is higher in TAG molecules comprised by FA of short and medium chains, when compared against those molecules composed by LCFA. However, because the utilization of the gastric lipase is not comprehended in the protocol adopted in these experiments, it could not been elucidated in the present study what is its influence on the lipolysis rate during the gastric digestion phase. It is known that from 5 to 40% of dietetic triglycerides are hydrolyzed by the gastric lipase in the stomach, and this enzyme has also a preferential activity for SCFA and MCFA in the sn-1 and sn-3 of the glycerol backbone (Gallier & Singh, 2012a).
Nevertheless, this present study casts new light on the fat digestion process, since it shows that the activity of the pancreatic lipase is inversely proportional to the carbon chain length of the FA molecules components of the triglyceride.
Acknowledgments
Ericsem Pereira thanks the São Paulo Research Foundation (FAPESP) (2017/16979-7) for the scholarship and financial support. The authors thank the national funding agencies FAPESP (2014/2152-0 and 2016/08566-1) and the National Council for Scientific and
Technological Development (CNPq) (305870/2014-9 and 406963/2016-9) for their financial support and scholarships. This study was also financed in part by the
Coordenação de Aperfeiçoamento de Pessoal de Nível Superior e Brasil (CAPES) e Finance Code 001.
References
AOCS. (2009). Official Methods and Recommended Practices of the AOCS (D. Firestone (ed.); 6th ed.). American Oil Chemists’ Society.
https://doi.org/10.1093/ajcn/70.6.1096
Ayala-Bribiesca, E., Turgeon, S. L., & Britten, M. (2017). Effect of calcium on fatty
acid bioaccessibility during in vitro digestion of Cheddar-type cheeses prepared with different milk fat fractions. Journal of Dairy Science, 100(4), 2454–2470.
https://doi.org/10.3168/jds.2016-11902
Bakala-N’Goma, J. C., Williams, H. D., Sassene, P. J., Kleberg, K., Calderone, M., Jannin, V., Igonin, A., Partheil, A., Marchaud, D., Jule, E., Vertommen, J., Maio, M., Blundell, R., Benameur, H., Müllertz, A., Pouton, C. W., Porter, C. J. H., & Carrière, F. (2015). Toward the establishment of standardized in vitro tests for lipid-based formulations. 5. lipolysis of representative formulations by gastric lipase. Pharmaceutical Research, 32(4), 1279–1287.
https://doi.org/10.1007/s11095-014-1532-y
Barker, R., Abrahamsson, B., & Kruusmägi, M. (2014). Application and Validation of an Advanced Gastrointestinal In Vitro Model for the Evaluation of Drug Product Performance in Pharmaceutical Development. Journal of Pharmaceutical Sciences,
103(11), 3704–3712. https://doi.org/10.1002/jps.24177
Bernbäck, S., Bläckberg, L., & Hernell, O. (1989). Fatty acids generated by gastric lipase promote human milk triacylglycerol digestion by pancreatic colipase-dependent lipase. Biochimica et Biophysica Acta (BBA) - Lipids and Lipid Metabolism, 1001(3), 286–293. https://doi.org/10.1016/0005-2760(89)90113-6
Charlton, S. C., & Smith, L. C. (1982). Kinetics of transfer of pyrene and rac-1-oleyl-2-[4-(3-pyrenyl)butanoyl]glycerol between human plasma lipoproteins.
Biochemistry, 21(17), 4023–4030. https://doi.org/10.1021/bi00260a018
Cistola, D. P., Hamilton, J. A., Jackson, D., & Small, D. M. (1988). Ionization and phase behavior of fatty acids in water: application of the Gibbs phase rule.
Biochemistry, 27(6), 1881–1888. https://doi.org/10.1021/bi00406a013
International Journal of Pharmaceutics, 441(1–2), 323–333. https://doi.org/10.1016/j.ijpharm.2012.11.024
Gallier, S., & Singh, H. (2012a). Behavior of almond oil bodies during in vitro gastric and intestinal digestion. Food & Function, 3(5), 547.
https://doi.org/10.1039/c2fo10259e
Gallier, S., & Singh, H. (2012b). The physical and chemical structure of lipids in relation to digestion and absorption. Lipid Technology, 24(12), 271–273. https://doi.org/10.1002/lite.201200240
Hofmann, A. F. (1976). Fat Digestion: The Interaction of Lipid Digestion Products with Micellar Bile Acid Solutions. In Lipid Absorption: Biochemical and Clinical Aspects (pp. 3–21). Springer Netherlands. https://doi.org/10.1007/978-94-011-7176-2_1
IUPAC. (1979). Determination of the Acid Value (A. V.) and the Acidity. In C. Paquot (Ed.), Standard Methods for the Analysis of Oils, Fats and Derivatives (6th ed., Issue note 2, pp. 52–55). Elsevier. https://doi.org/10.1016/B978-0-08-022379-7.50021-8
IUPAC. (1991). Standard methods for the analysis of oils, fats and derivatives. In A.Dieffenbacher & W. D. Pocklington (Eds.), International Union of Pure and Applied Chemistry Applied Chemistry Division Commission on Oils, Fats and
Derivatives (7th ed.). Blackwell Scientific Publications. https://doi.org/10.1351/pac198254061257
Kang, J. W., Diky, V., Chirico, R. D., Magee, J. W., Muzny, C. D., Abdulagatov, I., Kazakov, A. F., & Frenkel, M. (2011). A new method for evaluation of UNIFAC
interaction parameters. Fluid Phase Equilibria, 309(1), 68–75. https://doi.org/10.1016/J.FLUID.2011.07.001
Koziolek, M., Carrière, F., & Porter, C. J. H. (2018). Lipids in the Stomach – Implications for the Evaluation of Food Effects on Oral Drug Absorption.
Pharmaceutical Research, 35(3). https://doi.org/10.1007/s11095-017-2289-x
Minekus, M., Alminger, M., Alvito, P., Ballance, S., Bohn, T., Bourlieu, C., Carrière, F., Boutrou, R., Corredig, M., Dupont, D., Dufour, C., Egger, L., Golding, M., Karakaya, S., Kirkhus, B., Le Feunteun, S., Lesmes, U., Macierzanka, A., Mackie, A., … Brodkorb, A. (2014). A standardised static in vitro digestion method
suitable for food – an international consensus. Food & Function, 5, 1113–1124. https://doi.org/10.1039/c3fo60702j
Nelder, J. A., & Mead, R. (1965). A Simplex Method for Function Minimization. The Computer Journal, 7(4), 308–313. https://doi.org/10.1093/comjnl/7.4.308
Pereira, E., Ferreira, M. C., Sampaio, K. A., Grimaldi, R., Meirelles, A. J. de A., & Maximo, G. J. (2019). Physical properties of Amazonian fats and oils and their blends. Food Chemistry, 278(October 2018), 208–215.
https://doi.org/10.1016/j.foodchem.2018.11.016
Phan, S., Salentinig, S., Gilbert, E., Darwish, T. A., Hawley, A., Nixon-Luke, R., Bryant, G., & Boyd, B. J. (2015). Disposition and crystallization of saturated fatty acid in mixed micelles of relevance to lipid digestion. Journal of Colloid and Interface Science, 449, 160–166. https://doi.org/10.1016/j.jcis.2014.11.026
Shiau, Y. F. (1990). Mechanism of intestinal fatty acid uptake in the rat: the role of an acidic microclimate. The Journal of Physiology, 421(1), 463–474.
https://doi.org/10.1113/jphysiol.1990.sp017955
Singh, H., & Gallier, S. (2013). Understanding Lipid Structures and Digestibility.
International News on Fats, Oils, and Related Materials, 24(3), 134–140.
Singh, H., Ye, A., & Horne, D. (2009). Structuring food emulsions in the
gastrointestinal tract to modify lipid digestion. Progress in Lipid Research, 48(2),
92–100. https://doi.org/10.1016/j.plipres.2008.12.001
Thomsen, K., Rasmussen, P., & Gani, R. (1996). Correlation and prediction of thermal properties and phase behaviour for a class of aqueous electrolyte systems.
Chemical Engineering Science, 51(14), 3675–3683. https://doi.org/10.1016/0009-2509(95)00418-1
American Oil Chemists Society, 68(8), 596–599. https://doi.org/10.1007/BF02660160
Williams, H. D., Sassene, P., Kleberg, K., Calderone, M., Igonin, A., Jule, E.,
Vertommen, J., Blundell, R., Benameur, H., Müllertz, A., Pouton, C. W., & Porter,
C. J. H. (2013). Toward the Establishment of Standardized In Vitro Tests for Lipid-Based Formulations, Part 3: Understanding Supersaturation Versus