Technology (IJRASET)
Insurance Fraud Detection Using Big Data
Analytics
A.Saran Kumar1, V.Vanitha Devi2
1,2
M.E. Scholar , CSE Department , Kumaraguru College Of Technology, Coimbatore, India
Abstract— The volume of data available to businesses from both internal systems and external channels has led to a new category of application known as “Big Data”. For insurers, the benefits of using analytical applications that tap into the Big Data stream are significant. These applications can provide information to enhance sales, marketing, operational activities that reduce costs and strategies to better understand and reduce risk. Handling fraud manually has always been costly for insurance companies, even if one or two low risk incidences of high value fraud went undetected. In addition to this, the growth in unstructured data always leaves lot of room for fraud going undetected, if data is not analyzed thoroughly. Traditionally, insurance companies use statistical models to identify fraudulent claims. Big Data Analytics addresses the big data challenges and plays a crucial role in fraud detection for insurance companies. Big Data applications are providing a faster, easier solution for insurers. Hadoop is an excellent open source framework for Big data analytics. The objective of the project is to develop a risk assessment model using Big Data Analytics for insurance fraud detection implemented in hadoop framework that analyzes and processes large volume of customer reference data that are dynamic, diverse in formats and change frequently.
Keywords— Fraud triangle, fraud indicators, Fico model, Profiling, CRM.
I. INTRODUCTION
Data Sets that are large in size and complex to process are generally referred to as big data. In this Information age, the data set is large and we constantly work in situations where there is a constant change in content and volume of data. So, processing of these large data sets to extract the necessary information is mandatory. For processing of large data sets, there is always a possibility that the result obtained will be an optimal one for the longer run. But the disadvantage in large data processing is that, the time consumed for processing is high. So to overcome this limitation, various analytical and statistical methods were developed. One amongst them is the usage of a distributed environment. Here the large data set is divided and passed to various nodes within the cluster. Each cluster processes a partitioned data set and the results are stored.
A. Big Data Analysis
Big data analytics is the process of examining large amounts of data of a variety of types to uncover hidden patterns, unknown correlations and other useful information. Such information can provide competitive advantages over rival organizations and result in business benefits, such as more effective marketing and increased revenue. The primary goal of big data analytics is to help companies make better business decisions by enabling data scientists and other users to analyse huge volumes of transaction data.The various factors involved in the Big Data analysis are volume, variety and velocity.
B. Hadoop Framework
Hadoop is a free java based programming framework that supports the processing of large datasets in a distributed computing environment.
C. HDFS Architecture
Technology (IJRASET)
Fig.1 HDFS Architecture
The NameNode and DataNode are pieces of software designed to run on commodity machines. These machines typically run a GNU/Linux operating system (OS). HDFS is built using the Java language; any machine that supports Java can run the NameNode or the DataNode software. Usage of the highly portable Java language means that HDFS can be deployed on a wide range of machines. A typical deployment has a dedicated machine that runs only the NameNode software. Each of the other machines in the cluster runs one instance of the DataNode software. The architecture does not preclude running multiple DataNodes on the same machine but in a real deployment that is rarely the case.
D. Map Reduce Model
One method of processing large data sets is using map/reduce framework. Map/Reduce is a programming model and an associated implementation for processing and generating large data sets. It was first developed at Google by Jeffrey Dean and Sanjay Ghemawat. It was initially developed to find the most frequently used queries in Google and display the adequate results in a short span of time. The Map/Reduce was designed to achieve fault tolerance, load balancing, data distribution and task parallelization. The framework enables a programmer to write simple units of work as map and reduce functions. The framework then automatically takes care of partitioning and parallelizing the task on a large cluster of inexpensive commodity machines. Owing to its ability to split data and process quickly it can be used for big data analytics. The data is disintegrated depending upon the size by the framework and processed. In a Map/Reduce environment the node which controls the partition and distribution is the master node. The intermediate results are then passed to the master node which selects the required result. The programming model is based on the following, simple concepts:
1) Iteration over the input
2) computation of key/value pairs from each piece of input
3) grouping of all intermediate values by key
4) iteration over the resulting groups
Technology (IJRASET)
E. Hadoop Architecture
The job execution starts when the client program submit to the JobTracker a job configuration, which specifies the map, combine and reduce function, as well as the input and output path of data. The general structure of the hadoop architecture is as shown in Fig 2.The JobTracker will first determine the number of splits (each split is configurable, ~16-64MB) from the input path, and select some TaskTracker based on their network proximity to the data sources, then the JobTracker send the task requests to those selected TaskTracker.
Fig.2: Hadoop -Map Reduce architecture.
Each TaskTracker will start the map phase processing by extracting the input data from the splits. For each record parsed by the “InputFormat”, it invoke the user provided “map” function, which emits a number of key/value pair in the memory buffer. A periodic wakeup process will sort the memory buffer into different reducer node by invoke the “combine” function. The key/value pairs are sorted into one of the R local files. When the map task completes, the TaskTracker will notify the JobTracker. When all the TaskTrackers are done, the JobTracker will notify the selected TaskTrackers for the reduce phase. Each TaskTracker will read the region files remotely. It sorts the key/value pairs and for each key, it invoke the “reduce” function, which collects the key/aggregated Value into the output file. Map/Reduce framework is resilient to crash of any components. The JobTracker keep tracks of the progress of each phases and periodically ping the TaskTracker for their health status. When any of the map phase TaskTracker crashes, the JobTracker will reassign the map task to a different TaskTracker node, which will rerun all the assigned splits. If the reduce phase TaskTracker crashes, the JobTracker will rerun the reduce at a different TaskTracker. After both phase completes, the JobTracker will unblock the client program.
II. INSURANCE FRAUD DETECTION
A. Fraud Risk In Insurance
Fraud comes in all shapes and sizes. It may be a simple act involving one person or it may be complex operation involving a large number of people from within and outside the insurer. The types of fraud:
1) Internal fraud – Fraud against the insurer by a Board member, senior manager or other member of staff on his/her own or in collusion with others who are either internal or external to the insurer
Technology (IJRASET)
person or people in collusion by obtaining wrongful coverage or payment.3) Intermediary fraud – Fraud by intermediaries against the insurer, policyholders, customers or beneficiaries. There are other types of fraud that affect insurers, which are not covered in this paper, such as:
a) Fraud committed by contractors or suppliers that do not play a role in the settlement of insurance claims.
b) Fraud by misrepresentation of insurance cover to attract investors, obtain favourable loans or authorisations or other types of favourable decisions from public authorities.
B. Fraud Triangle
There are three basic components that contribute to the occurrence of fraud as shown in fig.3.
Fig: 3 Fraud triangles
People commit fraud for a variety of reasons. They could, for example, have financial problems or be under pressure to meet unrealistic business objectives. Insurers should be aware of the potential for these conditions to exist and look for signs of possible fraud.
Fraudsters need to have the opportunity to commit fraud. They are more likely to act when they think the likelihood of detection is small. Therefore insurers should have proper policies, procedures and controls to both prevent fraud from taking place and, if fraud does take place, to detect it.
III. EXISTING RISK MODELS
A. Diagnostic Fraud Indicators
Based on industry knowledge, diagnostic fraud indicators are used to identify circumstances that suggest greater statistical significance that the case might contain elements of deceit. The claims handler would typically be responsible for completing a survey on the diagnostic fraud indicators before the claim will be processed, so these indicators are usually based on the biased judgment of the claims handler. Unconsolidated data in disparate systems makes it difficult to test these checks and fraudsters are quick to learn the rules.
B. Anomaly Detection
Similar to exception reporting, Anomaly detection refers to detecting patterns in a given data set that do not conform to an established normal behaviour. The thresholds can be determined by expert judgment or statistical techniques. The patterns that are detected are called anomalies and are often translated into critical and actionable information. Anomalies are also referred to as outliers, abnormalities, deviations, exceptions, or peculiarities. This is similar to the familiar exception reporting.
C. Profiling
Profiling is used to construct an outline of an entity's individual characteristics. Profiling can be done by using cluster analysis or segmentation analysis (for example, to compare a new
claim with the typical profile of a suspicious claim).
Technology (IJRASET)
consists of dozens or even hundreds of variables, involving both categorical and numerical data with noisy information. Profiling is to identify factors and variables that best summarize the segments. Fortunately, this problem can be overcome with Hotspot Profiling Analysis Tools. Hotspot profiling analysis drills-down data systematically and detects important relationships, co-factors, interactions, dependencies and associations amongst many variables and values accurately using Artificial Intelligence techniques such as incremental learning and searching, and generate profiles of most interesting segments. It is noted that insurance premiums are normally stipulated with profiles of risky (or very low-risk) policy holders. Hotspot analysis can identify profiles of high (and low) risk policies accurately through thorough analysis of all available insurance data. It is noted that the same can be applied to other quantifiable risk insurances such as credit insurance, general insurance, and so on.
D. Whistle blowing
Whistle-blowing, as it relates to fraud, is the act of reporting fraud, waste, and abuse. Reporting any act of wrongdoing is considered whistle-blowing, regardless if it’s reported by a public or private employee or to persons inside or outside of the victim organization. Anyone can report wrongdoing, but the level of protection an employee will receive will differ depending on whether they’re public or private, to whom they report, the manner in which they report, the type of wrongdoing they report, and the law under which they report.
F. FICO Model
Fico uses the application of powerful analytical technologies to derive the adjuster’s implicit logic by using historical data and discussions with insurer’s experts. It works with adjusters to understand data on which their decisions are typically based. The data will include the specific circumstances of the claim.Fico have reduced losses due to fraudulent claims across multiple lines of business as much as 20% to 50%.They have reduced loss adjustment expenses by 20% to 25%.
F. Naive Bayes Classification Algorithm
The classification algorithm that is used in the project is probability based model which is similar to the naïve bayes algorithm. The Naive Bayes algorithm is one of the most important supervised machine learning algorithms for classification. This classifier is a simple probabilistic classifier based on applying Bayes’ theorem as follows:
P (A|B) = ( | ) ( ) ( )
Naive Bayes classification has an assumption that attribute probabilities P ( | ) are independent given the class , where is ith attribute of the data instance. This assumption reduces the complexity of the problem to practical and can be solved easily. Despite the simplification of the problem, the Naive Bayes classifier still gives us a high degree of accuracy.
IV. LITERATURE SURVEY
A. Three innovative fraud detection methods
These are the existing methods [1] that are used for fraud detection.
1) Social Network Analysis (SNA): Social network analysis is a strategy for investigating social structures through the use of network and graph theories. Let’s take an example to explain the use of social network analysis (SNA). In a car accident, all people in the vehicle have exchanged addresses and phone numbers and provided them to the insurer. However, the address given by one of the accident victims may have many claims or the driven vehicle may have been involved in other claims. Having the ability to cull this information saves time and gives the insurer an insight into the parameters involved in the fraud case. SNA allows the company to proactively look through large amounts of data to show relationships via links and nodes.
The SNA tool combines a hybrid approach of analytical methods. The hybrid approach includes organizational business rules, statistical methods, pattern analysis, and network linkage analysis to really uncover the large amounts of data to show relationships via links. When one looks for fraud in a link analysis, one looks for clusters and how those clusters link to other clusters. Public records such as judgments, foreclosures, criminal records, address change frequency, and bankruptcies are all data sources that can be integrated into a model.Using the hybrid approach, the insurer can rate these claims. If the rating is high, it indicates that the claim is fraudulent. This may be because of a known bad address or suspicious provider or vehicle in many accidents with multiple carriers.
SNA follows this path:
Technology (IJRASET)
transformed and loaded into a data warehouse.b) The analytics team uses information across a wide variety of sources and scores the risk of fraud and prioritizes the likelihood based on multiple factors. The information used can range anywhere from a prior conviction, a relationship in some manner to another individual with a prior case, multiple rejected claims, odd combinations of data, or even odd modifications to personal information.
c) Technologies such as text mining, sentiment analysis, content categorization and social network analysis are integrated into the fraud identification and predictive modelling process.
d) Depending on the score of the particular network, an alert is generated.
e) The investigators can then leverage this information and begin researching more on the fraudulent claim.
f) Finally, issues or frauds that are identified are added into the business use case system, which is a part of the hybrid framework.
2) Predictive Analytics for Big Data: Predictive analytics include the use of text analytics and sentiment analysis to look at big data for fraud detection. Consider a scenario when a person raises a claim saying that his car caught fire, but the story that was narrated by him indicates that he took most of the valuable items out prior to the incident. That might indicate the car was torched on purpose. Claim reports span across multiple pages, leaving very little room for text analytics to detect the scam easily. Big data analytics helps in sifting through unstructured data, which wasn’t possible earlier and helps in proactively detecting frauds. There has been an increase in the use of predictive analytics technology, which is a part of big data analytics concept, to spot potentially fraudulent claims and speed the payment of legitimate ones. In the past, predictive analytics were used to analyze statistical information stored in the structured databases, but now it is branching out into the big data realm. The potential fraud present in the written report above is spotted using text analytics and sentiment analysis. Here’s how the text analytics technology works:
a) Claim adjusters write long reports when they investigate the claims
b) Clues are normally hidden in the reports, which the claims adjuster would not have noticed
c) However, the computing system, which is based on business rules, can spot evidence of possible fraud.
d) The most important point to observe is that people who usually commit fraud alter their story over time. The fraud detection system can spot these discrepancies
3) Social Customer Relationship Management (CRM): Social CRM is neither a platform nor a technology, but rather, a process. It is important that insurance companies link social media to their CRM. When social media is integrated within multiple layers of the organization, it enables greater transparency with customers. Mutually beneficial transparency indicates that the company trusts its customers and vice versa. This customer-centric ecosystem reinforces the fact that increasingly the customer is in control. This customer-centric ecosystem can be beneficial to the business as well, if the business is able to leverage the collective intelligence of its customer base.Social CRM uses a company’s existing CRM and gathers data from various social media platforms. It uses a ‘listening’ tool to extract data from social chatter, which acts as reference data for the existing data in the current CRM. The reference data along with information stored in the CRM is fed into a case management system. The case management system then analyses the information based on the organization’s business rules and sends a response. The response from the claim management system as to whether the claim is fraudulent or not, is then confirmed by investigators independently, since the output of social analytics is just an indicator and should not be taken as the final reason to reject a claim.
B. A Fraud Detection Approach With Data Mining
Fraud can be seen in all insurance types including health insurance [11]. Fraud in health insurance is done by intentional deception or misrepresentation for gaining some shabby benefit in the form of health expenditures. Data mining tools and techniques can be used to detect fraud in large sets of insurance claim data. Based on a few cases that are known or suspected to be fraudulent, the anomaly detection technique calculates the likelihood or probability of each record to be fraudulent by analyzing the past insurance claims. The analysts can then have a closer investigation for the cases that have been marked by data mining software.
V. SYSTEM DESIGN
A. Fico model
Fico model is used for risk assessment in this project. Fico uses a combination of facilitated discussion with an insurer’s expert adjusters, the systematic collection of historical data and the application of powerful analogical technologies to draw out the adjusters’ implicit logic. This includes the following steps:
Technology (IJRASET)
2) Putting data in order3) Analyzing the data
Fig:4 Fico model
As shown in the figure 4. It consists of historical data which are collected from various sources. The fraud status data that is collected and historical claims data which are extracted are stored in model development data. This model uses some training process like probability based model to classify the records.
B. Fraud indicators
1) Indicators: The indicators below are reproduced exactly as they were presented to adjusters. Note, however, that adjusters were given detailed explanations of these indicators along with the list. The indicators below have been flagged as significant in explaining the probability of fraud in a file.
a) Accident/damage
b) Financial
c) Settlement
d) Claimant/insured
VI. WORKING OF THE PROJECT
A. Training phase
In this phase the number of attributes are manually mentioned in the program. Its power of 2 is then calculated. For example, if there is 5 attributes then we get 32 combinations of attributes. These combination is taken as rules. Now, the occurrences of the combination in dataset is calculated and thus we obtain the probability. By setting the threshold manually, the rules are filtered. Thus the rule set is mined. For example, let us take a dataset having four attributes namely name, age, and gender and driving rate. We obtain 16 combinations. One of the combination is gender and driving rate. There are number of tuples which may satisfy one rule like a record having driving rate as excellent and gender as female and this is legal claim. Thus occurrences of this type of records is calculated to obtain probability.
B. Testing phase
In this phase, the testing dataset should have the same no.of attributes. Again the 2 power combinations are found. Hence we obtain the combination of attributes for each record which can be used to compare with the generated rules. Then the navie’s bayes classification is used. In this, the rules and the obtained records is compared. Each record satisfies numerous rules. The probability
Extract
Model
Development
Data
Collect
Historical
Fraud Status
Data
dDDD DaDD
Model Training
process
Results
Historical
claims data
Technology (IJRASET)
upon the highest probability.C. Algorithm
Algorithm for rule generation
Input: key is the first value is the tuples in the dataset.
Output: <key, value >, where the key is the decimal number which acts as rule id value is the attributes group value. Mapper:
1) it shd be brief
2) Each number indicates a rule Id which is a decimal number.
3) Find the binary number for each decimal and store the binary in the array. 4) The place of ones in the array is the attribute combination for that rule. 5) Emit the id and the attributes to the reducer.
Reducer:
1) Find the probability for each rule using the key and the value emitted by the mapper. 2) Set a threshold for the rules.
3) Emit the key as rule id and value as the combination of the attributes forming the rules. Algorithm for testing (I)
Input: key is the record id , value is the tuples in the testing dataset.
Output: <key , value >, where the key is the decimal number which acts as rule id value is the combination of the attributes value. Mapper:
1)it shd be brief
3) Find the binary number for each decimal and store the binary in the array. 4) The place of ones in the array is the attribute combination for that rule. 5) Emit the id and the attribute to the reducer.
Reducer:
1) Find the probability for each rule using the key and the value emited by the mapper. 2) Set a threshold
3) Emit the key as rule id and value as the combination of the attributed satisfying the rules. Algorithm for testing (II)
Input: The outputs obtained from both the above programs which is the rules and test data values that satisfy the combination of attributes for each rule./////
Output: The decimal number which acts as record id of the test data and it indicates whther it is fraud or legal. 1) Read both the outputs from the file and put it 2-D array.
2) Compare both the arrays.
3) Calculate cumulative multiplication of the probability for both legal and fraud. 4) Each record set there obtains a value for both legal and fraud.
5) Compare the values and record set is assigned legal or fraud depending on the greatest value among them.
D. Results
By using the above logic, we studied the execution of fraud detection by varying the no.of tuples. Here depending upon the size of the inputs, the time involved for processing the given inputs vary. The results obtained are tabulated below.
S.No
Number of tuples
Threshold set €
Execution Time(in seconds)
Number of fraud Obtained
1 13000 0.4 24 3000
2 10000 0.1 23 1000
3 7000 0.75 20 1000
4 25000 0.5 30 7000
Table 1 Comparison of results for various inputs
Technology (IJRASET)
as 0.4.We see that it executes in 24 seconds and we get 3000 fraud records. We then vary the threshold and no.of tuples and we obtain different result. We then vary the input graph with only 7000 tuples sand threshold as 0.75. It gets executed in a different time period. Thus, we see that the execution time vary slightly with varying size of graph and also with the varying threshold €.Hence we can easily process any type of big dataset and detect the fraud.
[image:10.612.88.543.151.398.2]F. Snapshots
[image:10.612.91.541.427.674.2]Fig 5 Generating Rules without threshold
Fig 5 shows the screenshot of the rules generated. The rules are generated by taking the combination of the attributes and finding the probability of occurrences. Here in this all the combinations are taken.
Fig 6. Generating Rules with threshold
Technology (IJRASET)
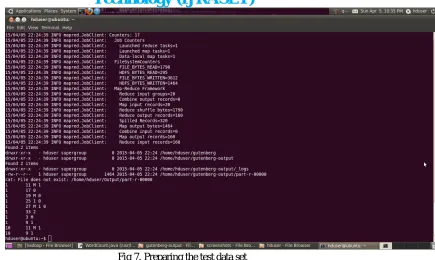
Fig 7. Preparing the test data set
[image:11.612.87.543.367.634.2]Fig 7. illustrates the preparation of test data set for giving it to naïve base classification. Here all the records are grouped by attributes according to the rules.
Fig 8. Final Output
Fig 8. shows which records are fraud and which one are legal. This is done through naïve bayes classification.
VII. CONCLUSIONS AND FUTURE WORK
Technology (IJRASET)
used for classification where the cumulative multiplication of probability is calculated from each rule. The records are then classified according to the probability obtained. Due to the use of parallel processing the execution time is very much reduced. Map reduce makes the aggregation and grouping automatically and hence its easy. As the attributes are not selected manually, hidden rules are also generated. Thus, all frauds can be easily detected in large data sets in short time. In future, the classification algorithm which is based on probability can be optimized using naive bayes classification algorithm. The threshold setting can also be automated using the training dataset.
REFERENCES
[1] Barse, E., Kvarnstrom, H. & Jonsson, E. (2003). Synthesizing Test Data for Fraud Detection Systems. Proc. of the 19th Annual Computer Security Applications Conference, 384-395.
[2] Ruchi Verma, Sathyan R Mani, “Use of Big Data Tehnologies in Capital Markets,” 2012 Infosys Limited, Bangalore, India.
[3] Bell, T. & Carcello, J. (2000). A Decision Aid for Assessing the Likelihood of Fraudulent Financial Reporting. Auditing: A Journal of Practice and Theory 10(1): 271-309.
[4] Bhargava, B., Zhong, Y., & Lu, Y. (2003). Fraud Formalization and Detection. Proc. of DaWaK2003, 330-339.
[5] Thakur S S. &Sing J K, Prediction of Online Vehicle Insurance System using Bayes Classifier – A Proposed Approach, International Journal of Computer Applications (0975 – 8887) Volume 49– No.16, July 2012
[6] Cherkassky, V. and Mulier, F. Learning from Data: Concepts, Theory, and Methods. Wiley Interscience, 1998.
[7] Langley, P., Iba, W., and Thompson, K. An analysis of Bayesian classifiers. In Proc. of the 10th National Conf. on Artificial Intelligence, pages 223-228, 1992. [8] Anna Jurek & Danuta Zakrzewska, Improving Na¨ıve Bayes Models of Insurance Risk by Unsupervised Classi
[9] fication, Proceedings of the International Multiconference on Computer Science and Information Technology pp. 137–144C. Apte, E. Grossman, E. Pednault, B. Rosen, F. Tipu and B. White, “Probabilistic estimation based data mining for discovering insurance risks,”IEEE Intelligent Syst., vol. 14, 1999, pp. 49–58. [10] S. Viaene, R. A. Derrig and G. Dedene, “A case study of applying boosting Na¨ıve Bayes to claim fraud diagnosis,”,IEEE T. Knowl. Data En., vol. 16, 2004,
pp. 612–620.