5
VIII
August 2017
Application of Taguchi Technique for Optimizing
the Input Parameters During EDM of Mild Steel
Using Copper Electrode
Mahesh S S1, Dr B M Rajaprakash2, Dr Rajashekar3
1Research scholar, Department of Mechanical Engineering, UVCE, Bangalore, INDIA 2Professor and chairman, Department of Mechanical Engineering, UVCE, Bangalore, INDIA
3Assistant Professor, Department of Mechanical Engineering, UVCE, Bangalore, INDIA
Abstract: In this present research study, Taguchi method is applied for determining optimum input parameters for machining of mild steel work piece using copper as electrode. Input parameters of Electrical Discharge Machining (EDM) analysed are pulse current (Ip), pulse on time (Ton) and Gap voltage (Vg). Based on Taguchi technique, it has been successfully used to determine the optimum values of input parameters for maximum Material Removal Rate (MRR) and minimum Surface Roughness (Ra). The relative importance of the machining parameters with respect to MRR and Ra is investigated by Analysing of Variation (ANOVA).
Keywords: Electrical Discharge Machining (EDM), Taguchi technique, Analysing of Variation ANOVA, MRR and Ra.
I. INTRODUCTION
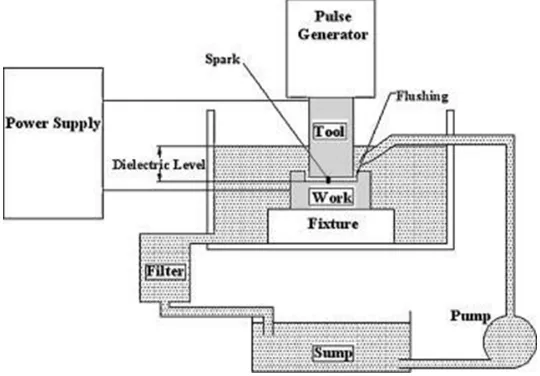
[image:2.612.189.459.523.711.2]In previous years, machining of hard materials was difficult process. Non- traditional Machining method primarily used for hard metals or those that would be impossible to machine with traditional techniques. Electrical Discharge Machining (EDM) is precisely solution to machining approaches. EDM is a Thermo electrical process in which spark erosion take place between the work piece and the electrode. The machining surface of the work piece is immersed in a dielectric fluid. Practically EDM is the material removal mechanism in which fluid acts as a coolant and the molten part is flushed away. Retraction movement of electrode is controlled numerically to get the required shapes, high accuracy and good surface finish. As there is no contact mechanical contact between the wok piece and the electrode. Hence the amount of force clamping force required to hold the work material is minimum. The amount of heat generated during the process is approximately 10,000 degree Celsius. Then the profile of tool is copied over the machining surface and also this process does not affect the heat treat below the surface. The Applications of the machining process is widely used in Aerospace technology, manufacturing of mould or die and to intricate the complex shapes. The feature EDM process has retained competitive and economic machining operation to satisfy the needs in quality product and minimum cost. The working principle of Electrical Discharge Machining (EDM) is shown in Figure 1.
The Material Removal Rate (MRR) and surface Roughness (Ra) are the most significant performance parameters measures in Electrical Discharge Machining (EDM). They mainly dependant on machining parameters like peak current, gap voltage, pulse on time, pulse off time, duty factor and electrode gap. Among these input parameters peak current, pulse on Time and gap voltage have been studied for experimental setup. Thus they are most important factors for the both maximum MRR and minimum Ra. The process parameters are usually controllable machining input factors that decides the conditions in which machining is accomplished. These machining conditions will influence the process performance result, which are measured using various performance methods. To obtain the maximum the Material Removal Rate (MRR) and surface Roughness (Ra), specifically machine tool builder delivers machining parameter table. EDM Process depends on the skill of operators. Practically, it attains very laborious to utilize the optimal work of a machine. To overcome this problem, a simple and steady method method based on statically programmed to investigate the effects unlike process parameter on MRR and Ra. However several optimizing techniques available, among Taguchi technique found to be very efficient, simple design of experimental and systematic path to conclude the machining parameters.
M A Razak and A M Abdul Rani[1] surveyed Nine EDM experiments with three levels and four parameters were conducted using
Taguchi method on AZ31 magnesium alloy to explore the optimum machining parameters. It was found that pulse on-time was the
most significant parameter affecting the surface roughness (Ra) of the machined surface. Vikas et al [2] presented the work which
deals with the comparison of the MRR for EN19 and EN41 material in a die sinking EDM machine various input factors like Pulse ON time, Pulse OFF time, discharge current and voltage were considered as the input processing parameters, while the MRR is
considered as the output BY USING Taguchi method. Naveen Beri et al [3] researched on a work that has been made to correlate the
usefulness of electrodes made through powder metallurgy (PM) and copper as electrode on electric discharge machining of AISI D2 steel in kerosene with copper tungsten (30% Cu and 70% W) tool electrode made through powder metallurgy (PM) technique and
Cu electrode. An L18 (21 37) Orthogonal array of Taguchi. Raghuraman et al [4] made an effort to investigate the optimal set of
process parameters such as current, pulse ON and OFF time in Electrical Discharge Machining (EDM) three performance characteristics such as rate of material removal, wear rate on tool, and surface roughness value on the work material for machining
Mild Steel IS 2026 using copper electrode using Taguchi method. Shahul Backer et al [5] in their research used OHNS EN-31 as the
material used for the machining purpose and parametric design responses such as Material Removal Rate and Tool Wear Rate. Parts of the experiment were conducted with the L9 orthogonal array based on the Taguchi method. In the present work, Optimization of
MRR and TWR on EDM conducted by using Taguchi and ANOVA. S.R.Nipanikar [6] researched on the cutting of D3 Steel material
using electro discharge machining (EDM) with a copper electrode by using Taguchi methodology has been reported. It is found that these parameters have a significant influence on machining characteristic such as material removal rate (MRR), electrode wear rate (EWR), radial overcut (ROC).
The aim of this research paper is to find the most effective levels of machining parameters for Electrical Discharge Machining (EDM) using Taguchi technique. Optimized process parameters were considered to maximize the Material Removal Rate (MRR) and minimize surface Roughness (Ra) based on the cost of operation, time consumption and number of trials.
II. MODELMETHODOLOGY
A. Specification of machine
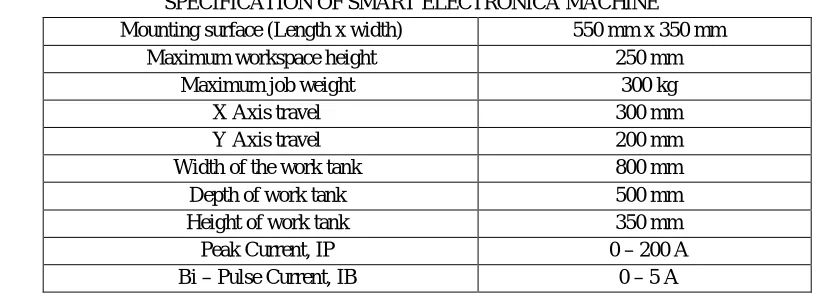
The experiments were carried out to measure the MRR and Ra on EDM machine (ELECTRONICA) and surface roughness tester respectively. The following are specification of EDM machine tool shown in Table I:
[image:3.612.102.511.591.743.2]
TABLE I
SPECIFICATION OF SMART ELECTRONICA MACHINE
Mounting surface (Length x width) 550 mm x 350 mm
Maximum workspace height 250 mm
Maximum job weight 300 kg
X Axis travel 300 mm
Y Axis travel 200 mm
Width of the work tank 800 mm
Depth of work tank 500 mm
Height of work tank 350 mm
Peak Current, IP 0 – 200 A
Following specifications for MITUTOYO Surface Roughness Tester are Measurement range : 400µm
Stylus tip material : Diamond Maximum drive range : 19mm Measuring force : 4m/N
[image:4.612.173.441.323.410.2]In present work Mild steel is used as work material, since machining of Mild Steel cannot be machined easily by traditional machining process. The hardness of Mild Steel is high and widely used in manufacturing areas. Chemical composition of mild as shown in Table II.
TABLE II
CHEMICAL COMPOSITION OF MILD STEEL
Sl. No. Composition Percentage (%)
1 Carbon (C) 0.450
2 Manganese (Mn) 0.499
3 Silicon (Si) 0.169
4 Chromium (Cr) 0.034
5 Nickel (Ni) 0.039
B. Overview of Taguchi technique
Genichi Taguchi, a Japanese scientist, developed a technique. This technique involves reducing the various in process through robust design of experiments. Taguchi’s Signal-to-Noise ratios which are logarithmic functions of desired output. It helps to learn the whole parameter space with a small number (minimum experimental runs ) of experiments. S/N ratios are used to understand the effects of control factors and noise factors and to find the best quality characteristics for particular applications. Optimization of multiple performance characteristics is not straightforward and much more complicated than that of single-performance characteristics. This grey-based Taguchi technique has been widely used indifferent fields of engineering to solve multi-response optimization problems. The control factors are used to select the best conditions for stability in design of manufacturing process, whereas the noise factors denote all factors that cause variation.
The experimental observations are further transformed into a signal-to-noise (S/N) ratio. There are several S/N ratios available depending on the type of characteristics. The characteristic that higher value represents better machining performance, such as MRR, is called ‘higher is better, HB’. Inversely, the characteristic that lower value represents better machining performance, such as surface roughness, is called ‘lower is better, LB. Therefore, “HB” for the MRR ’and “LB’’ for the Ra. Method used as L9 orthogonal arrays and analysed at different levels and verified. Required data collected to find which parameters are affecting the result with few experiments. Hence time and resources saved. Taguchi method involved following steps:
Evaluate the process objectives and parameters impacting the procedure. Create the orthogonal array for design.
Conduct the experiments for input parameters.
Make out the data analysis to examine the effect of various parameters on operation criteria. Anticipate the optimum parameters and evaluate the confirmation experiment.
The loss function (L) for objective of HB and LB is defined as follows:
LHB= ………(1)
Pulse ON Time, TON 0.25 to 4000 μ sec
Gap Voltage, Vg 40 to 150 V
Sensitivity (Quill Speed), SEN 1 to 10
Anti-arc Sensitivity, ASEN 1 to 10
Work Time, TW 0 to 30 sec
LLB= ………..(2)
Where ‘n’ indicates the number of experiment response for Material Removal Rate and Surface Roughness
respectively .The S/N ratio can be calculated as a logarithmic transformation of the loss function as shown below.
S/N ratio for MRR = -10 log10 (LHB)………..(3)
S/N ratio for Ra = -10 log10 (LLB)………..(4)
III. EXPERIMENTATIONPLAN
A. Selection of process parameters and their Levels
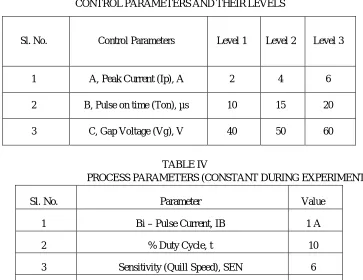
To achieve validity and accuracy of each test is repeated three times. The process parameters such as pulse current (Ip), pulse on time (Ton) and Gap voltage (Vg) are varied during experimentation. Among these parameters maintained constant which plays viral role on performing as shown in table. Table shows parameters selected and their level shown.
TABLE III
CONTROL PARAMETERS AND THEIR LEVELS
TABLE IV
PROCESS PARAMETERS (CONSTANT DURING EXPERIMENT)
Sl. No. Parameter Value
1 Bi – Pulse Current, IB 1 A
2 % Duty Cycle, t 10
3 Sensitivity (Quill Speed), SEN 6
4 Anti-arc Sensitivity, ASEN 3
5 Work Time, TW 1.5 s
6 Retraction Distance, Rd 2mm
B. Design of experiments and data analysis
Based on L9 orthogonal array experiments shown in Table V .This array chosen and having 9 rows and 3 columns. Corresponding to the number of experiments and process parameters. The range are found by rail and error method.
MRR = ………(5)
The experimental measured values of MRR and Ra their S/N ratios calculated using equations (3) and (4) respectively shown in Table .
Sl. No. Control Parameters Level 1 Level 2 Level 3
1 A, Peak Current (Ip), A 2 4 6
2 B, Pulse on time (Ton), µs 10 15 20
[image:5.612.127.490.272.552.2]TABLE V
EXPERIMENT DESIGN USINGL9 ORTHOGONAL ARRAY
IP TON Vg MRR Ra
S/N for S/N for
Sl. No. MRR Ra
(A) (µs) (V) (mm3/min) (µm)
(dB) (dB)
1 2 10 40 0.4030 2.148 -7.8939 -6.64069
2 2 15 50 2.6154 2.275 8.3508 -7.13963
3 2 20 60 0.4670 1.707 -6.6137 -4.64467
4 4 10 50 1.4600 2.312 3.2871 -7.27976
5 4 15 60 1.7500 2.295 4.5608 -7.21565
6 4 20 40 1.7100 2.977 4.6599 -9.47558
7 6 10 60 1.8137 2.386 5.1713 -755341
8 6 15 40 4.7123 2.524 13.4647 -8.04179
9 6 20 50 3.7360 3.010 11.4481 -9.57133
C. Analysis of Variation (ANOVA)
An exploratory tool to explain observation made by Analysis of Variation (ANOVA). A test of result used to determine the most affecting factors of the experiments. As the procedure of ANOVA is very complicated and employs a considerable of statistical formula. The value of F is called Fisher’s ratio. The principle of f test is larger for a particular parameters. Ultimately the value if f-test shows the effect on performance due to various parameters.
Statistical calculation has carried out by using MIMITAB16 software as shown in table (VI) and table(VII) TABLE VI
ANOVA TABLE FOR MRR Machining
DOF SS
A
MSSA F-value
Contribution
parameter (%)
Ip 2 8.5019 4.25096 87.38 52.897
Ton 2 4.9097 2.45484 50.36 30.544
Vg 2 2.5640 1.28199 26.35 15.952
Error (MSSE) 2 0.0973 0.04865 - 0.605
TABLE VII ANOVA TABLE FOR Ra
Machining
DOF SSA MSSA F-value
Parameter
contribution
Ip 2 0.6035 0.30173 2.63 46.46
Ton 2 0.1267 0.06337 0.55 9.7566
Vg 2 0.3394 0.16969 1.48 26.13
Error (MSSE) 2 0.2290 0.11452 - 17.64
Total (SST) 8 1.2986 - - 100 %
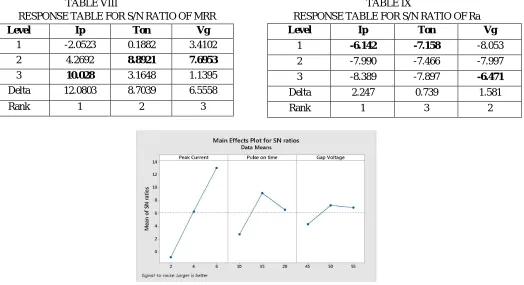
IV. RESULT AND DISCUSSION A. Analysis optimum parameters
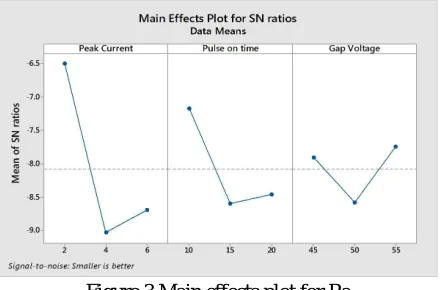
Figure II and Figure III show graphically the effect of three process parameters on MRR and Ra respectively. Analysis made based on main effect plots. Using MINITAB 16 response tables for S/N ratio of MRR and Ra calculated respectively. Based on the analysis of S/N ratio, the optimum machining parameter for MRR is obtained at Ip= 6 A, Ton= 15µs and Vg= 50 V and Ra Ip= 2 A, Ton= 10µs and Vg= 60 V is obtained the factor levels corresponding to the highest S/N ratio were chosen to optimize the condition for each parameter highest mean value from particular level is considered as shown in Tables VIII and IX.
TABLE VIII TABLE IX
RESPONSE TABLE FOR S/N RATIO OF MRR RESPONSE TABLE FOR S/N RATIO OF Ra
Level Ip Ton Vg
1 -6.142 -7.158 -8.053
2 -7.990 -7.466 -7.997
3 -8.389 -7.897 -6.471
Delta 2.247 0.739 1.581
Rank 1 3 2
Figure 2 Main effects plot for MRR
Level Ip Ton Vg
1 -2.0523 0.1882 3.4102
2 4.2692 8.8921 7.6953
3 10.028 3.1648 1.1395
Delta 12.0803 8.7039 6.5558
[image:7.612.47.571.434.719.2]Figure 3 Main effects plot for Ra
B. Confirmation experiment obtained for this result
The most desirable combination acquired from analysis results are validated by conducting the experiments for those combinations and analogized with the values predicted by using separate equations for MRR and Ra respectively. Optimum process parameters were obtained for both the experimental and predicted values in desired fashion as maximum MRR and minimum Ra as discussed and proven by equation.
……….(6)
Where = total mean of S/N ratio , = mean of S/N ratio at optimum level of each parameter P= number of main machining
parameters
Confirmation Experiment for MRR and Ra
Table X shows the comparison of the experimental results for the optimal conditions (Ip 3,Ton 2, Vg 2) with predicted results for optimal (Ip 3, Ton 2, Vg 2) EDM parameters for MRR. The comparison shows good agreement between the predicted and the experimental values.
Table XI shows the comparison of the experimental results for the optimal conditions (Ip 1, Ton 1, Vg 3) with predicted results for optimal (Ip 1, Ton 1, Vg 3) EDM parameters for Ra. The comparison shows good agreement between the predicted and the experimental values.
TABLE X TABLE XI
RESULTS OF CONFIRMATION EXPERIMENT FOR MRR RESULTS OF CONFIRMATION EXPERIMENT FOR RA
V. CONCLUSION
In this study an attempt was made to maximize the Material Removal Rate and minimize the Surface Roughness in EDM by Taguchi technique
Feasibility of this EDM process for Mild Steel by using copper as electrode proven the optimal result for higher MRR and lower the Ra is predicted and compared with experimental result were checked and a good agreement was found.
From the graphs, it is found that MRR increase with increase in Peak Current.
Peak Current is found to be the most significant factor for both MRR and SR in EDM of mild Steel. Optimized parameter for MRR is obtained at IP = 6 A, TON = 15 µs and Vg = 50 V.
Optimized parameter for Ra is obtained at IP = 2 A, TON = 10 µs and Vg = 60 V.
Optimal Machining Parameter
Prediction Experimental
Level A3B2C2 A3B2C2
S/N Ratio for MRR 5.9983 dB 6.286 dB
MRR 3.9796 mm3/min 4.101 mm3/min
Error % 2.96%
Optimal Machining Parameter
Prediction Experimental
Level A1B1C3 A1B1C3
S/N Ratio for Ra -4.9491 dB -4.257 dB
Ra 1.76 µm 1.697 µm
Based on the minimum number of trials conducted to arrive at the optimum cutting parameters, Taguchi’s Method seems to be an efficient methodology to find the optimum machining parameters.
REFERENCES
[1] M A Razak and A M Abdul Rani “Electrical Discharge Machining on Biodegradable AZ31 Magnesium Alloy Using Taguchi Method” Procedia Engineering
Volume 145, 2016 , Pages 916-922.
[2] Vikas, Shashikant, A K Roy and Kaushik Kumar, “Effect and Optimization of Machine Process Parameters on MRR for EN19 & EN41 materials using
Taguchi”,Procedia Technology 14 (2014) 204 – 210, 2014.
[3] Naveen Beri, S. Maheshwari, C. Sharma, Anil Kumar, “Performance Evaluation of Powder Metallurgy Electrode in Electrical Discharge Machining of AISI D2
Steel Using Taguchi Method”,material and manufacturing processes Vol:25, No:2, 2010.
[4] Raghuraman S, Thiruppathi K, Panneerselvam T, Santosh S, Optimization of EDM Parameters Using Taguchi Method and Grey Relational Analysis for Mild
Steel IS 2026, International journal of innovative research in science, engineering and technology ISSN: 2319-8753, Vol. 2, Issue 7, July 2013.
[5] Shahul Backer, Cijo Mathew and Sunny K. George, “Optimization of MRR and TWR on EDM by Using Taguchi’s Method and ANOVA”,." International
Journal of Innovative Research in Advanced Engineering (IJIRAE) ISSNISSN: 2349-2163, Volume 1 Issue 8 (September 2014)
[6] Prof. S R Nipanikar, “Parameter Optimization of Electro Discharge Machining of AISI D3 Steel Material by Using Taguchi Method”, Journal of Engineering