5
XI
November 2017
Design and Development of Pico Hydro Power Test
Rig
Leonel L. Pabilona1, Eliseo P. Villanueva2, Reuel C. Pallugna3, Antonio-Abdu Sami M. Magomnang4, Ma. Leona Maye B. Pepito5
1,4, 5
Mechanical Engineering Department, University of Science and Technology of Southern Philippines, CM Recto Avenue, Lapasan, Cagayan de Oro City, 9000, Philippines
2
Mechanical Engineering Department, Mindanao State University – Iligan Institute of Technology, Tibanga, Iligan City, 9200 Philippines
3
Electrical Engineering Department, University of Science and Technology of Southern Philippines, CM Recto Avenue, Lapasan, Cagayan de Oro City, 9000, Philippines
Abstract: The Philippines has vast sources for large and small-scale hydropower generation. Most of the large sources had already been developed while there is minimal development in the smaller ones. Since the hydro power generation is highly site dependent, there is an urgent need for our country to do its own research in optimizing the harnessing of energy in the smaller scale; mini, micro, and Pico scales. This study is about the design, fabrication and evaluation of a Pico hydro power test rig. The rig is to be used in testing different designs of small scale hydro power components, especially hydro turbines, both impulse and reaction. The capability of the rig for doing the test was studied by varying the water volumetric flow and pressure head. Through simulation and experimentation, the test rig components were evaluated. The evaluation showed that under high flow conditions, the hydraulic power of the system increased as the pressure head increased. Also, under high pressure conditions, the hydraulic power was observed to increase as the flow increased. The turbine test rig has a maximum capacity of 11kW as shown in this study. On the other hand, the Pelton turbine with 8 buckets was tested in the rig, produced a maximum brake power of 377.273 Watts at 1/2 valves open and a total head of 3 meters. This test rig is expected to contribute to design, modification and performance analysis of turbines and other hydro power component development throughout the country.
Keywords: hydraulic turbine, Pico hydro power, test laboratory
I. INTRODUCTION
Energy plays an important issue in the present scenario of the world and there is always a need in the renewable energy for sustainable growth. The rapid expansion of industrial sectors leads to the increase of energy consumption. But, the existing supplying systems are limited by fossil fuel stock. A majority of industries is utilizing furnace for their process heat applications, which is powered mostly by electric power or fossil power [1].
Hydro power is a renewable, non - polluting and environmentally benign source of energy. Hydro power stations have the inherent ability for instantaneous starting, stopping, load variations, etc., and of great help in improving the reliability of the power system [2]. There have been growing interest in research and development of hydropower systems, especially in Asian countries [3]. This could have largely been the result of the need to diversify from fossil fuels such as coal, the necessity of off-grid options for better access to rural communities, and the natural obstacle which the topography imposes against large scale developments.
TABLEI
CLASSIFICATION OF HYDRO POWER
Types of Hydro Power Plants Power Range Output
Large Hydro More than 100MW
Medium Hydro 15-100MW
Small Hydro 1-15MW
Mini Hydro 100kW-1MW
Micro Hydro 5kW-100kW
Pico Hydro From a few hundred watts to
The purpose of this study is to develop and evaluate the performance of a Pico-Hydro power test rig that will be used to improve the manufacturing quality and to achieve better performances of hydro power components. Also, part of this study is to develop and evaluate a spiral casing and nozzle that will be used for impulse turbines. Furthermore, an existing Pelton turbine design will be evaluated using this system.
The scope of the study is to design, fabricate and evaluate the Pico hydro power test rig and is limited to the parameters considered in the material selection of the designing process. The researcher used a centrifugal pump that delivers a maximum discharge of 80 m3/hr and a rated power of 6HP.
II. THEORETICALCONSIDERATIONS
A. The first Law of Thermodynamics
The first law of thermodynamics which governs all energy conversion systems, states that the change in the amount of internal energy contained within a system is equal to the amount of energy added by heating, minus the amount of energy lost from the system by work done upon the environment.
out in
E
E
E
Where;E is the total change in the internal energy of the system, Ein is the energy added to the system,
Eout is the overall amount of energy lost.
B. Bernoulli’s Equation
The primary and most basic principle in fluid mechanics is that a liquid will only flow between two locations if there is an existing pressure difference between these two points. Bernoulli’s Equation which is derived from Newton’s Second Law, can be used when studying fluid dynamics, and it is valid for both compressible and incompressible liquid flows.
2 2 2 2 1 2 1 1
2
1
2
1
gh
P
gh
P
Where;
P is the fluid’s pressure at the point of interest,
v is the fluid’s velocity at a point in the streamline,
is the density of the tested fluid,g is the acceleration due to gravity,
h is the location of a point within the streamline.
C. Head Loss in pipe flow
Head losses in pipes may be classified into two, major head loss and the minor head loss. The major head loss which is caused by pipe friction along straight sections of pipe of uniform diameter and uniform roughness while the minor head loss which are caused by changes in velocity or directions of flow and directions of flow and are commonly expressed in terms of kinetic energy.
1) Major Head Loss, hf:
Darcy -Weisbach Formula (pipe friction equation)
g
v
D
fL
h
f2
2
Where:f is the friction factor (determined using Moody’s Diagram),
L is the length of pipe,
g is the acceleration due to gravity,
D is the pipe diameter,
2) Minor Head Loss, hL Sudden Enlargement
g
v
v
h
L2
)
(
1
2 2
Sudden Contractiong
v
K
h
L2
2 2 0
D. Head Loss in pipe flow
Head Water flow rate (in cubic meter per second) is the amount of water moving through a pipe in a period of time. As the water flow rate increases, the turbine spins faster and more electricity is generated.
AV
Q
E. Available Powernet
gQH
P
Where
P is the available power,
is the density of the tested fluid,g is the acceleration due to gravity,
Q is the fluid flow rate,
Hnet is the total head.
III.EXPERIMENTALMETHODS
A. Design and Simulation of the System
As a baseline of the design process, rough estimates were made based on the specifications of the readily available components and the components that could be acquired within a short period of time. The data collected included parameters such as pressure, volumetric flow rate and power output. These parameters were assimilated into the conceptual design and used as input into fluid flow simulation software for a preliminary analysis.
TABLEIII
MATERIALS AND SPECIFICATIONS
No .
Qty Unit Item Dimensions
1 2 Lengt
h
G.I. Pipe 8 inch dia., sched 40
2 2 Lengt
h
G.I. Pipe 4 inch dia., sched 40
3 5 Pairs G.I. Flanges 4 inch dia. pipe
4 4 Piece G.I. Elbow 4 inch dia., sched 40
5 1 Piece G.I. Tee 4 inch dia., sched 40
6 1 Piece Cast iron Gate
valve
4 inch dia., Flanged
7 1 Piece Centrifugal pump H=18m, Q=80 L/hr
8 1 Piece Induction motor 25 kW, 3 phase, 230 volts, 60
hertz
The variation of the flow of the water running through the pipe was regulated by valves and a map of different flows and heads to determine the optimal conditions under which a turbine will work was created. An 8in diameter Galvanized Iron piping for the Water Column Tank (WCT) was used while the 4in diameter G.I. was for the piping system. Both can sustain the vibration and structural stresses created during operation of the system.
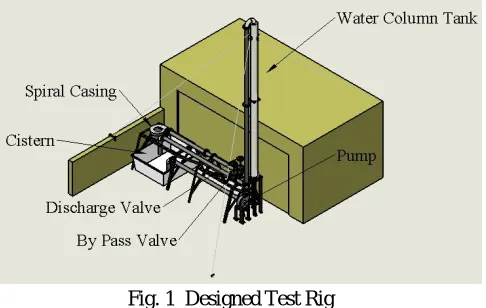
[image:5.612.182.436.551.707.2]Fig. 1 Designed Test Rig
Figure 1 shows a schematic diagram of the proposed test rig. Water would be pumped from the cistern by a centrifugal pump into the water column tank. The discharge valve and by pass valve are used to control both the water level and the flow rate into the water column tank (WCT). This would replicate the condition of an actual hydro site. The water level or head can be varied from
less than 1 meter to almost 6 meters. The flow rate can be varied from 0 to 0.222 m3/s which is the pump capacity. In this way a
wide range of flows and heads can be accommodated. It is possible to be operated between low head high flow and low flow high head situations. This means that axial, mixed and impulse turbines can be tested.
In order to better define the scope of the project, a number of parameters were taken into action. One of these parameters was to define a range of turbines based on power output that could actually be tested in this test rig under design considerations. Another important parameter to be taken into account was to maximize the use of equipment and facilities currently available, in order to be incorporated into the final prototype. Additional factors that can contribute to uncertainty were taken into consideration by referencing a study in the Mechanical Considerations and Design Skills by Robert L. Alvis, 2008 [8].
The researcher divided the parts for thorough simulation method. Simulation methods are presented mostly as a reinforcement of the theoretical analyses and decisions taken under the earlier stages of the project were experimental data and were not readily available for component selection.
This part concerns the acceleration of a fluid particle, its velocity and its position, in other words the study of a fluid’s flow. This can be analyzed through the use of Eulerian and Lagrangian Methods in conjunction with Solidworks simulation. However due to the complexity of turbulent fluid flows under non-fully developed conditions, a complete kinematic analysis of the water flow through fittings, valves and other system components goes beyond the scope of the project as required resources are not available for an adequate study.
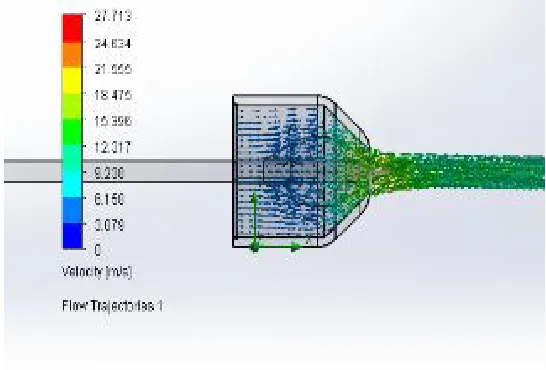
The next part concerned in the study is the spiral casing which will be used for the impulse turbines. The spiral casing is designed to produce 4 water jets having equal flow rates and velocities. It’s concentric design with reducing thickness, from 4 inch at point 1 and 1 inch at point 4 allowed the researchers to arrive to a theoretical calculation that volume flow rate are equal in all four points.
Fig.3 Flow Simulation of Spiral Casing
The researchers conducted a flow simulation and the results are shown in Fig. 3 where the velocity on each point of the casing is almost identical with an average value of 2.4 m/s. The difference may have been caused by the imperfect geometric modeling. On the other hand, it is shown in Fig. 1.5 that the number of buckets wherein the Pelton turbine can be optimized is 8 Pelton buckets where the 90o angle trajectory was achieved.
[image:6.612.139.497.349.452.2](a) (b) (c)
Fig. 4 Spiral Casing with (a) 6 buckets, (b) 8 buckets, (c) 10 buckets
The material selected for the nozzle is Carbon Steel Alloy with a thickness of 3mm. In order to gradually increase the water jet velocity, it is designed to converge from 1.5 in diameter to 0.5 in. The casing consists of 4 equidistant nozzles. The nozzle design may proceed to the fabrication stage since the data accumulated were verified to fit for the application. It has a relatively high safety factor which is 13 and a displacement of 0.000939198 mm.
[image:6.612.174.447.528.713.2]Fig. 6 Pressure vs Length simulation result
A flow simulation was conducted to predict the behavior of the water jet passing through the nozzle with spear valve. The simulation showed that the vena contracta is located in 0.003145737 m from the mouth of the nozzle and has the maximum velocity of 17.4 m/s. It was noticed that the nozzle increases the velocity of the water at the expense of its pressure as shown in the Pressure vs. Length graph above.
B. Fabrication and Evaluation of the System
After verifying that the simulation provided feasible results, the design proceeded to the prototyping stage. The theoretical design of the system allowed the building of a prototype that was within the conditions and constraints the project was subjected to. The final prototype took a lot of work and time, mainly due to the not readily available tools and equipment’s required to build the prototype. It was more time consuming to overcome the construction and experimental problems rather than the theoretical problems.
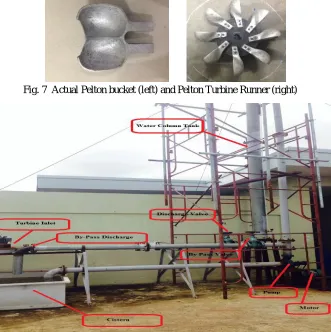
Fig. 7 Actual Pelton bucket (left) and Pelton Turbine Runner (right)
[image:7.612.146.477.390.722.2]The turbine works with a high pressure of water that will discharge through the nozzles. This high-pressure water flows through the nozzles striking the blades of the turbine and creating an angular rotation of the turbine rotors. During the actual experiment, the pressures, torque and rotational speed were gathered using appropriate measuring devices.
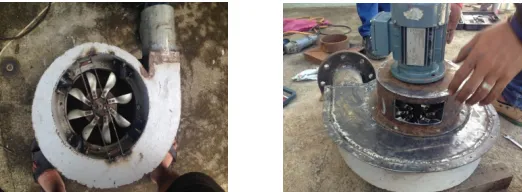
Fig. 9 Alignment of Turbine to Nozzle (left) and Alignment of Generator
IV.RESULTSANDDISCUSSIONS
A. Evaluation of the Test Rig
The test rig is designed to accommodate both impulse and reaction turbines. The experiments were conducted and data were gathered at different conditions. These conditions include varying the volumetric flow rate of the water and the head at which the water is discharged. In varying the flow rate, it is related to the number of turns of the valve as shown in the Table III.
TABLEIIIII
VALVE CONDITIONS
Valve Condition No. of Full Turns
Full Open 28 turns
Three-Fourth Open 21 turns
Half Open 14 turns
[image:8.612.182.443.116.212.2]One-Fourth Open 7 turns
Fig. 10 Flow rate vs Head
Fig. 11 Flow Rate vs Hydraulic Power under Varying Head Conditions
Figure 11 shows that as the head increases the hydraulic power also increases, this result validates the study of Zainuddin et al,.2009 [4]. In this manner, different map of head and flow rate combination can be made and become a basis for future turbine designs and researches.
The following graph shows the comparison between the Theoretical, Simulated and Experimental results at 1/2 valve opening. The researchers used 1/2 valve opening as a baseline of comparison in order to validate the results.
0 1 2 3 4 5 6 7
0 0.02 0.04 0.06 0.08 0.1 0.12
Head,m
Fl
o
w
R
at
e,
m
^3
/s
[image:9.612.154.471.313.479.2]Flow Rate Simuation Flow Rate Theoretical Flow Rate Experimental
Fig. 12 Flow Rate vs Head at ½ valve opening
[image:9.612.149.476.531.705.2]The Figure 12 shows that at a head of 5 meters, the flow rate at the different methods obtained a similar result. And that point became an intersection point. Also, it can be drawn that the values between the theoretical and simulated flow rate are closely related.
B. Evaluation of the Test Rig
[image:10.612.155.470.133.274.2]The Based on the number of turns of the valve, the study obtained different flow rates used in running the Pelton turbine. Also, the head was varied to obtain the maximum power and efficiency of the Pelton Turbine. The following table shows the summary of obtained results.
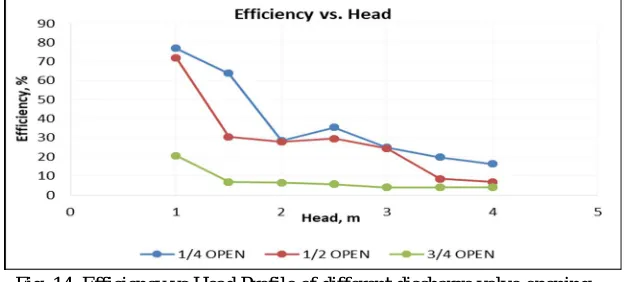
[image:10.612.160.465.331.494.2]Fig. 14 Efficiency vs Head Profile of different discharge valve opening
Figure 14 shows the efficiency of the Pelton turbine with varying head and different valve conditions. The efficiency of the turbine is defined as the ratio between the power developed by the turbine to the available water power. It is observed that the maximum efficiency reached was 77% at a 1-meter head and 1/4 valve opening.
Fig. 15 Brake Power vs Head with different discharge valve opening
The maximum brake power produced was 377.273 Watts with a flow rate of 0.053678 m3/s and a total head of 3 meters with an
efficiency of 24.278%. In evaluating the efficiency of the turbine in converting energy, the losses due to the system have to be determined and then considered when obtaining the efficiency of the turbine.
V. CONCLUSIONS
The test rig was built successfully using the available materials and the readily available materials. The study, through theoretical computation, simulation and actual experimentation were able to evaluate and analyze the design for a Pico hydro test rig. With the obtained analyses, they arrived to the corresponding conclusion. Under high flow conditions, the hydraulic power of the system increases as the pressure head increases. Also, under high pressure conditions, the hydraulic power is observed to increase as the flow increases. At the head of 6m with full discharge valve opening (28 turns), the maximum hydraulic power of 11kW was obtained.
For the Pelton turbine, which was tested on the rig, reached the maximum efficiency of 77% at a height of one meter and the power
produced was 30 watts. On the other hand, the maximum power produced is 377.273 Watts with a flow rate of 0.053678 m3/s and a
total head of 3 meters with an efficiency of 24.278%.
VI.ACKNOWLEDGMENT
The authors would like to thank the College of Engineering and Architecture of University of Science and Technology of Southern Philippines (USTSP) for their technical support to this project. Further, the author would like to acknowledge the technical support of Mr. Gary A. Ebare, Mr. Klemen C. Gemina, and Mr. Marlo M. Marapao for making this research successful.
REFERENCES
[1] Edeoja, Alex Okibe, Sunday Jacob Ibrahim, and Emmanuel Iornumbe Kucha, “Conceptual Design of a Simplified Decentralized Pico Hydropower with Provision for Recycling Water”, Journal of Multidisciplinary Engineering Science and Technology (JMEST),2015.
[2] Haestad Methods, Thomas M. Walski, Donald V. Chase, Dragan A. Savic, Walter Grayman, Stephen Beckwith, Edmundo Koelle, “Advanced Water Distribution Modeling and Management” 1st edition, Haestad Methods, Inc., Connecticut, 2003.
[3] Bhola Thapa and Ole Gunnar Dahlhaug, “Turbine Testing Laboratory and its Role in Hydropower Development”, 2009. [4] American Society of Mechanical Engineers standards, ASME B.16.5-19
[5] H. Zainuddin, M. S. Yahaya, J. M. Lazi, M. F. M. Basar and Z. Ibrahim, “Design and Development of Pico-hydro Generation System for Energy Storage Using Consuming Water Distributed to Houses”, 2009.
[6] Ioannis A. Niadas & Panos G. Mentzelopoulos, “Probabilistic Flow Duration Curves for Small Hydro Plant Design and Performance Evaluation”, Water Resource Management (2008) 22:509–523.
[7] Mohd Akmal Bin Mat Ludin,”Design Of Pico-Hydro Turbine By Using A Pump As A Generator”, 2013. [8] Robert L. Alvis, “Mechanical Considerations and Design Skills”,Sandia Report, 2008.