5
XI
November 2017
Evaluating the Performance of Four Stroke Cu
Engine Using Bio-Diesel Blends as Fuel
Dr. T. Krishnaiah1, Dr. R. Ganapati2, Dr. V. Pandurangaduz3, Dr. R. Ramachandra4
1,2
Department of Mechanical, Anurag Engineering college, KODAD, Telengana , India,krishnaiah
3,4
Department of Mechanical, JNTUA, Anantapuramu, Andhra Pradesh, India
Abstract: In recent days, fuels are very limited and also depleting from day to day as utilization is very rapidly increasing. Because of these fossil fuels, the globe today is encountering with a serious environmental damage in the form of pollution. To reduce this it is now necessary to search an alternative fuel to Diesel which is prepared from renewable sources. The fuels produced in this way are termed as alternative fuels. In the current work, experimental research was carried out over naturally aspirated, water cooled and single cylinder 4-stroke and direct injection CI engine with Diesel and pungamiah biodiesel blends as fuel. From this Brake Thermal Efficiency (BTE), Brake specific fuel consumption (BSFC) and Exhaust Emissions were investigated. From the experimental results it is observed that obtained Brake Thermal Efficiency is better for bio-diesel blend B20 with minimum Brake Specific Fuel Consumption. It is also observed that there is a reduction in the quantity of Carbon Monoxide and Hydro Carbon and increased exhaust gas temperature when compared with Diesel as fuel.
Key words: C.I. Engine, waste vegetable bio diesel, Diesel
I. INTRODUCTION
The energy import is considered as one of the major threats to economic as well as social developments in developing countries like India. India is a major importer of crude oil as the availability of this oil in India is much lesser than its demand. Transportation and agricultural sectors are major consumers of fossil fuel and the biggest contributors to the environmental pollution. The dependency on the fossil fuels and environmental degradation can be reduced by replacing mineral based, bio-origin renewable fuels. Variety of bio fuels is potentially available, but the biodiesel and bio ethanol are being considered globally in recent years.
The price of crude petroleum rose rapidly to several times during the 1970’s and also emission control requirements have made the improvement of fuel consumption. Apart from the scarcity of petroleum fuels and higher costs, there is a growing menace of vehicular pollution. The availability of petroleum fuels is getting reduced year by year and it is also a non-renewable fuel. With the upsurge in economic activities, India is consuming over a whopping 206.15 million tones of crude oil a year. The yearly consumption of diesel alone is approximately 78.053 million tonnes in India of which about 45% are petro-products. In the current scenario, exploring energy alternatives in the form of biodiesel namely ethanol, Pongamia and Jatropha assumes top priority. At present more than 70% of our petroleum products are imported and this involves huge loss of foreign exchange.
A. Exhaust Emission From Ci Engine
Recent emission norms announced by the Government of India and increased hydrocarbon fuel cost urged to find out alternative sources of fuel. Development of internal combustion engines around Diesel and gasoline has been taking place ever since its inception. The major focus of development has been made to improve the fuel efficiency of I.C. Engines and reduce the pollution through reduction in smoke, unburned hydrocarbon, oxides of Nitrogen, carbon monoxide, particulate matter and green house gases at an affordable cost.
There have been continuous search for the most efficient prime movers right from the invention of I.C. engines, which will do less harm to the environment. The research and development are increasingly focused on the fuel economy and the exhaust emission of the four stroke C.I. energies. Increasing concern about the impact of the I.C. engine on the environment has led to the introduction of legislation to control pollution by engine exhaust emission.
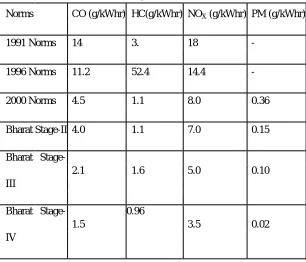
Table 1 Indian and European Vehicle Emission Norms
Norms CO (g/kWhr) HC(g/kWhr) NOX (g/kWhr) PM (g/kWhr)
1991 Norms 14 3. 18 -
1996 Norms 11.2 52.4 14.4 -
2000 Norms 4.5 1.1 8.0 0.36
Bharat Stage-II 4.0 1.1 7.0 0.15
Bharat Stage-
2.1 1.6 5.0 0.10 III
Bharat Stage- 1.5
0.96
3.5 0.02 IV
B. Possible Alternative Fuels
Much work is being concentrated on the use of alternative fuels to gasoline and Diesel. With the wide range of fuel consumption capability and inherent fuel efficiency of the Diesel engine is the natural choice for use of alternative fuels from non-renewable and renewable resources. Natural gas, methanol, ethanol, hydrogen and vegetable oils are considered as potential alternative fuels.
C. Bio-Diesel
Bio-diesel is biodegradable, which means it dissipates quickly after a spill. Bio-diesel has a high flash point and low volatility so it does not ignite as easily as conventional Diesel, which increases the margin of safety in fuel handling. Bio-diesel degrades four times faster than conventional Diesel and is not particularly soluble in water. It is non-toxic, which makes it safe to handle, transport and store.
Table 2 Non edible oil potential in India by National oilseeds and Vegetable Oil Development (NOVOD) Board, India
Sl.No. Oil Botanical Name
Oil
(tonnes)
1 Neem Azadirachta indica 100000
2 Karanja Pungamia pinnata 55 000
3 Kusum Schleichera oleosa 25 000
4 Ratanjyot Jatropha curcus 15 000
[image:3.612.43.572.540.736.2]6 Tumba Citrrullus collocynthis 21 000
7 Sal Shorea robusta 180 000
8 Mahua Madhuca indica 180 000
9 Mangp Mangifera indica 45 000
10 Phulware Cheura 3 000
11 Kokum Greminia indica 500
12 Simarouba Simaruba glauca --
13 Jojoba Smimmondsia chinesis --
14 Chulla Prunus armeniaca 110
15 Rice bran Oryza sativa 474000
D. Development (NOVOD) Board, India
The highest production potential for rice bran oil shows 4,74,000 tones followed by Sal and Mahua, which is 1, 80,000 tones. The third highest potential was Neem oil, which is 1, 00,000 tones. The rice bran oil may be used for cooking and the other oils may be used for medical purposes. The next highest non edible oil is Karanja (Pongamia), which is 55,000 tones production potential. Pongamia can grow on most soil types ranging from stony to sandy to clayey, including Verticals. It does not do well on dry sands. It is highly tolerant of salinity. It is highly tolerant of salinity. It is common along waterways or seashores, with its roots in fresh or salt water. Highest growth rates are observed in well drained soils with assured moisture. Natural reproduction is professed by seed and common by root suckers.
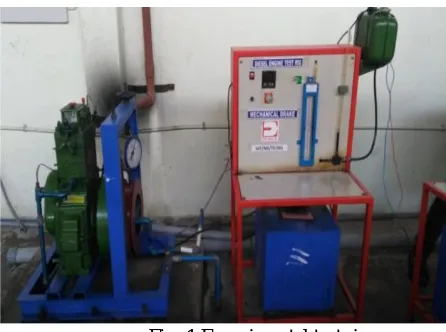
II. EXPERIMENTAL TEST SETUP
The experimental setup has been designed and fabricated in accordance with the scheme of experimentation planned to achieve the objectives formed under the research problems. The experimental techniques and testing instruments are carefully selected to minimize the errors.
Fig: 1 Experimental test rig
The experiments are conducted in a single cylinder, water cooled, naturally aspirated, Diesel engine commonly used for transport vehicles. A rope brake dynamometer is coupled to the engine with suitable propeller shaft for balancing. The volumetric fuel metering system for fuel flow rate and air box method for measuring flow rate of inlet air and exhaust gas are arranged. The exhaust gas is used to measure the exhaust emission like HC, Co, Co2, O2 emission.
A system which is used for the measurement of exhaust gases consists of group of analyzers for measuring carbon monoxide (CO), oxides of nitrogen (NOx), hydrocarbons (HC), smoke density (SD), particulate and soot. The concentration of CO (in ppm) present in the exhaust gases was measured by using ‘Signal’ Series-7200 non-dispersive infrared analyzer (NDIR) equipped with a ‘Signal’ Series-2505M Cooler. ‘Bosch’ RTT-100 opacimeter, is used to measure the smoke level in the exhaust gas the readings of which are provided as equivalent smoke density in (mg of soot/ m3 of exhaust gases). The concentration of nitrogen oxides in ppm (parts per million, by vol.)
Present in the exhaust gases was measured by using ‘Signal’ Series-4000 chemiluminescent analyzer (CLA) that was fitted with a thermostatically controlled heated line. The total unburned hydrocarbons concentration (in ppm) present in the exhaust gases was measured with a ‘Ratfish-Instruments’ Series RS55 flame-ionization detector (FID) that was also fitted with a thermostatically controlled heated line.
Table 3 Specifications of Test rig
A. Steps involved in the Investigation
In the investigation it is aimed to find the optimum blend based on the investigated parameters of engine.
Initially the experimentation was performed with Diesel as fuel in the selected engine for getting baseline data for comparison. Preparing bio-diesel blends by mixing Diesel and waste vegetable oil bio-diesel with appropriate blend proportions like B10, B20, and B30. By using above three waste vegetable oil blends as fuel in the engine, experimental investigation was performed to collect required data at different engine loads and selecting one bio-diesel blend out of three blends as best bio-diesel blend by comparing its performance with remaining blends and also with baseline data obtained, this completes investigation.
B. Experimental Procedure
1) Before starting of engine electrical and earthling connections should be verified properly. 2) Water tank should be filled with required amount of water.
3) Fuel tank should be filled with minimum 10lit of fuel and knob should be kept in correct position. 4) Set water supply for engine around 500 l ph which is economical rate of cooling water of this engine. 5) Start electric power supply for the accessories of the engine.
6) Start the engine by operating lever during hand cracking.
7) Keep the speed constant and run the engine at that speed for 6 minutes for stabilization. 8) Repeat the procedure for loads of 4,6,8,11,13.
9) Put off the engine by operating lever.
III. RESULTS AND DISCUSSIONS
Experiments were conducted varying loads test at rated speed to measure the brake power and fuel consumption as a function of load. With the bio-Diesel blends B10, B20 and B30. This stage of investigation Diesel and bio-diesel blends thermal efficiencies (B10, B20 and B30) are tested at constant speed at varying loads.
A. Brake Thermal Efficiency
The brake thermal efficiency of the engine increases with load for all the pongamia fuel blends up to 3/4th load. After 3/4th load the thermal efficiency starts decreasing. It can also be observed from the figure(2) that the thermal efficiency of the engine operated with 20% bio-diesel blend is lower than that of the Diesel fuel. The maximum brake thermal efficiency of the engine operated with base Diesel, B10, B20 and B30 with respect to brake power is given below.
The brake thermal efficiency of the engine depends on fuel blends, cetane number, heating value and specific gravity. The heating value of the fuel and its flow rate gives the energy input to the engine. An engine operating with bio-diesel blends consumes lower energy input for the same power output when compared with base Diesel fuel. When the percentage of bio-diesel in the blend increases the thermal efficiency also decreases. The higher viscosity leads to decreased atomization fuel vaporization and combustion. Hence the thermal efficiency of higher quantity of bio-diesel is lower than that of Diesel.
B. Brake Specific Fuel Consumption
The brake specific fuel consumption with load is shown in Figure 3. It is observed from the figure that the brake specific fuel consumption of the engine increases with the increase in the percentage of bio-diesel and decreasing with increase in load. This is mainly due to the combined effects of the fuel density, viscosity and lower heating value of blends. As the percentage of bio-diesel in the blend increases, its viscosity also increases causes improper atomization and mixing of fuel with air leads to decreased combustion efficiency thereby increasing fuel consumption.
Fig: 3.Variation of Brake Specific Fuel Consumption with brake power for Diesel and bio-diesel blends.
C. Unburned hydrocarbon
The unburned hydrocarbon (HC) in the exhaust with load is shown in Figure 4. It is observed from the figure that the HC emission is decreased with the waste vegetable oil bio-diesel in the blend.The maximum reduction is observed with B30 blend followed by B20 blends .This is due to the higher percentage of oxygen associated with bio-diesel in the blend.
Fig: 4 Variation of Unburned Hydro Carbon Emission with brake power forDiesel and biodiesel blend.
D. Carbon Monoxide Emission (CO)
E. Carbon Dioxide
[image:8.612.184.444.173.311.2]The carbon dioxide emission increases linearly with the load of the engine (Figure 5.5). This might be due to complete combustion at higher loads. The reduction in CO2 emission for all the blended fuels is observed. It is also noted from the figure that when the percentage of bio-diesel in the blend increases the CO2 emission is increased. However it is quite obvious that the CO2 emitted from the bio-diesel is entirely different with the CO2 emitted from the fossil fuel operation. The CO2 emitted by the former can be utilized for the respiration of plants. Also this CO2 is decomposed in the atmosphere within short period of time, but the CO2 emitted by the later is retained over several hundred years and can cause ozone layer depletion.
Fig: 5 Variation of Carbon Dioxide Emission with brake power for Diesel and bio-diesel blend
F. Exhaust Gas Temperature
Exhaust gas temperature (EGT) is varying with brake power and the results for different bio-fuel blends are presented in Figure 5.6. EGT of all the tested fuels increased with brake power. EGT of B20 is higher than that of diesel fuel at all load due to the blends’ higher viscosities, which resulted in poorer atomization, poorer evaporation, and extended combustion during the exhaust stroke. When the percentage of bio-fuel is increasing its viscosity increases which results in increased EGT of the blends.
Fig 6 Variation of Exhaust Gas Temperature with Brake Power for Diesel and Bio-diesel blends
IV. CONCLUSIONS
The following points may be noted from the results obtained from experiments conducted on the Diesel engine using Diesel-pongamia bio-diesel blends as fuel.
A. The brake thermal efficiency of the engine with blend B20 as fuel is nearer to the Diesel engine. B. Low smoke and unburned hydrocarbon emission for all the blends.
C. Brake specific fuel consumption of the engine with bio-diesel blend as fuel is lower when compared with diesel as fuel for the same engine.
D. The CO2 emission is also higher for all bio-diesel blend.
E. The Hydrocarbon emissions of all bio-diesel blends are less than Diesel fuel for the same engine.
[image:8.612.177.438.410.546.2]H. The blend B20 is showing better performance than other blends that are tested. I. BTE is almost very nearer to diesel but not higher.
J. The percentage decrease in BSFC is 2.20%. K. The percentage decrease in HC Emission 7%. L. The percentage decrease in CO Emission 8.6%. M. The percentage decrease in CO2 is 2.1%.
V. SCOPE FOR FUTURE WORK
The above research work provides ample scope for future work, which are listed below:
The research may be carried out on a single cylinder engine to enhance the performance of the engine. The same work can also be carried out on LHR engine.
REFERENCES
[1] Altınet R.; and Cetinkaya. S., Energy Conversion and Management -2001 42 529–538. [2] Ali Yusuf; Hanna Milford, A.; Borg Jseph, E., Bio resource Technology, 52, 1995 237–243.
[3] Ranganatha, B.; and Majunath, H., International Engineering and Robotics research, 2(3) July 2013 198-203.
[4] Siva Kumar, A.; Maheswar, D. and Vijayakumar Reddy, K., Jordan Journal of Mech. & Industrial Engg., 3(3) 2009 190 –197.
[5] Sudhakar babu, S.; Rama Chandra, R.; Nagamalleswara Rao, G. and Naga Prasad Naidu, V., National conference on advanced 212 trends in Mechanical Engineering research and development (2001) JNTUCEA 593-596.
[6] Shekar Kallem; Preetham P. Chatarjee; Zahoorulla S.Md., National conference on advancements and innovations in Engineering Technology and Management – 19th & 20th March-2014 ME-71.
[7] Ranganathan, L.; Lakshmi Narayana Rao, G.; and Sampath, S., European Journal of Scientific Research, 62(1) 2011 101-115. [8] Shruthi, H.; Heroor; and Rahul Bhaeadwaj, SD., International journal of environmental engineering and Management 4(5)2013 425-432 [9] Shahid. E. M.; and Jamal. Y.; International Journal of Engineering and Applied Science- 2011 9 68-75.
[10] Jindal, S.; Nandawana,; B.P., and Rathore ,N.S., New frontiers in Bio fuels (2009) 70-79.
[11] Pryor, RW.; Hanna, MA.;F Schinstock; BashfordLL Transactions of the ASAE 1983, 26, 333–337. Sahoo, P.K.; Das, L.M.; Babu, M.K.G.; Arora, P.; Singh, V.P.; Kumar, N.R.; and Varyani, T.S., Journal of Fuel 88 2009 1698-1707.
[12] Jameel Basha, S.M.; Naga Prasad Naidu, V., and Naga Malleswara Rao, G., National conference on advances in Mechanical Engineering, 30th January-2007, St. Joseph college of Engineering, Chennai, 45-48.
[13] Dilip Kumar,; and Kumar, P.R., International Journal of Modern Engineering Research (IJMER) 2(4), July-Aug 2012, 1741-1746. 213
[14] Ramu, S.; Lawrence, P.; Arunkumar, G.; Vivek, M.;, Santhanakrishnan, S.; and Karthikeyan, S., Indian Journal of l Innovations Dev, 1(6) 2012 431-434. [15] A.K. Pandey ,A.K., and Nandgaonkar, New frontiers in Bio fuels, 2009 188-195.
[16] Ragit, S.S.; Mohapatra, S.K.; and Kundu, K., Journal of Scientific & Industrial Research, 69 2010 62-66. [17] Manieniyan, V.; Senthilkumar, R.; and Sivaprakasam, S., New frontiers in Bio fuels 2009 205-216.
[18] Kamlesh, A. Sorate,; Sandeep, K. Bhor,; Padmakar, A.; and Mhendra, J., International Journal of Research and Technology (IJERT), 4(3), 2011 343-349. [19] Mahesh, R. Reddy,; Srinivas, V. Valmiki; and Navindgi, M.C., International Journal of Engineering Research and Technology, 5(3) 2012 363-374. [20] [21] Mofijur, M.; Masjuki,H.H.; Kalan, M.A.; and Atabani, E.A., Malaysian perpero Energy 2013 021059.
[21] Hadiya, J.P.; International Journal of Engineering Science and Research Technology, 2 (12) 2013 3444-3447.
[22] Shruthi, H.; Heroes; and Rahul Bhaeadwaj, S.D., International journal of environmental engineering and Management, (2013) 4(5) 425-432.
[23] Narasimhan, T.L., Journal of the Indian Inst. of Science, 06 XXXVIII (4) 254-259. [25] Sharanappa, G.; and Rana Prathap Reddy, New Frontiers in Bio fuels, 2009 246-255. [26] Pramanik, K., Renewable Energy, 28, 2003 239–248.
[24] Buyukkaya Ekrem,; Journal of Fuel, 89, 2010 3099-3105.
[25] Wittison, K.; Sing, I.P.,; Sharma, M.L.; Kalyan sing; and Singal, S.K., New frontiers in Bio fuels (2009) 289-294.
[26] Sukumar Puhan,; Vedaraman, N.; Rambrahamam, B. V.; and Nagarajan, G., Journal of Scientific & Industrial Research, 64, 2005 890-896.
[27] Leenus Jesu Martin, M.; Edwin Geo, V.; Prithviraj, D., 215 International Journal of Energy and Environment, 2(2) 2011, 321-330. [31] Ilker sugozu,; Cengiz oner,; and Sehmus altun, International Journal of Eng. Research & Development, 2(1) 2010 50-53.
[28] Bhojraj, N.Kale, and Prayagi, S.V., International Journal of Emerging Technology and Advanced Eng., 2(8) 2012 117-120.
[29] Sreenatha Reddy, S.; Murthy, K.L.N.; Harinathareddy, M., and Nageswara Reddy, P., “International Journal of Mechanical and Industrial Engineering, 3(1) 2013 62-66.