Modeling and Simulation of Air Conditioned Room
Using CFX
Praveen Goggal1, Mr. Manjunath G2, Mr. Khalid Sultan3
,
Mr. Md. Zubair. Kawalagi41Assistant Professor, Mech. Dept., BLDCET(karnataka), India
2Student, Mech. Dept., BLDCET(karnataka), India
3Student, Mech. Dept., BLDCET(karnataka), India
4Student, Mech. Dept., BLDCET(karnataka), India
Abstract: Air-conditioning systems is used in many parts of the world. The purpose of most systems is to provide thermal comfort and an acceptable indoor air quality (IAQ) for occupants. With the improvement of standard of living, occupants require more and more comfortable and healthful indoor environment. People spend 80 to 90% of their time in indoors, and indoor environment has important effects on human health and work efficiency. A comfortable and healthy indoor air environment is favorable to occupants. In recent years, indoor thermal comfort has been improved greatly due to the development of air-conditioning systems. However, health problems related to poor IAQ appear more frequently, and it is the indoor pollutants that lead to poor IAQ. Control of relative humidity is an essential aspect of maintaining indoor air quality in an air-conditioned space. The work carried out in this paper is to study the comfort zone of air characteristic and investigate the characteristic of the air flow in room by varying the inlet air temperature, velocity and the vent position..
Keywords: Air velocity, radiation temperature, velocity variation, turbulency and cfd.
I. INTRODUCTION
The numerical prediction of air flow patterns has been a research object for several decades. By 1980, it was possible to predict the flow field in large domains with relatively small openings using Computational Fluid Dynamics (CFD). In recent years, CFD has gained in popularity as a design and analytical tool, because CFD offers an engineer with the ability to visualize the air movement inside the room. It enables one to predict velocity and temperature values and distribution in a space. It allows an engineer to change parameters, such as flow rates, inlet temperature, heat loading, occupancy, etc and thus helps to predict the impact of these design changes on indoor climate and energy management in real buildings. The air flow rate was affect the air flow pattern and humidity inside a room to achieve thermal comfort. Data on the effect of air motion and temperature to the humidity of the air in the chamber was go for determine the system thermal comfort.
II. PROBLEM FORMATION
The present work is concerned with the simulation of a computer lab by varying inlet temperature and velocity. By simulating comfort conditions are observed.
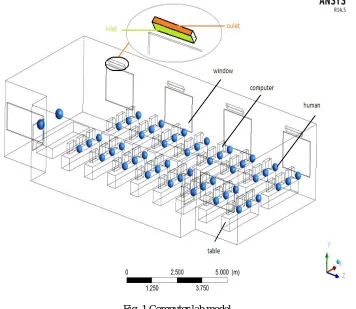
A. Computer lab specification
The lab has 4 air conditioners (4 inlet and outlet vents), 50 human loads, 8 glass windows out of which 4 outer windows are exposed to sun rays and 4 inner windows are not exposed. There are 48 computers and 17 tables.
TABLE I
Components Dimensions in meter
Room 3*7.62*14.6
Inlet vent 0.3*1.0
Outlet vent 0.1*1.0
Window 1.8*1.7
Human r=0.15
Computer 0.15*0.5*0.4
III. METHODOLOGY
[image:3.612.129.485.125.434.2]The work has been done by the help of CFD by using ANSYS Fluent 14.5. At first the geometry were made for each case according to the dimensions and then meshing was done.
Fig. 1 Computer lab model
B. Defining the simulation
Fluid flow (fluent) solver was used to carry out the simulation and the problem was setup as per the following. Here we study 5 different cases by varying inlet air velocity and temperature to obtain better cooling effect.
TABLE II
Model Settings
Space 3D
Time Steady
Viscous RNG k-epsilon turbulence model
Heat Transfer Enabled
Radiation S2S
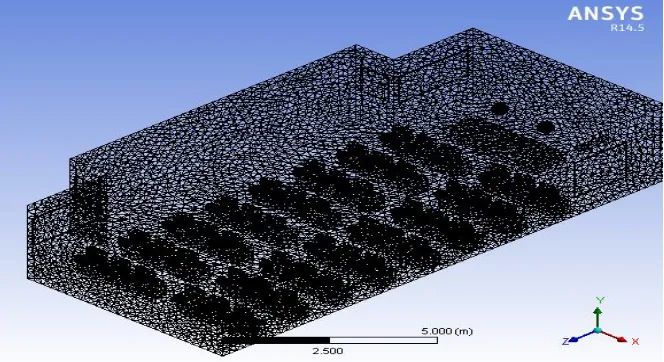
Fig. 2 Meshing of computer lab
C. Boundary conditions
TABLE III
Name of the boundary Type of the boundary Description
Inlet Velocity-inlet Inlet velocity=1m/s
Inlet temperature=290 K
Outlet Outlet-vent
Outer windows Wall
Material=glass Thermal condition=mixed
Free stream temp=303K Outside radiation
temp=310K Heat transfer co-ef=23
w/m²K
Inner windows Wall
Material=glass Thermal condition=convection Free stream temp=303K
Heat transfer co-ef=23 w/m²K
Humans Wall Thermal condition=heat flux
Heat flux=50w/m ²
Tables Wall
Material=wood Thermal condition=convection Free stream temp=296K
D. Different case studies
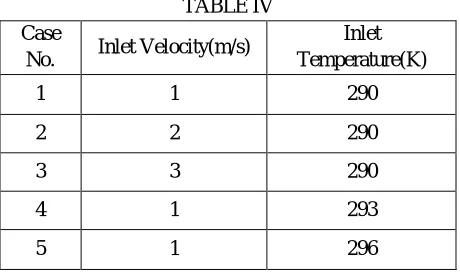
TABLE IV Case
No. Inlet Velocity(m/s)
Inlet Temperature(K)
1 1 290
2 2 290
3 3 290
4 1 293
5 1 296
E. Solar radiation loading
Simulation was defined on 27th of April in Vijaypur approximately 76° Longitude 17°Latitude. The radiation loads were as follows. 1) Direct Normal Solar Irradiation (at Earth's surface) [W/m^2]: 939.478
2) Diffuse Solar Irradiation - vertical surface: [W/m^2]: 57.5043
3) Diffuse Solar Irradiation - horizontal surface [W/m^2]: 95.6388
4) Ground Reflected Solar Irradiation - vertical surface [W/m^2]: 102.954
IV. RESULTS AND DISCUSSION
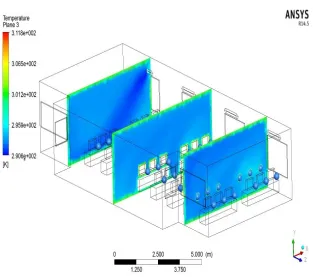
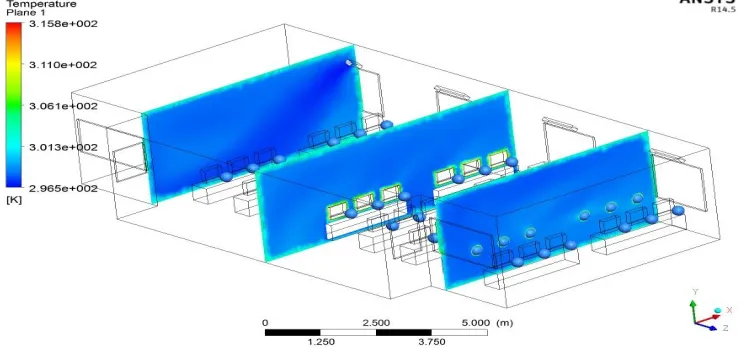
A. Temperature Distribution :( keeping inlet temperature constant and varying the inlet velocity)
[image:5.612.192.422.106.242.2]
Fig. 4 Temperature Distribution (Inlet Velocity=2m/s)
Fig. 5Temperature Distribution (Inlet Velocity=3m/s)
The average temperature obtained in the room by keeping air inlet velocity and temperature 1m/s and 290K respectively was 294K. When velocity of inlet air was changed to 2m/s and 3m/s in the 2nd and 3rd case respectively, the variations in average temperature
Fig. 6 Volume Rendering (Inlet Velocity = 2m/s)
B. Temperature Distribution :( keeping inlet velocity constant and varying the inlet temperature)
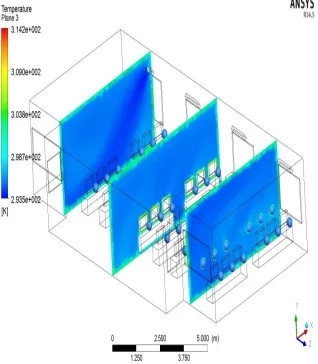
[image:7.612.146.464.332.696.2]Fig. 8 Temperature Distribution (Inlet Temp=296K)
The average temperature obtained by keeping inlet air velocity and temperature 1m/s and 290K respectively was 294K. In the other cases when inlet air temperature was varied to 296K and 299K, the average temperatures obtained were 298K and 304K
respectively.
TABLE V
V. CONCLUSION
We can see from the result table V, the variation in inlet air velocity didn’t have much variation on the comfort condition in the lab where as variation of inlet air temperature has significant effect on the comfort condition in the lab.
So we can conclude that the inlet air velocity ranging from 1 to 2m/s and inlet air temperature ranging from 290K to 293K is sufficient to obtain the required comfort condition.
REFERENCES
[1] S.C.Sekhar, K.W.Tham,David Cheong and N.H.Wong ,“ Ventilation Studies In Nine Air Conditioned Office Building In Singapore ”, Elsevier Science Ltd 2000.
[2] J.W.Wan,Kunli Yang,W.J.Zhang ,J.L.Zhang, “ A New Method For Determination Of Indoor Temperature And Relative Humidity With Consideration Of Human Comfort” , Building and environment ,Feb. 2009, volume 44(2)411-417,DOI.10.1016/J.BUILD.NV 2008.04.001.
[3] Loomans, M.G.L.C, “The Measurement And Simulation Of Indoor Air Flow”, Eindhoven: Technische Universiteit Eindhoven DOI: 10.6100/IR518750, 1998 [4] Loomans, M.G.L.C, “Study On the Applicability Of The Desk Displacement Ventilation Concept”, 1999
[5] Yuguo Li, Sture Hlmberg, “General Flow and Thermal Boundary Conditions in Indoor Air Flow Simulation” volume 29, issue 3July 1994
[6] D.Cokljat, M.Slack, S.A.Vasquez, A Bakker and G.Mntate, “Reynolds-Stress Model for Eulerian Multiphase”, Progress in CFD, an International Journal vol6”, Issue-13: DUI-10.1504/PCFD 2006.009494.
SL No. Input Variables Average Output
Velocity(m/s) Temperature(K) Velocity Temperature(K)
1 1 290 0.12 294
2 2 290 0.13 294
3 3 290 0.15 294
4 1 293 0.12 298