Research Article
CODEN(USA) : JCPRC5
ISSN : 0975-7384
Development and validation of analytical method for simultaneous
estimation of mometasone furoate, hydroquinone and tretinoin in
topical formulation by RP-HPLC
Kinjal Sheliya*, Ketan Shah and Pankaj Kapupara
Department of Quality Assurance, School of Pharmacy, RK University, Kasturbadham, Rajkot
_____________________________________________________________________________________________
ABSTRACT
A simple, sensitive, rapid, precise, andaccurate RP-HPLC method has been developed for simultaneousestimation of Mometasone Furoate (MOM), Hydroquinone (HYQ) and Tretinoin (TRE) from their pharmaceutical dosage form. The Chromatographicseparation was achieved on a reversed-phase Inertsil C18 (4.6 mm I.D. × 250 mm, 5 µm) column using a mobile phase consisting of acetonitrile: Methanol (90:10,v/v) at a flow rate of 0.5 mL/min and UV detection at 266 nm. The method showed linearity with correlation coefficient of MOM, HYQ and TRE was 0.998, 0.9953 and 0.9963 over the range of 5-25µg/mL, 50-250µg/mL and 1-5µg/mL respectively. The mean recoveries were found to be in the range of 99.00 –101.00 % for all the components. The method was validated as per the ICH guidelines for linearity, limit of detection, limit of quantification, specificity, accuracy, precision and robustness. The method can be successfully applied for routine analysis of quantitative determination of MOM, HYQ and TRE in pharmaceutical dosage form.
Key words: Mometasone Furoate, Hydroquinone, Tretinoin, Simultaneous Estimation, RP-HPLC
_____________________________________________________________________________________________
INTRODUCTION
Mometasone Furoate (MOM) is a topical corticosteroid; it has anti-inflammatory, anti-pruritic, and vasoconstrictive properties. Corticosteroids act by the induction of phospholipase A2 inhibitory proteins, collectively called lipocortins. It is postulated that these proteins control the biosynthesis of potent mediators of inflammationsuch as prostaglandins and leukotrienes by inhibiting the release of their common precursor arachidonic acid[1,2,3].
O
O
O
O
O
HO
Cl
Cl
HO OH
Figure 1: Structure of Mometasone Furoate Figure 2: Structure of Hydroquinone
O
OH
Figure 3: Structure of Tretinoin
EXPERIMENTAL SECTION
Instrumentation
HPLC of Cyberlab(Model: Cyberlab 1600 EX) with InertsilC18 (4.6 mm I.D. × 250 mm, 5 µ m) Column was used for
chromatographic separation. Its contain Rheodyne 7725i injector and UV Detector (Deuterium). The ultrasonic bath made by Today-Tech was used for sonication. UV Visible spectrophotometer (LT - 2900) made by Labtronics and Analytical balance (BL – 220H) made by Shimadzu Ltd. having weighing capacity of 0.01 – 200 gm were used for the study.
Chemicals and Reagents
Pharmaceutically pure samples of MOM, HYQ and TRE were obtained as a gift samples from Glenmark Pharmaceuticals, Nasik; K. K. Poonja& Sons, Vapi and Shalak Pharmaceuticals, New Delhi respectively. Acetonitrile and Methanol were obtained from Merck Specialities Private Limited, Mumbai and Molychem, Mumbai Respectively, Tetrahydrofuran and water were obtained from LobaChemie Pvt. Ltd., Mumbai and Astron Chemicals, Ahmedabad respectively.
Preparation of standard stock solution
Accurately 10 mg of MOM, HYQ and TRE were weighed separately and transferred to three different 100 mL volumetric flask. Each of them was dissolved in few mL of acetonitrile. All the solutions were ultrasonicated for 20 minutes on ultrasonicator. The volume was made up to the mark with acetonitrile to produce a final solutions containing 100 µg/mL of MOM, 100 µg/mL of HYQ and 100 µg/mL of TRE respectively. Then it was filtered through 0.45 µ m 47 mm membrane filter paper.
Preparation of standard solution of ternarymixtures of MOM, HYQ and TRE
Accurately weighed 20 mg of HYQ and added in 100 mL volumetric flask. To the same flask 10 mL of MOM standard stock solution (100 µg/mL) and 2.5 mL of TRE standard stock solution (100µg/mL) were added. Few ml of acetonitrile was added.The solutions were ultrasonicated for 20 minutes on ultrasonicator. The volume was made up to the mark with acetonitrile to obtain a ternary mixture containing 10 µg/mL of Mometasone Furoate, 200 µg/mL of Hydroquinone and 2.5 µg/mL of Tretinoin. Then it was filtered through 0.45 µm 47 mm membrane filter paper.
Construction of calibration plots
Analysis of marketed formulation
A quantity of cream equivalent to 20 mg of HYQ, 1mg of MOM and 0.25mg of TRE was taken and dissolved in 20mL of tetrahydrofuran (THF). The cream was triturated for 10 - 15 min. Add few mL of acetonitrile. The solutions were ultrasonicated for 20 minutes on ultrasonicator. The volume was made up to 100 mL withacetonitrileand filtered through whatman filter. The final solution obtained has concentration of 10 µg/mL of MOM, 200 µg/mL of HYQ and 2.5 µg/mL of TRE. This solution was analysed using the developed method [10].
Chromatographic condition
Standard solutions of MOM, HYQ and TRE were injected in column with 20 µ L micro-syringe. The chromatogram was run for appropriate minutes with mobile phase Acetonitrile : Methanol (90:10 v/v) which was previously degassed. The flow rate was set to 0.5 mL/min. and detection was carried out at wavelength 266 nm. The chromatogram was stopped after separation achieved completely. Data related to peak like area, height, retention time, resolution etc. were recorded using software.
Statistical calculation
Standard regression curve analysis was performed by use of Microsoft Excel 2007 software without forcing through zero. Standard deviations and other statistical parameters were calculated by this software.
Validation
The objective of method validation is to demonstrate that the method is suitable for its intended purpose as it is stated in ICH guidelines. The method was validated for linearity, precision (repeatability, intraday and interday precision), accuracy, specificity and robustness. Accuracy was assessed by measuring recovery at three different levels. Precision was assessed by measurement of intra and interday precision. In the intraday study the concentrations of all the drugs were calculated six times on the same day at different time intervals. In the inter day study the concentration of the drugs were calculated on six different days. Specificity of the method was assessed by injecting solutions containing all the drugs; after chromatography three sharp peaks were obtained for all drugs. LOD and LOQ were measured to evaluate the detection and quantitation limits of the method and to determine whether these were affected by the presence of impurities. They were calculated by using equations LOD = 3.3 × SD/slop of calibration curve and LOQ = 10 × SD/slop of calibration curve.
RESULTS AND DISCUSSION
HPLC method Development and Optimization
The multi component formulations have gained a lot of importance as there is greater patient acceptability, increased potency and decreased side effects. MOM, HYQ and TRE are combinational dosage form used as anti-acne. This work was focused on the optimization of the conditions for the simple and rapid as well as low cost effective analysis including a selection of the proper column or mobile phase to obtain satisfactory results.Solvent type, solvent strength, detection wavelength and flow rate were varied to determine the chromatographic conditions giving the best separation. The mobile phase conditions were optimized so there was no interference from solvent and excipients.
Method development was started with 100% methanol but poor resolution was found between peaks of all the drugs. The mobile phase was then adjusted by mixing acetonitrile with methanol in the ratio of 40: 60. But poor resolution occurs between first two peaks and broadening in third peak. In order to optimize the better peak separation and resolution, Ratio of acetonitrile and methanol was altered logically. Finally the mobile phase contains acetonitrile: methanol (90:10, v/v) with flow rate 0.5 mL/min. was selected.
Figure 4. Overlay UV spectra of MOM, HYQ and TRE
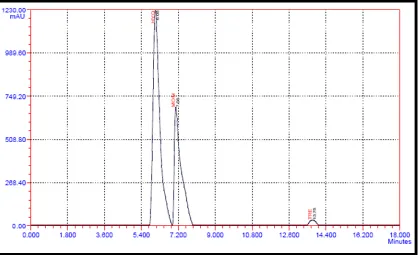
Figure5. Optimized chromatogram for MOM, HYQ and TRE (100 µg/mL)
Method Validation
Tailing Factor 0.75 0.81 0.94 Number of Theoretical Plates 2356 2569 2478 Resolution Between MOM and HYQ 1.74 Between MOM and TRE 6.88
*Mean of six determinations
Linearity
[image:5.595.147.468.89.148.2]Linearity was tested in the concentration range 5, 10, 15, 20 and 25 µg/mL for MOM; 50, 100, 150, 200 and 250 for HYQ and 1, 2, 3, 4 and 5 for TRE. All the solutions were chromatographed six times in accordance with the ICH. Separates calibration plots for MOM, HYQ and TRE were constructed by the plotting peak area against respective concentration and the method was evaluated by determination of the correlation coefficient and intercept, calculated in the corresponding statistical study, correlation coefficient r2 values > 0.999 and intercept very closed to zero confirmed the good linearity of the method.
Table 2. Results from study of linearity
Parameters MOM* HYQ* TRE*
Detection wavelength 266 nm 266 nm 266 nm Beer’s low limit (µg/mL) 5-25 50-200 1-5 Correlation Coefficient (r2) 0.998 0.995 0.996
Regression Equation y = 31800x + 22364 y = 2303.7x - 6076.9 y = 2973.2x + 228.67
Slop 31800 2303.7 2973.2
Y – intercept 22364 -6076.9 228.67
LOD (µg/mL) 0.0815 0.4208 0.2866
LOQ (µg/mL) 0.2468 1.2750 0.8686
*Mean of six determinations
Assay of marketed formulation
The percentage label claim present in marketed formulation was found to be 100.81 ± 0.7679, 100.50 ± 0.4894 and 99.93 ± 0.9266 for MOM, HYQ and TRE respectively. The chromatogram for analysis of marketed formulation is shown in figure 6.
[image:5.595.141.471.268.366.2] [image:5.595.97.516.440.695.2]Table 3.Result from assay of marketed Formulation
Brand Drug % Mean Recovery Standard Deviation % Relative Standard Deviation Standard Error
Mometasone Furoate 100.81 0.7679 0.7617 0.3134
ClinSkin Hydroquinone 100.50 0.4894 0.4869 0.1997
Tretinoin 99.93 0.9266 0.9272 0.3782
Precision
For repeatability standard solution containing MOM (10 µg/mL), HYQ (200 µg/mL) and TRE (2.5 µg/mL) were injected six times and area of peak were measured. For intraday precision, the solutions were analyzed six times on the same day and for interday precision, the solutions were analyzed six times on the different day and % RSD was calculated.
Table 4. Result from Study of Precision
Drug % Mean Label Claim Standard Deviation % Relative Standard Deviation Standard Error Repeatability Data
Mometasone Furoate 100.73 0.7990 0.7932 0.3261
Hydroquinone 100.00 0.8679 0.8679 0.3542
Tretinoin 100.71 0.9955 0.9885 0.4063
Intra-day Precision
Mometasone Furoate 100.66 0.7344 0.7296 0.2997
Hydroquinone 100.02 0.8492 0.8490 0.3466
Tretinoin 99.98 0.4981 0.4982 0.2033
Inter-day Precision
Mometasone Furoate 100.97 0.7261 0.7191 0.2963
Hydroquinone 100.43 0.5994 0.5968 0.2446
Tretinoin 100.14 0.5101 0.5094 0.2082
Accuracy
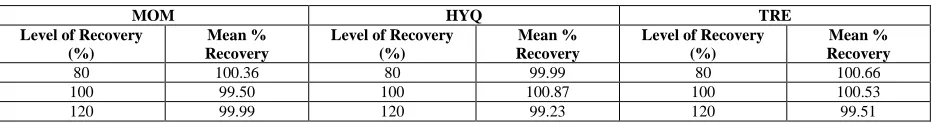
To check the accuracy of proposed method, recovery studies were carried out from pre analysed samples at three different levels of standard addition 80%, 100% and120% of label claim. The validity and reliability of proposed method was assessed by recovery studies by standard addition method.
Table 5. Results from study of Accuracy
MOM HYQ TRE
Level of Recovery (%)
Mean % Recovery
Level of Recovery (%)
Mean % Recovery
Level of Recovery (%)
Mean % Recovery
80 100.36 80 99.99 80 100.66
100 99.50 100 100.87 100 100.53
120 99.99 120 99.23 120 99.51
Robustness
As defined by the ICH, the robustness of analytical procedure describes to its capacity to remain unaffected by small, but deliberate variations in method parameters and provides an indication of its reliability during normal usage. Robustness was performed by small variation in the chromatographic conditions and found to be unaffected by small variations like ± 1 % variation in volume of mobile phase and ± 0.1 mL/min. flow rate of mobile phase.
Specificity
The specificity of the HPLC method was determined by complete separation of Mometasone Furoate, Hydroquinone and Tretinoin with parameters like retention time (tR), resolution (RS) and tailing factor (Tf). Here tailing factor for
peaks ofMometasone Furoate, Hydroquinone and Tretinoin was less than 2 % and resolution was also more than 1.5%.
CONCLUSION
A simple, accurate and precise HPLC method was developed and validated for the routine analysis of Mometasone Furoate, Hydroquinone and Tretinoin in cream topical formulation. The results reveals that the proposed method could be successfully applied for the routine analysis and quality control of pharmaceutical dosage forms containing Mometasone Furoate, Hydroquinone and Tretinoin.
[image:6.595.74.543.440.502.2]REFERENCES
[1]JC Donovan; JG Dekoven. Dermatitis,2006, 17(3),147-151.
[2]HC Korting; K Maslen; G Gross; CWillers. J. Dtsch. Dermatol. Ges.,2005, 3(5),348-53. [3]SShaikh; MS Muneera. J. Chromatogr. Sci.,2009, 47, 178-183.
[4]PO Odumosul; TO Ekwe.Afr. J.Pharm. Pharmacol.,2010, 4(5), 231-234. [5]D Claudia; O Luigia. J. Chromatogr. A.,2000,887, 489-496.
[6]PVV Satyanarayana; MMMurali. Int. J. Res. Rev. Pharm. Appl. Sci.,2011,1(1), 13-19. [7]BT Maliheh; M Namadchian. DARU J. Pharm. Sci.,2013, 21(29), 1-4.
[8]L Brunton, KL Parker: Goodman and Gilman’s Manual of Pharmacology and Therapeutics,12th Edition, The McGraw-Hill Companies,USA, 2008;1078-1083.
[9]LW Fu; RB Vender. Skin Therapy Lett.2011,16(9), 4-6.