Journal of Chemical and Pharmaceutical Research, 2016, 8(4):1050-1057
Research Article
CODEN(USA) : JCPRC5
ISSN : 0975-7384
Performance analysis of tumor and edema segmentation wavelets and deep
neural networks
Anto Bennet M., Yamini K., Sandhiya P. and Shalini P. P.
Department of Electronics and Communication Engineering, VELTECH, Chennai-600062
_____________________________________________________________________________________________
ABSTRACT
Brain MR Image segmentation is a very important and challenging task that is needed for the purpose of diagnosing brain tumors and other neurological diseases.Medical imaging plays a central role in the diagnosis of brain tumors. Early imaging methods invasive and sometimes dangerous, such as cerebral angiography and Pneumoencephalography have been abandoned in favor of non-invasive, high-resolution techniques, especially Magnetic Resonance Imaging (MRI) and Computed Tomography (CT) scans. Deep Neural Network (DNN) is used to show superior results in both image and speech applications. Brain tumors have different characteristics such as size, shape, location and image intensities. They may deform neighbouring structures and if there is edema with the tumor, intensity properties of the nearby region change. To analyze the brain tumor and edema by segmenting the MR Images using wavelets and deep neural networks. Each tissue is appeared clearly (tumor, edema, CSF, WM, and GM).Deep Neural Networks (DNNs) are often successful in problems needing to extract information from complex, high-dimensional inputs, for which useful features are not obvious to design. In the proposed method, first the input image is converted into gray level and then it uses the edge detection. After the edge detection, segmentation is applied, and then applies the CNN and Harr transform in-order to get the desired output.
Keywords: Deep Neural Network (DNN), Magnetic Resonance Imaging (MRI), Computed Tomography (CT)
scans.Convolutional Random Field (CRF) and Markov Random Field (MRF).
_____________________________________________________________________________________________
INTRODUCTION
Anto Bennet M. et al
J. Chem. Pharm. Res., 2016, 8(4):1050-1057
______________________________________________________________________________
glial tumors have a clear boundary between necrotic and active parts, and that some may not have any necrotic parts also complicates segmentation Neural networks (NN) perform classification by learning from data and do not use rule sets. NN can generalize using previous data and learn from past experience[3,4].
Topological relationships of the SOM are conserved in the input and adjacent inputs are mapped to adjacent neurons they demonstrated that anisotropic diffusion filter blurs homogeneous regions, increase the ratio of signal-to-noise and sharpens the object borders. This filter also diminishes noise and reduces partial volume effects, thus, greatly reducing subsequent operator-dependent errors in misclassified training points one-level SWT is used to decompose images into sub-bands [5,6]. Then spatial filtering methods are performed to obtain feature vector. SOM is trained using the unsupervised learning algorithm. In methodology there is no need to use an additional NN for clustering the SOM. This developed an algorithm, based on the hit histograms of the BMUs of the output neurons for the tissue types to be segmented using the manually labeled image regions. The proposed algorithm utilizes the neighborhood relations of the topology of the SOM. Following the unsupervised learning, we used supervised LVQ algorithm to tune the output neurons of the network by finding their best position [7-10].
EXPERIMENTAL SECTION
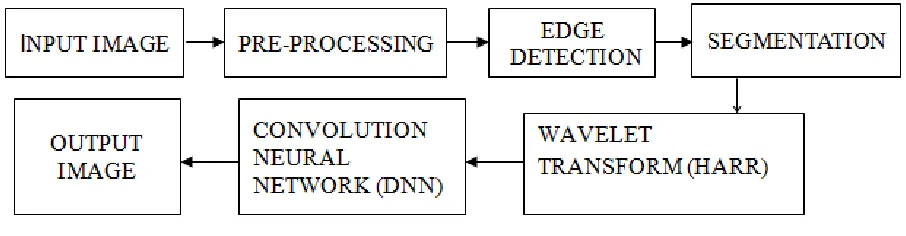
[image:2.595.72.525.452.570.2]BRAIN MR Image segmentation is a very important and challenging task that is needed for the purpose of diagnosing brain tumors and other neurological diseases. Brain tumors have different characteristics such as size, shape, location and image intensities. In adults, the most common and cancer-causing tumor type is glial tumors that have a high mortality rate. Over 90% of all tumors in persons over 20 y are glial tumors. It occurs in the glial cells of the brain and show a rapid growth by extending into the healthy brain tissues. Deep Neural Networks (DNNs) are often successful in problems needing to extract information from complex, high-dimensional inputs, for which useful features are not obvious to design. In the proposed method, first the input image is converted into gray level and then it uses the edge detection. After the edge detection, apply the CNN in-order to get the desired output. Input image is a MRI scanned image is passed through the pre-processing .Pre-processing method is used to resize the image, converting the original image into gray level image and filtering. The output of pre-processing is transferred to the edge detection Region based edge detection is used to avoid the noise and to get accurate result. After, image is segmented using threshold segmentation. The output of the segmentation is used in feature extraction by Harr transform. Apply the CNN to get the desired output shown in fig 1.
Fig 1.Block diagram of Proposed System
PRE-PROCESSING
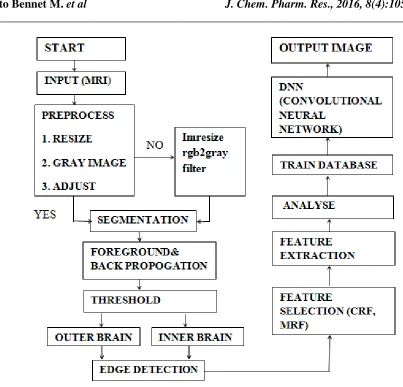
FIG.2 shows the internal process of the proposed system. The segmentation process used the fore ground and back propagation which is used to reduce the loss of intensity, clarity, etc. Feature selection has convolutional random field (CRF) and markov random field (MRF).
EDGE DETECTION
Smoothing is a process of reducing sharp transitions in the gray levels of an image. It uses for Blurring, Noise Reduction.A mask or filter window is used to calculate the weight average of its neighbourhood pixels. It uses a 2x2 window, 3x3 windows and 5-point weighted averaging which is shown in figure 3.
Fig 3.2X2Window Fig 4. 3X3 Window
0 0.125 0
0.125 0.25 0.125
0 0.125 0
FIG 5. 5-Points Weighted Averaging
0.25 0.25
0.25 0.25
0.111 0.111 0.111
0.111 0.111 0.111
Anto Bennet M. et al
J. Chem. Pharm. Res., 2016, 8(4):1050-1057
______________________________________________________________________________
IMAGE SEGMENTATION
The term image segmentation refers to the partition of an image into a set of regions that cover it. The goal in many tasks is for the regions to represent meaningful areas of the image, such as the crops, urban areas, and forests of a satellite image. In other analysis tasks, the regions might be sets of border pixels grouped into such structures as line segments and circular arc segments in images of 3D industrial objects.
Regions may also be defined as groups of pixels having both a border and a particular shape such as a circle or ellipse or polygon. When the interesting regions do not cover the whole image, we can still talk about segmentation, into foreground regions of interest and background regions to be ignored. Segmentation has two objectives. i) The first objective is to decompose the image into parts for further analysis. In simple cases, the environment might be well enough controlled so that the segmentation process reliably extracts only the parts that need to be analysed further. For example, in the chapter on color, an algorithm was presented for segmenting a human face from a color video image. The segmentation is reliable, provided that the person’s clothing or room background does not have the same color components as a human face. In complex cases, such as extracting a complete road network from a grey scale aerial image, the segmentation problem can be very difficult and might require application of a great deal of domain a building knowledge. ii) The second objective of segmentation is to perform a change of representation. The pixels of the image must be organized into higher-level units that are either more meaningful or more efficient for further analysis (or both). A critical issue is whether or not segmentation can be performed for many different domains using general bottom-up methods that do not use any special domain knowledge. This chapter presents segmentation methods that have potential use in many different domains.
Both region-based and curve-based units are discussed in the following sections. The prospects of having a single segmentation system work well for all problems appear to be dim. Experience has shown that an implement or of machine vision applications must be able to choose from a tool set of methods and perhaps tailor a solution using knowledge of the application. This chapter discusses several different kinds of segmentation algorithms including the classical region growers, clustering algorithms, and line and circular arc detectors. The division of an image into meaningful structures, image segmentation, is often an essential step in image analysis, object representation, visualization, and many other image processing tasks. A great variety of segmentation methods has been proposed in the past decades, and some categorization is necessary to present the methods properly here. A disjunction categorization does not seem to be possible though, because even two very different segmentation approaches may share properties that defy singular categorization 1. The categorization presented in this chapter is therefore rather a categorization regarding the emphasis of an approach than a strict division. The following categories are used:
Threshold based Segmentation: Histogram thresholding and slicing techniques are used to segment the image.
They may be applied directly to an image, but can also be combined with pre and post-processing techniques.
Edgebased Segmentation: With this technique, detected edges in an image are assumed to represent object
boundaries, and used to identify these objects.
Regionbased Segmentation: Where an edge based technique may attempt to find the object boundaries and then
locate the object itself by filling them in, a region based technique takes the opposite approach, by (e.g.) starting in the middle of an object and then “growing” outward until it meets the object boundaries.
FEATURE EXTRACTION
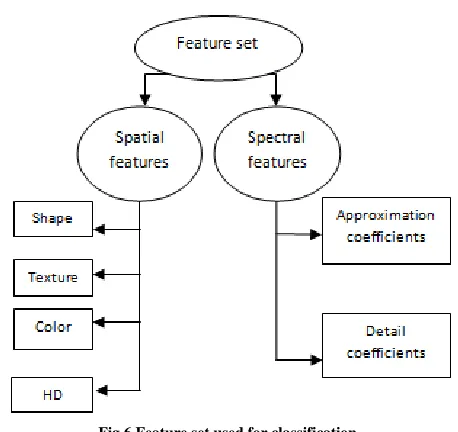
Feature extraction is the process of defining a set of features, or image characteristics, which will most efficiently or meaningfully represent the information that is important for analysis and classification. Transforming the input data into set of features is called feature extraction. Feature selection greatly influences the performance of the classifier and therefore a correct choice of features is very crucial. The work is uses only few features such as nucleus area, cell area, gray level intensity.
Fig.6 Feature set used for classification
Wavelet Transform:
Wavelet transformation is one of the most popular candidates of the time-frequency-transformations.
HAAR TRANSFORM
Haar transform is real and orthogonal. It is a very fast transform and it requires O (N) operations to implement an N81 vector. The basis vectors of the Haar matrix are sequencyorders. Therefore, it is a well-known transform. The Haar transform is based on the Haar function hk(Z). These functions are defined over the continues closed interval z belongs to [0, 1].
LL LH
HL HH
Fig 7. HAAR Transform Sequence Table
HAAR transform sequence it has low low (LL), low high (LH), high low (HL), high high (HH) shown in fig 7.
EDGE DETECTION
Edge detection is the name for a set of mathematical methods which aim at identifying points in a digital image at which the image brightness changes sharply or, more formally, has discontinuities. The points at which image brightness changes sharply are typically organized into a set of curved line segments termed edges. The same problem of finding discontinuities in 1D signal is known as step detection and the problem of finding signal discontinuities over time is known as change detection. Edge detection is a fundamental tool in image processing, machine vision and computer vision, particularly in the areas of feature detection and feature extraction.
CONVOLUTION NEURAL NETWORK
[image:5.595.184.413.102.318.2]Anto Bennet M. et al
J. Chem. Pharm. Res., 2016, 8(4):1050-1057
______________________________________________________________________________
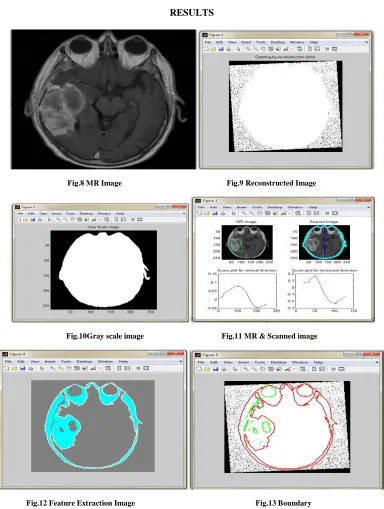
[image:6.595.106.490.99.608.2]RESULTS
Fig.8 MR Image Fig.9 Reconstructed Image
Fig.10Gray scale image Fig.11 MR & Scanned image
Fig.12 Feature Extraction Image Fig.13 Boundary
used. The image is masked to detect the tumor easily. When the mask was removed the unwanted images. Fig 15 shows a wavelet image it has used a HAAR transform for fast analysis and it was a real and orthogonal. The basis vectors of the Haar matrix are sequency orders. It uses a LL, LH, and HL, HH sequence order for the clarity and for the accurate output. Fig 15 shows a tumor detection image by using a convolution neural network which is a deep neural network. It has a set of database. Fig 17 shows a segmentation process. It uses a threshold segmentation to detect the tumor location accurately in the message popup box. Fig 18, shows a tumor classification whether the tumor is malignant or benings. It shows a tumorcell tissues classifier. Fig 19shows a location parameter it explains the position of the tumor by using a message popup box.
Fig.14 Masking Image Fig 15 Wavelet Image
Fig.16Tumor Detection Image Fig.17 Segmentation
Fig.18Tumor Classifier Fig.19Location Parameter
CONCLUSION
Anto Bennet M. et al
J. Chem. Pharm. Res., 2016, 8(4):1050-1057
______________________________________________________________________________
with a stored database and which it gives a good accurate output, clarity. This process is used for all types of tumor by using a set of condition. An MR image is reconstructed and the MR images are passed to the pre-processing method. It converts the reconstructed image into gray scale image which reduces the blur and increases the clarity of the image. Pre-processing method is used for video and image processing. Each image is segmented equally for tumor detection so that the tumor is detected easily. Region Based Boundary technique is used. Red and Green color is used for boundary segmentation. These two colors are used to differentiate the healthy tissues and tumor tissues. Transform is used to get accurate images. It split the images in the basis of LL, LH, HL and HH.HAAR transform is fast and it is real and orthogonal. The same process is used to detect the tumors like lungs, ovary, etc. When the process was used forever without a confusion result and it can avoid the advanced stage of the tumor by taking a treatment.
REFERENCES
[1] A. Alansary; A. Soliman; M. Nitzken; F. Khalifa; A. Elnakib; M. Mostapha; M. F. Casanova; A. El-Baz “An integratedgeometrical and stochasticapproach for accurateinfantbrainextraction “,Image Processing (ICIP), IEEE
International Conference Issue: 2014Pages: 3542 – 3546
[2] N. Boughattas; M. Berar; K. Hamrouni; S. Ruan“image Processing (ICIP), IEEE International
Conference,Issue2014 ,Pages: 1887 - 1891, DOI: 10.1109/ICIP.2014.7025378
[3] N. E. A. Khalid; S. Ibrahim; M. H. Ali; M. Manaf IEEE International Conference on Control System,
Computing and Engineering, Issue 29 Nov. - I Dec. 2013,Pages: 525 – 529.
[4] Khan M. Iftekharuddin, Shaheen Ahmed and JakirHossen”Multiresolution Texture Models For Brain Tumor Segmentation in MRI”.33rd Annual International Conference of the IEEE EMBS Boston, Massachusetts USA,IEEE Conference Publications, Issue August 30 - September 3, 2011,Pages: 6985 – 6988.
[5] S. Ahmed, K. M. Iftekharuddin, and A. Vossough“Efficacy of Texture, Shape, and Intensity FeatureFusion for Posterior-Fossa Tumor Segmentationin MRI”,IEEE Transactions on Information Technology in BiomedicineYear:
2011, Volume: 15, Issue: 2,Pages: 206 – 213.
[6] Nigel Chou, Jiarong Wu, Jordan BaiBingren, AnqiQiu, And Kai-Hsiang Chuang “Robust Automatic Rodent Brain Extraction Using 3-D Pulse-Coupled Neural Networks (Pcnn)”,IEEE Transactions On Image Processing, Vol: 20, Issue. 9, September 2011pages: 2554 – 2564.
[7] M.AntoBennet ,Sankaranarayanan S, Babu GS. Performance and analysis of effective iris recognition system using independent component analysis.Journal of Chemical and Pharmaceutical Sciences.2015; 8(3):571–6. [8] M.AntoBennet, Suresh R, Sulaiman SM. Journal of Chemical and Pharmaceutical Research.2015; 7(8):291–9. [9] M.AntoBennet, Raglend J.. Journal of Computer Science.2012; 8(9):1447–54