Design of an Artificial Neural Network Pattern Recognition Scheme
Using Full Factorial Experiment
lbrahim ~ a s o o d '
a,Nadia Zulikha Zainal ~ b i d i n ' . ~ ,
Nur Rashida ~ o s h i d i ' ~ ,
Noor Azlina binti Rejab'ld, Mohd Faizal ~ o h a r i ' l ~
1
Faculty of Mechanical and Manufacturing Engineering, Universiti Tun Hussein Onn Malaysia,
86400 Parit Raja, Batu Pahat, Johor, Malaysia
Keywords: Artificial neural network, full factorial design of experiment, multi-model classifier,
multivariate quality control, pattern recognition
Abstract. Automated recognition of process variation patterns using an artificial neural network
(ANN) model classifier is a useful technique for multivariate quality control. Proper design of the classifier is critical for achieving effective recognition performance (RP). The existing classifiers were mainly designed empirically. In this research, full factorial design of experiment was utilized for investigating the effect of four design parameters, i.e., recognition window size, training data amount, training data quality and hidden neuron amount. The pattern recognition study focuses on bivariate correlated process mean shifts for cross correlation function, p = 0.1
-
0.9 and mean shifts,p =
*
0.75 - 3.00 standard deviations. Raw data was used as input representation for a generalized model ANN classifier. The findings suggested that: (i) the best performance for each pattern could be achieved by setting different design parameters through specific classifiers, which (ii) gave superior result (average RP = 98.85%) compared to an empirical design (average RP = 96.5%). This research has provided a new perspective in designing ANN pattern recognition scheme in the field of statistical process control.Introduction
In manufacturing industries, process variation has become a major source of poor quality. When manufacturing process involves two or more correlated variables (multivariate), an appropriate scheme is necessary to monitor these variables jointly. In recent years, this issue has been addressed through the development of artificial neural networks (ANN) based pattern recognition schemes. Various schemes such as Novelty Detector ANN [I], Ensemble-ANN [2],
Multi-Module-Structure-ANN [3] and Features-based ANN [4] have been proposed for automatically recognizing multivariate process variation patterns. Further discussion on these schemes can be found in reference [5, 61.
In general, the ANN models were utilized as pattern classifier. As such, a proper design of the classifier is critical in achieving efficient recognition performance (RP). The above literatures reported that the classifier performance was influenced by several design parameters such as network architecture, patterns behaviour, training data amount and training algorithm. For case by case basis, they were commonly determined empirically (based on experience, self assumption, or trial and error experiments). In this study, full factorial design of experiment (FFDOE) was utilized for investigating an optimal design parameters for a generalized ANN model classifier. Details discussion is organized as follows: framework of an ANN scheme; results and discussion on experimental design; conclusions.
ANN Pattern Recognition Scheme
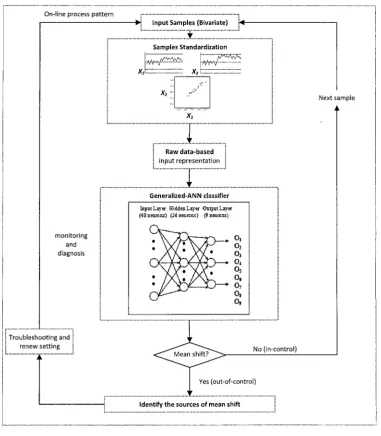
Framework for an ANN pattern recognition scheme was developed based on single stage monitoring and diagnosis approach as shown in Figure 1. Process monitoring refers to the identification of process status either it is running within a statistically in-control or out-of-control
condition, whereas process diagnosis refers to the identification of the source variables of out-of- control process in mean shifts.
Generalized-ANN classifier
h p n t Lays HiddenLga Ouipur Laya
(48 neurons) (Id niwonr) @ nwmas)
I
Yes (out-of-control),
[image:2.595.112.494.109.546.2]I/ Identify the sources of mean shift
... :
Figure 1. Framework of an ANN pattern recognition scheme
Modeling of data of multivariate process variation patterns, design, training and testing of the generalized ANN classifier can be referred in reference [4]. Process patterns were classified as
normal and abnormal patterns (upward and downward shifts). Ideally, raw data should be tapped from real manufacturing industry. However, since a large number of data are required, the artificial data were generated using Lehman model [7]. This methodology has been adopted in previous research [I, 41.
"Partially developed shift patterns" and "dynamic patterns" were applied into the ANN
training and testing respectively to suit for on-line (dynamic) process condition. Tables 1 and 2
con~binations of data correlation)](refer to Table 1). In order to improve discrimination capability between normal and shift patterns, a huge amount of N(0,O) patterns was applied into ANN training. The US(1,l) and DS(1,l) pattern categories also require a huge amount of training patterns since it contain a more complex combination of mean shifts compared to the other bivariate shift pattern categories. In order to achieve the best monitoring performance (not discussed in this article), different percentage of partially developed shift patterns were utilized for different range of mean shifts as shown in Table 2. The starting points of sudden shifts (SS) were determined empirically. The actual value of data correlation is dependent to the variability in the bivariate data. The simulated values (p = 0.1, 0.3, 0.5, 0.7, 0.9) could only be achieved when the process data streams are in either "fully nonnal pattern" or in "fully developed shift pattern".
For representing into an ANN classifier, the samples were standardized to a range between [-3, +3] and then normalized to a compact range between [-I, +I]. For normalization, a maximum and a minimum values were taken from the overall standardized samples. The normalization could minimize noise from the samples, thus provides accurate and consistent recognition.
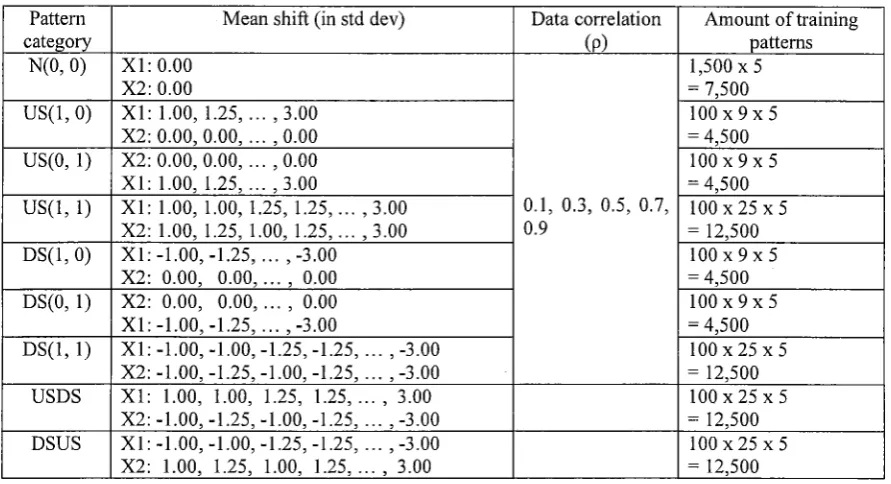
Table 1. Parameters for the artificial data
Table 2. Parameters for the partially developed shift patterns Pattern
category N(0, 0)
US(1, 0)
US(0, 1)
US(1,l)
DS(1, 0)
DS(0, 1)
DS(1, 1)
USDS
DSUS
ANN classifier was trained using gradient descent with momentum and adaptive learning rate (traingdx). Maximum number of epochs and error goal were set as 500 and 0.001 respectively. Learning rate and learning rate increment were set as 0.05 and 1.05, whereas maximum number of epochs and error goal were set as 1500 and 0.001 respectively. Network performance was evaluated based on mean square error (MSE). The hyperbolic tangent hnction in hidden layer limited the
Mean shift (in std dev)
XI: 0.00 X2: 0.00
X l : 1.00, 1.25,
.
. . , 3.00 X2: 0.00, 0.00, ... , 0.00 X2: 0.00, 0.00, . ..
, 0.00 X I : 1.00, 1.25, ... , 3.00X1:1.00,1.00,1.25,1.25 ,..., 3.00 X2: 1.00, 1.25, 1.00, 1.25, ... , 3.00 X l : -1.00, -1.25,
...
, -3.00X2: 0.00, 0.00 ,..., 0.00 X2: 0.00, 0.00,
...
, 0.00 X I : -1.00, -1.25, ... , -3.00XI: -1.00, -1.00, -1.25, -1.25, ... , -3.00 X2: -1.00, -1.25, -1.00, -1.25, ... , -3.00 X1: 1.00, 1.00, 1.25, 1.25 , . . . , 3.00 X2: -1.00, -1.25, -1.00, -1.25, ... , -3.00 X1: -1.00, -1.00, -1.25, -1.25, ... , -3.00 X2: 1.00, 1.25, 1.00, 1.25 , . . . , 3.00
Range of mean shifts (in standard deviations)
*
11.00, 1.501*
11.75, 2.251*
12.50, 3.001Data correlation
(PI
0.1, 0.3, 0.5, 0.7, 0.9
Amount of partially developed shift patterns
213 (66.7%)
112 (50.0 %)
113 (33.3 %)
Amount of training patterns 1,500 x 5 = 7,500
1 0 0 x 9 ~ 5 = 4,500
1 0 0 x 9 ~ 5 = 4,500
100 x 25 x 5 = 12,500
1 0 0 ~ 9 x 5 = 4,500
1 0 0 x 9 ~ 5 = 4,500
1 0 0 ~ 2 5 ~ 5 = 12,500
1 0 0 x 2 5 ~ 5 = 12,500
1 0 0 ~ 2 5 x 5 = 12,500
Starting point of sudden shift ( s s )
Sample gt"
Sainple 13"'
[image:3.595.80.526.287.529.2]hidden output between [-I, +l] and sigmoid function in output layer limited the classification output between [0, 11. The training process was stopped whenever either the error goal has been met or the maximum allowable training epoch has been reached. The training reached error goal between I00 to 300 epochs.
Experimental Design: Results and Discussion
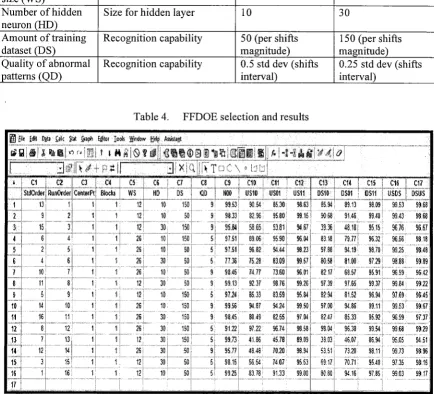
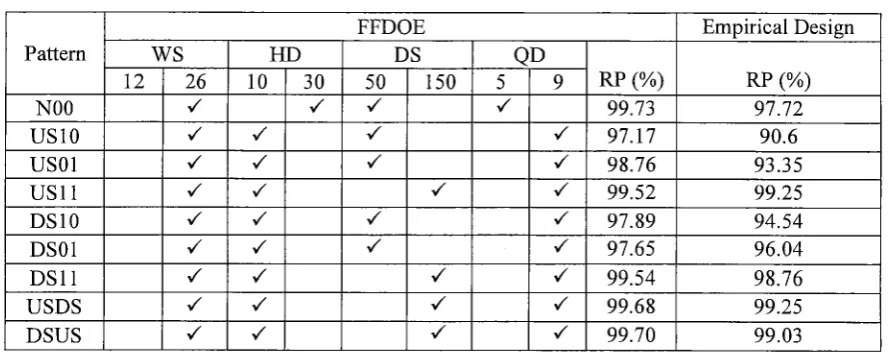
FFDOE was utilized in investigating the effects of four design parameters as shown in Table 3 towards the RP of a generalized ANN model. Then, an optimal design was proposed. The analysis was performed using MINITAB software which involved selection of experiment design and main effect plot. Table 4 shows the overall results of experiments.
Table 3. Design Parameters for an ANN model
Table 4. FFDOE selection and results Design Parameters
Recognition window size (WS)
Number of hidden neuron (HD) Amount of training dataset (DS)
Quality of abnormal patterns (QD)
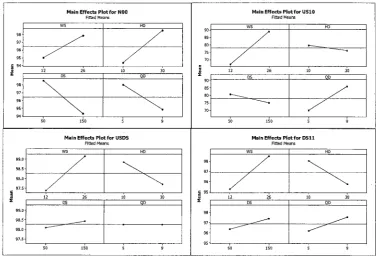
Based on main effects plot analysis as shown in Figure 2, WS can be observed as the most effective parameter, among others, for overall shift patterns being recognized. This parameter
Relationship to ANN Size for input layer
Size for hidden layer
Recognition capability
Recognition capability
Low Level 12
10
50 (per shifts magnitude) 0.5 std dev (shifts interval)
High Level 26
3 0
[image:4.596.81.515.295.689.2]performed better performance at high level (26). Parameter HD at low level (10) gave better performance for overall shift patterns. Increment in HD impared the recognition accuracy (e.g. US10 patterns: HD = 10, RP = 97.22%; HD = 30, W = 94.87%). Meanwhile, in recognizing
normal pattern (NOO), this parameter indicated better result at high level (30). As such, in order to balance the discrimination capability between normal and abnormal patterns, an exact value of HD could be within a range of [lo, 301. Parameter QD, on the other hand, gave an inverse effect in comparison with HD. This parameter performed better for overall shifts patterns at high level (0.25 standard deviations of shifts interval). Inversely, it gave better result at low level (0.50 standard deviations of shifts interval) for normal patterns. Parameter DS has different effects for different patterns being recognized. This parameter performed better at low level (50 per shifts magnitude) for NOO, US01
,
US 10, DS 10 and DSO 1. Inversely, it performed better at high level for US 1 1, DS 1 1, USDS and DSUS patterns.Table 5 summarizes the guideline of design parameter setting for achieving efficient recognition accuracy performance (RP) for each individual pattern. For instance, the highest performance for normal pattern WOO) could be achieved by setting the parameters at WS = 26, HD
= 30, DS = 50 and QD = 5. This guideline represents the outcomes of FFDOE analysis. Based on this guideline, further experiments have been performed to evaluate the performance of an ANN
model classifier when design with FFDOE compared to an empirical design. Obviously, the ANN
[image:5.595.112.490.389.649.2]model with FFDOE has outperformed the empirical designed ANN. Since the different type of patterns could be recognized effectively using specific design parameters setting, the best performance could be realized through the development of multi-model ANN classifiers (specific classifier). The proposed multi-model should consist of 9 individual ANN classifiers which are trained using specific design parameter setting.
Figure 2. Main effects plot for several individual patterns
Main Effeds Plot for NO0 Main Effects Plot for US10
F l e d Mealv Flhed Meam
...
96 \
95 70
94
SO 150 5 9
Main Effeds Plot for USDS
Rtted Means
50 150 5 9
50 150 5 9
Main Effecrs Plotfor DS11
Fltted Means
...
Table 5. Design parameter setting for recognizing individual patterns
Note: Empirical design - WS = 24, HD = 26, DS = 100, QD = 9
Conclusions
In developing a pattern recognition scheme for multivariate quality control application, proper selection of design parameters of an ANN model classifier is important towards heightening the recognition performance. In previous researches, the design parameters were mainly determined empirically. This study, however, proved that the classical FFDOE with main effect plot analysis was effective in designing an ANN classifier. The findings suggested that: (i) Different types of patterns such as normal and shifts could be recognized effectively using specific design parameters. As such, the best performance for each pattern could be achieved through multi-model ANN classifier, and (ii) FFDOE gave superior results in comparison with an empirical design. Overall, a guideline in designing ANN pattern recognition scheme could be a reference in the field of statistical process control.
References
[I] Zorriassatine F, Tannock JDT, O'Brien C (2003) Using novelty detection to identify abnormalities caused by mean shifts in bivariate processes. Computers and Industrial Engineering 44: 385-408.
[2] Yu JB, Xi LF, Zhou XJ (2009) Identifying source(s) of out-of-control signals in multivariate manufacturing processes using selective neural network ensemble. Engineering Applications of Artificial Intelligence 22: 141-1 52.
[3] El-Midany TT, El-Baz MA, Abd-Elwahed MS (2010) A proposed framework for control chart pattern recognition in multivariate process using artificial neural networks. Expert Systems with Applications 37: 1035-1042.
[4] Masood I, Hassan A (2013) Pattern recognition for bivariate process mean shifts using feature-based artificial neural network. International Journal of Advanced Manufacturing Technology 66 (9-12): 1201-121 8.
[5] Masood I, Hassan A (2010) Issues in development of artificial neural network-based control chart pattern recognition schemes. European Journal of Scientific Research 39(3): 336-355. [6] Hachica W, Ghorbel A (2012) A survey of control-chart pattern-recognition literature
(1991-2010) based on a new conceptual classification scheme. Computers and Industrial Engineering 63: 204-222.
[7] Lehman RS (1977) Computer simulation and modeling: an introduction. Lawrence Erlbaum,
[image:6.595.80.525.90.270.2]