893
©IJRASET (UGC Approved Journal): All Rights are Reserved
Detection of Salinity Level in Soil for Vegetation
Using Remote Sensing & GIS Techniques in Nawa
Taluk, Rajasthan
Sabyasachi kabiraj1, Dr. Carolin Arul2, Kumar Erraiyan3
1
University of Madras
Abstract: The salinity changes as well as vegetation coverage changes have been adopted for the present study. Changes in vegetation coverage and salinity change are a slow & gradual process and are hard to identify without long term historical data. The Landsat 8 and ETM+ data along with Electronic conductivity data of soil and International Soil Reference and Information Centre (ISRIC) soil PH data were used to show the changes in vegetation coverage as well as in soil salinity. Several remote sensing based indices like NDVI, NDSI and MSI were employed to extract spatial information on vegetation health, soil salinity and soil moisture. The soil salinity in terms of NDSI increased in the study area. The NDSI values were compared with ISRIC soil data and Electrical conductivity (EC) soil data of Groundwater board. The Vegetation coverage of the study area has been changed gradually since 2010 to 2017. Land use and land cover supervised classification has been done using Landsat 8 data of 2017 for extracting built up area. Moisture stress index has been done to show the variation of moisture on the study area. Normalize difference vegetation index of 2010 and 2017 has been done to show the vegetation coverage changes from 2010 to 2017. Normalize difference salinity index of 2010 and 2017 has been done to show the variation in salinity from 2010 to 2017. Using ISRIC soil PH value and EC values are than compared with the satellite data of salinity in terms of NDSI value for accuracy analysis. More than 80% of the study areas are matched with satellite data of salinity. Some minor unmatched areas are also there but salinity level is not much different.
I. INTRODUCTION
Soil salinity is basically of two types. They are primary salinity and Human induced salinity. Soil salinity mostly occur due to the weathering of rocks and primary minerals transported by the water and wind. The various other causes of soil salinity are topography, irrigation and dry land salinity which are mainly occur due to the clearance of forest, overgrazing and cutting bushes which cause water tables to rise and bring saline groundwater close to the land surface. Nawa taluk is located on the eastern side of the Nagaur District. The climate of the Nawa has a dry and hot summer and marked by extreme dryness, large variation of temperature and highly irregular rainfall pattern. The maximum and minimum temperature recorded 48ºc and 0ºc respectively. The amount of rainfall is also very less. The rainfall amount of the whole Nagaur district is 36.16 cm. The topography of the Nawa is a good combination of plain, hills, sand mounds and it is a part of the great Indian Thar desert. According to the 2001 census data Nawa had a population of 18226. Among the total population 53% males and 47% females.
II. AIMS
The study aims are to Identifying Salt-affected soil in vegetation areas using Remote Sensing and GIS techniques in Nawa taluk, Rajasthan, India.
III. OBJECTIVES
1) To show the land use and land cover in the study area in the present year
2) To show the change in the area coverage of vegetation and salinity from 2000 to 2017 using NDVI and NDSI.
3) To show the salt affected soil and salinity level for vegetation in the study area.
IV. DATA SOURCE
894
©IJRASET (UGC Approved Journal): All Rights are Reserved
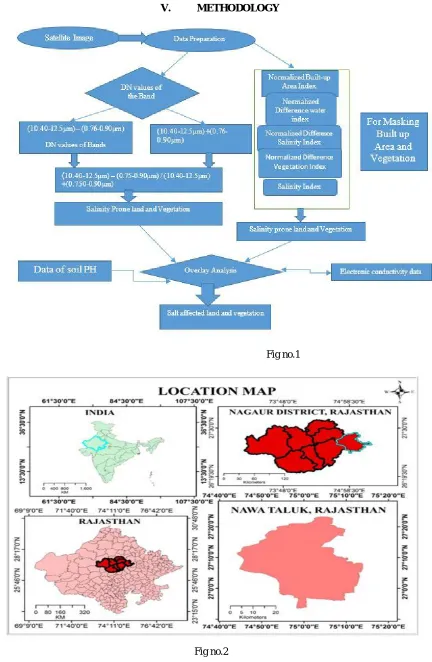
[image:3.612.95.527.75.737.2]V. METHODOLOGY
Fig no.1
895
©IJRASET (UGC Approved Journal): All Rights are Reserved
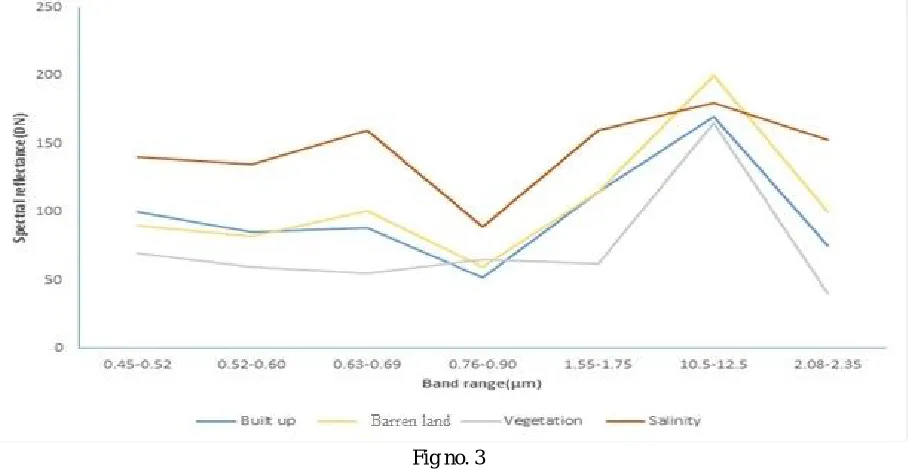
VI. STUDY AREA
[image:4.612.82.536.163.398.2]Nawa Taluk is located between 74.688E to 75.244 E longitudes and between 26.877 to 27.413 N latitudes with a total geographical area of 1519 sq.km. The study area is coming under NAGAUR Taluk. It is located on the eastern side of the NAGAUR Taluk. According to the 2001 India census, Nawa Taluk had a population of 18226. The maximum temperature of recorded in the Nawa is 117 F with 32 F as the lowest recorded temperature. The average rainfall in the district is 36.16 cm and 51.5% relative humidity.
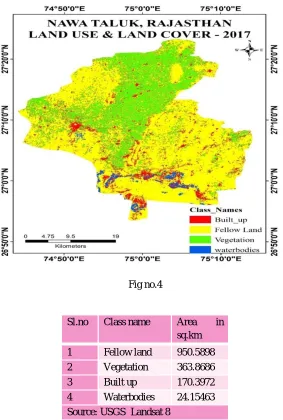
Fig no. 3
INDICES EQUATION REFERENCES
1. Normalized Difference Salinity Index NDSI =
(0.63 to 0.69 μm) - (0.9 to 0.76-μm (.63 to 0.69 μm) + (0.76 to 0.9 μm)
Khan et al. (2005)
2. Normalized Difference Vegetation Index
NDVI =
(0.76 to 0.9 μm) – (0.63 to 0.69 μm) (0.76 to 0.9 μm) + (0.63 to 0.69 μm)
Deering et al. (1975)
3. Simple Ratio (SR) SR = 0.75-0.90 μm/0.63-0.69 μm Birth and Mcvey (1968)
4. Moisture Stress index MSI = 1.55-1075 μm / 0.75-0.90 μm Rock et al. (1986)
5. Normalized Difference Salinity Index (1)
NDSI =
(10.40-12.5μm) – (0.75 .90μm)
(10.40-12.5μm) +(0.750.90μm)
(Iqbal, 2008; Iqbal 2010)
896
©IJRASET (UGC Approved Journal): All Rights are Reserved
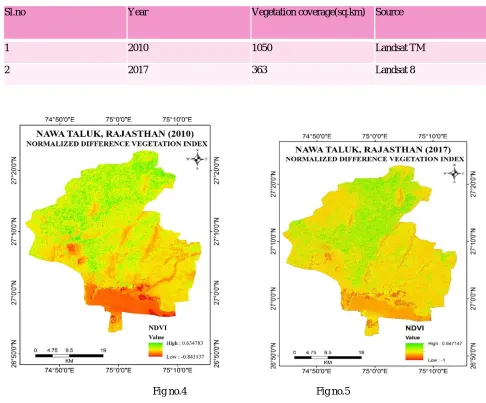
A. Land Use And Land Cover Classification Of The Year 2017:
[image:5.612.161.444.190.610.2]Land use and Land cover practices is another important factor for the causes of soil salinity. The various land use types affect the level of soil salinity like vegetation, built up, water bodies, fellow land. Vegetation coverage is one of the major land use types which affects soil salinity. If the vegetation is covered most of the area, the evaporation rate will be less in the soil and it will reduce the soil salinity. In The study area also found that there are changes in the vegetation coverage, decreasing from 2010 to 2017. This changes in vegetation coverage affecting soil salinity in the present study area. Built up area is also an important factor which increases temperature and it will lead to increase evaporation rate which will affect soil salinity. In the present study area, the built up area is increased from 2010 to 2017. Similarly, changes in water bodies and fellow land also effect in soil salinity change.
Fig no.4
B. Changes Of Vegetation Coverage
Vegetation coverage of the area in the year 2010 is 1050sq.km, whereas, in 2017, it is 363 sq.km. Vegetation area is decreasing gradually from 2010 to 2017. Negative values of NDVI (values approaching -1) correspond to water. Values close to zero (-0.1 to 0.1) generally correspond to barren land areas of rock, sand or snow. Lastly, low positive values (approximately 0.2 to 0.4) while high values indicate temperate and tropical rainforest (values approaching +1). Vegetation is one of the major controlling factor in soil salinity. Vegetation covers the land and it obstruct sunlight to heat land surface directly. Thus it reduces the evaporation rate of the soil. Vegetation also helps in percolation of water into the soil. The roots of the vegetation dig into the soil and creates crack, fracture, joints. The roots of the vegetation also bind soil tightly and restrict from soil erosion. Thus vegetation helps in maintain soil salinity as well as groundwater and soil erosion.
Sl.no Class name Area in
sq.km
1 Fellow land 950.5898
2 Vegetation 363.8686
3 Built up 170.3972
4 Waterbodies 24.15463
897
©IJRASET (UGC Approved Journal): All Rights are Reserved
Sl.no Year Vegetation coverage(sq.km) Source
1 2010 1050 Landsat TM
[image:6.612.55.541.72.475.2]2 2017 363 Landsat 8
Fig no.4 Fig no.5
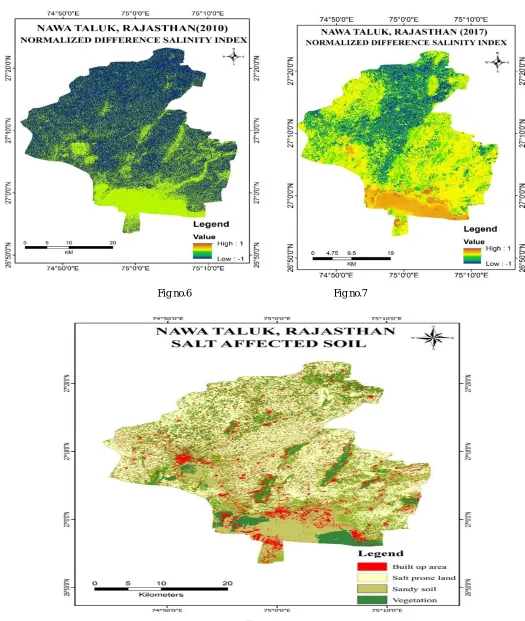
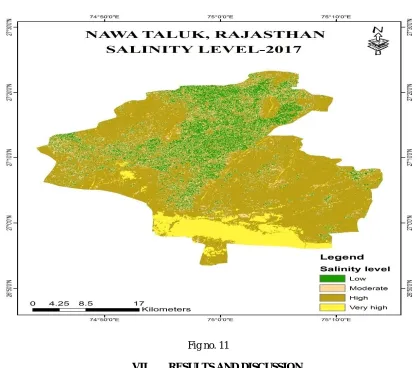
C. Changes In Salinity Level
898
[image:7.612.44.569.87.708.2]©IJRASET (UGC Approved Journal): All Rights are Reserved
Fig no.6 Fig no.7
899
©IJRASET (UGC Approved Journal): All Rights are Reserved
Source: ISRIC websiteFig no.9
900
[image:9.612.98.515.79.447.2]©IJRASET (UGC Approved Journal): All Rights are Reserved
Fig no. 11VII. RESULTS AND DISCUSSION
According to Queensland Government natural resources and water standard of salinity measurement, electronic conductivity value of 1.5 to 2.0 µm/m is slightly saline, 2.0 to 6.0 µm/m is moderately saline, 6.0 to 15.0 µm/m is highly saline soil. The electronic conductivity value of the study area is ranging from 1.5 µm/m to 9.1 µm/m which indicate the salinity level of the study area is ranging from slightly saline to highly saline soil. The northern portion of the study area observed to be slightly saline soil, value ranging from 1.5 to 3.0 µm/m. These areas are mainly vegetation areas and of a less high moisture content which is matched with the salinity value of satellite data in terms of NDSI. In the southern portion of the study area are mainly water bodies, sandy soil are observed to be highly saline area in terms of NDSI which is also observed to be high in electronic conductivity method and the value ranges from 7.7µm/mto 9.1µm/m where moisture content is also very low. Some parts of the eastern, south eastern and western side are observed to be moderately saline. According to ISRIC data of salinity the western side of the Nawa Taluk, salinity level is moderate to low which also matched with satellite data. In these areas due to the presence of vegetation the temperature which directly affecting the soil, are not effect able to effect directly because of the presence of vegetation. Thus it hinders the evaporation rates in the soil in those areas. The southern side of the study areas, according to ISRIC data of soil salinity found to be high to very high salinity level, these areas are mainly water bodies and exposed soil which leads to high evaporation rate and it increases the soil salinity. Some parts of the northeastern of new taluk found to be high to very high salinity level, which is moderate to high in satellite data of salinity in terms of NDSI. Some parts of the eastern side found to be high to very high salinity which is same as satellite data in terms of NDSI value. The salinity level is higher in those areas which are mainly built up and waterbodies. Whereas the salinity values found to be low to very low are the areas covered with vegetation. Some areas of agricultural land found to be moderate to low salinity level.
901
©IJRASET (UGC Approved Journal): All Rights are Reserved
increases the evaporation which also leads to increase salinity. Moisture also affects the soil salinity. Those areas of high moisture in soil are having low salinity level, whereas those areas of low moisture content in the soil are highly saline soil. Built up areas are also shown moderate to the high saline soil because built up surrounding areas are mainly open or exposed soil which directly affects the soil evaporation rate, which leads to increase soil salinity.
VIII. CONCLUSION
The vegetation coverage of Nawa Taluk is decreasing from the year of 2010 to 2017. It is mainly due to the saline soil of the present study area, also the temperature and other climatic factors. Remote sensing and GIS techniques are now used for various research purpose and nowadays remote sensing and GIS are very useful tools for any types of research. In the present study, remote sensing and GIS are used to get the result. Using various satellite imagery of different sensor and their different bands are used to assess the salinity level in any region. Depending on the various mathematic calculation of various remote sensing data it is easy to delineate salinity affected areas. Using Remote sensing and GIS technology in the present study area, soil salinity level in the soil has been derived which is same as real data.
REFERENCES
[1] Birth GS, Mcvey G (1968). Measuring the colour of Growing Turf with a Reflectance Spectrometer. Agron. J., 60: 640-643
[2] Agassi,M., Shainberg,I. and Morin, J. (1981). Effect of electrolyte concentration and soil sodicity on infiltration rate and crust formation Soil Science Society of America Journal 45, 848-851
[3] Nulsen, R. A., and Baxter, I. N. 1986. Water use by some crops and pastures in the southern agricultural areas of Western Australia. Technical report No. 32. Division of Resource Management, Western Australian Department of Agriculture
[4] CAZRI (1990). Report on Land use/land cover, Churu taluk, Rajasthan, CAZRI, Jodhpur, 26
[5] Dwivedi RS (1992). Monitoring and the study of effects of image scale on the delineation of salt affected soils in the Indo-Gangetic plains. Int. J. Remote Sens., 13: 1527–1536
[6] Chen L and Qu Y, (1992). Water and land resources and their rational utilisation and development in the Hexi region, Science Press, Beijing, 143–176 [7] Agassi, M, Bloem, D. and Ben-Hur, M. (1994) Effect of drop energy and soil and water chemistry on infiltration and erosion. Water Resources Research 30,
1187-1193
[8] Williamson, D. R., Gates, G. W. B., Robinson, G., Linke, G. K., Seker, M. P., and Evans, W. R. 1997. Salt trends. Historic trend in salt concentration and saltload of stream flow in the Murray-Darling drainage division. Dryland technical report No. 1, 64 pp. Canberra: Murray-Darling Basin Commission
[9] MDBMC. 1999. The salinity audit of the Murray- Darling Basin – a 100 year perspective. Canberra: Murray-Darling Basin Ministerial Counci
[10] Basso F., Bove E., Dumontet S., Ferrara A., Pisante M., Quaranta G. and Taberner M., (2000). Evaluating environmental sensitivity at the basin scale through the use of geographi information systems and remotely sensed data: an example covering the Agri basin (Southern Italy), Catena. 40, 19- 35.
[11] White, R. E., Helyar, K. R., Ridley, A. M., Chen, D., Heng, L. K., Evans, J., Fisher, R., Hirth, J. R., Mele, P. M., Morrison, G. R., Cresswell, H. P., Paydar, Z., Dunin, F. X., Dove, H., and Simpson, R. J. 2000. Soil factors affecting the sustainability and productivity of perennial and annual pastures inthe high rainfall zone of south-eastern Australia.Australian Journal of Experimental Agriculture 40:267–283
[12] Campbell, N., George, R., Hatton, T., McFarlane, T., Pannell, D., Van Bueren, M., Caccetta, P., Clarke,C., Evans, F., Ferdowsian, R., and Hodgson, G. 2000. Using natural resource inventory data to improve the management of dryland salinity in the Great Southern, Western Australia. Implementation Project 2, Theme 2, Dryland Salinity. Canberra: National Land and Water Resources Audit
[13] Mitchell, M. L., Koen, T. B., Johnston, W. H., and Waterhouse, D. B. 2001. LIGULE: An evaluation of indigenous perennial grasses for dryland salinity management in south-eastern Australia. 2. Field performance and selection of promising ecotypes. Australian Journal of Agricultural Research 52:351–365. [14] NLWRA. 2001. Australian dryland salinity assessment 2000. Canberra: National Land and Water Resources Audit
[15] Ridley, A. M., Christy, B., Dunin, F. X., Haines, P. J., Wilson, K. F., and the late A. Ellington. 2001. Lucerne in crop rotations on the Riverine Plains. 1. The soil water balance. Australian Journal of Agricultural Research 52:263–277
[16] Wang D., Poss J. A., Donovan T. J., Shannon M. C. and Lesch S. M., (2002). Biophysical properties and biomass production of elephant grass under saline conditions, Jour. Arid Environ. 52, 447–456.
[17] Nuberg, I. K., Mylius, S. J., Edwards, J. M., and Davey, C. 2002. Windbreak research in a South Australian cropping system. Australian Journal of Experimental Agriculture 42:781–795
[18] Ward, P., Dolling, P., and Dunin, F. 2003. The impact of a lucerne phase in a crop rotation on groundwater recharge in south-west Australia. Proc. 11th Australian Agronomy Conference, 2–6 February 2003, Geelong, Victoria.
[19] Buces FN, Siebea C, Cramb S, Palaciob JL (2005). Mapping soil salinity using a combined spectral response index for bare soil and vegetation: A case study in the former lake Texcoco, Mexico. J. Arid Environ., 65: 644- 667
[20] Dawelbait M. and Morari F., (2012). Monitoring desertification in a Savannah region in Sudan using Landsat images and spectral mixture analysis, Jour. Arid Environ. 80, 45-55
[21] P. Koohafkan,( 2012 ) “Water and Cereals in Drylands,” The Food and Agriculture Organization of the United Nations and Earthscan, Rome
[22] S. Teggi, et al., “SPOT 5 Imagery for Soil Salinity Assessment in Iraq,” Proceedings of SPIE—Earth Resources and Environmental Remote Sensing/GIS Applications III, Vol. 8538, 2012, pp. 85380V-85380V-12.