0095-1137/09/$08.00⫹0 doi:10.1128/JCM.01693-08
Copyright © 2009, American Society for Microbiology. All Rights Reserved.
Comparison of Probe Hybridization Array Typing to Multilocus
Sequence Typing for Pathogenic
Escherichia coli
䌤
Sara E. McNamara,
1‡ Usha Srinivasan,
1Lixin Zhang,
1Thomas S. Whittam,
2†
Carl F. Marrs,
1and Betsy Foxman
1*
Department of Epidemiology, University of Michigan School of Public Health, Ann Arbor, Michigan 48109,1and
Microbial Evolution Laboratory, National Food Safety and Toxicology Center, Michigan State University, East Lansing, Michigan 488242
Received 2 September 2008/Returned for modification 10 October 2008/Accepted 29 December 2008
Probe hybridization array typing (PHAT) is a previously validated, high-throughput, highly discriminatory binary typing method based on the presence or absence of genetic material. To increase the utility of PHAT,
we identified a refined PHAT probe set using 24 known and potentialEscherichia colivirulence genes, by which
groups similar to multilocus sequence typing (MLST) clonal groups (CGs) could be determined. We PHAT
typed 1,132E. coliisolates, representing at least 62 MLST CGs and diverse disease states, using a
“library-on-a-slide” microarray format. Using 24 PHAT probes, all 62 MLST CGs in the representativeE. colicollection
were distinguished. For major CGs, PHAT correctly classified all sequence types within CG7 and CG17 but misclassified between one and four sequence types for CG13, CG14, CG23, CG38, and CG58, giving an overall sensitivity and specificity of 80.4 and 98.7%, respectively. After application of the PHAT classification to the whole collection, MLST validation of the PHAT probe classification resulted in sensitivities from 0.0 to 100.0% and specificities from 75.0 to 100.0% for individual CGs and an overall sensitivity and specificity of 64.7 and 88.3%, respectively. The refined PHAT probe set is capable of classifying isolates into groups in a manner similar to major clonal complexes of MLST, indicating coevolution between the chromosomal background and the flexible gene pool. Further refinement is needed to distinguish between closely related groups. For analysis of large bacterial collections, PHAT is a relatively time- and cost-efficient method and is ideal for a first level of analysis.
Designing a research study to examine the molecular char-acteristics of bacteria takes careful consideration of many fac-tors, including the collection of isolates, the methods of anal-ysis and, ultimately, the cost. The design is even more critical for studies based on large collections of isolates, since all time and cost requirements are magnified. Selecting a typing system is likely to be one of the most important decisions, since the method chosen will impact the cost, personnel needed, type of analysis, time to results, and the assumptions that can be made based on the typing results.
Because it is based on sequence and thus is both portable and unambiguous, many consider multilocus sequence typing (MLST), which is based on variation in housekeeping loci in the genome, the ideal typing method. MLST is highly discrim-inatory for establishing long-term patterns of evolution (9). However, MLST does not provide much insight into recent genetic history, such as acquisition of mobile genetic elements. For example, alleles of the highly clonal food-borne pathogen
Escherichia coliO157:H7, which causes bloody diarrhea and hemolytic-uremic syndrome, share nearly identical (⬎99.9%) nucleotide sequences among different isolates (12). In this
case, MLST cannot differentiateE. coliO157:H7 isolates from each other, making it less useful for pathogen tracking and outbreak investigations.
In addition, MLST analysis can be quite daunting, especially for a large collection of isolates. For example, a study involving typing of 1,000E. coliisolates results in 14,000 DNA sequences that must be visually examined for base-calling errors, com-pensated for reference sequence additions or deletions, trimmed to the appropriate length, and finally analyzed for the correct allele numbers. Therefore, the analysis for MLST re-quires significant personnel time and laboratory resources be-yond the base cost of DNA isolation, PCR, and sequencing.
Probe hybridization array typing (PHAT) is an alternative typing method complementary to MLST. PHAT is a highly discriminatory method that determines relatedness of strains by using a binary system based on results of DNA dot blot hybridization for the presence or absence of genetic material (13). Strains that share diverse regions of genetic content are more likely to be related than strains that do not. By using gene probes that reflect genetic variation, PHAT provides insight into a more recent genetic history of a strain than that found using MLST. PHAT is ideal for use with large isolate collec-tions since it can be easily adapted to a high-throughput “li-brary-on-a-slide” (LOS) microarray format (20). LOS is capa-ble of testing up to 1,200 isolates in duplicate in a single experiment. In addition, the binary output of PHAT typing is easily digitally formatted for large databases, making data analysis of PHAT more time-efficient than for MLST. While using MLST on 1,000 isolates can be daunting, if they can be
* Corresponding author. Mailing address: Department of Epidemi-ology, University of Michigan, 109 Observatory St., Ann Arbor, MI 48109. Phone: (734) 764-5487. Fax: (734) 764-3192. E-mail: bfoxman @umich.edu.
† Deceased.
‡ Present address: Michigan Department of Community Health, Lansing, MI 48909.
䌤Published ahead of print on 14 January 2009.
596
on May 16, 2020 by guest
http://jcm.asm.org/
grouped first using PHAT, only a subset need be typed by MLST.
The previously published set of PHAT probes was a proof of concept requiring further refinement (13). First, the probes included in the initially published set were validated using uropathogenic and rectal isolates of E. coli. Therefore, the discriminatory power of PHAT for other pathotypes was not tested. Second, all probes were gene fragments from subtrac-tion PCR experiments with rectal isolates, many without clearly defined genetic functions or relationships to virulence. Lastly, the PHAT types could not be mapped to MLST types, and thus direct comparisons between PHAT and MLST could not be made.
Here we describe a refinement of the PHAT probe set in-tended to classifyE. coliisolates into groupings corresponding to MLST clonal groups (CGs). Probes were selected from genes with known and unknown functions related to virulence potential. The probe set was developed and validated by using a diverse collection ofE. coli isolates, including strains that cause diarrhea, urinary tract infections (UTIs), and meningitis and commensal vaginal and rectal isolates and thus should be generalizable to isolates from these groups.
MATERIALS AND METHODS
Bacterial collections and culture conditions.We usedE. coliisolates from five different bacterial collections to develop and validate our refined PHAT probe set. The first collection containsE. coliandShigellasp. isolates from Thomas Whittam’s collection (National Food Safety and Toxicology Center, Michigan State University) representing all major known clonal complexes based on MLST type (n⫽255). The collection is primarily from human and animal isolates causing diarrhea but also includes isolates that cause UTIs and meningitis from clinical specimens of stool, urine, and blood. We also include three collections from Betsy Foxman from three sources: (i) rectal, i.e., commensalE. coliisolates obtained from rectal swab specimens from healthy women and men aged 18 to 39 (n⫽661); (ii) cystitis, i.e., uropathogenicE. coliisolates from urine from women aged 18 to 39 with lower UTI (n⫽42); and (iii) vaginal, i.e., isolates obtained from vaginal swabs from women aged 18 to 39 with UTI (n⫽24) or without UTI (n⫽7). All isolates were collected over a 3-year period (1996 to 1999) from the same underlying population (6). The final collection isE. coli
pyelonephritis isolates from adults (Harry Mobley, University of Michigan) and children (Patricia Brown, Detroit Medical Center) (n⫽143) clinically diagnosed with pyelonephritis. Isolates were obtained from both urine and blood speci-mens. AllE. coli isolates were grown in Luria-Bertani broth (Difco/Becton Dickinson, Franklin Lakes, NJ) overnight at 37°C for subsequent DNA isolation.
Selection and creation of PHAT probes.To determine the PHAT probe set, we used three sets of previously described genes and an additional new set of genes. The first set of genes includes the previously described geneschuA,yjaA, and tspE4.C2 (1). These genes categorizeE. coliisolates into one of the four main ECOR phylogenetic groups: A, B1, B2, or D. If an isolate was positive for the presence ofchuA andyjaA, then the isolate is categorized as belonging to phylogenetic group B2. If an isolate was positive forchuAbut negative foryjaA, then the isolate is categorized as group D. An isolate that was negative forchuA
and positive for tspE4.C2, would be categorized as group B1, and an isolate that was negative for bothchuAand tspE4.C2 would belong to group A.
The second set of genes includes the previously described genesstx1,stx2,eae,
bfp,lt,virF,ipaH, andaafII(15). These genes help to categorizeE. coliisolates into one of six diarrheagenic pathotypes: enterotoxigenicE. coli(ETEC), entero-pathogenic E. coli (EPEC), Shiga-toxin producing E. coli (STEC), entero-hemorrhagicE. coli(EHEC), enteroinvasiveE. coli, or enteroaggregativeE. coli.
E. coliisolates that are positive for the presence of Shiga toxin-producing genes,
stx1orstx2, are categorized as STEC. If these isolates are also positive for the presence of the intimin gene,eae, they are categorized as EHEC.E. coliisolates that are negative forstx1andstx2and are positive foreaeare categorized as EPEC. EPEC isolates that are positive for the bundle-forming pili gene,bfp, are considered typical EPEC, while isolates that are negative are considered atypical EPEC. Isolates positive for the labile toxin gene,lt, are categorized as entero-toxigenicE. coli, while isolates positive for the aggregative adherence fimbria II
gene,aafII, are considered enteroaggregativeE. coli. Isolates that are positive for
ipaHandvirF, an invasion plasmid antigen and a transcriptional activator of a virulence loci, respectively, are considered to be enteroinvasiveE. coli.
The third set of genes includes the previously described genesiroN,ompT,hly,
kpsMT, andaer(5, 8, 10). These genes represent virulence factors that have been associated withE. colithat cause UTIs (uropathogenicE. coli).
The fourth set of genes consists of genes that were identified by in silico comparison of the sequenced strainsE. coliCFT073 andShigella flexneri2457T toE. coliMG1655 using GenomeComp (17) and BLAST2 (National Center for Biotechnology Information [NCBI] database, National Institutes of Health [www .ncbi.nlm.nih.gov]) software (L. Zhang, unpublished data). Ideal genes were considered ones present in ca. 40 to 60% of the sequenced strains ofE. coliand
Shigellasp. in the NCBI database and have a potential virulence function. Genes selected for PHAT probes from the genome ofE. coliCFT073 included c0286, c0311, c0340, c1164, c1600, c3389, and c3680 (named after the gene locus tag for
E. coliCFT073 in the NCBI database). The gene that was selected to make into a PHAT probe from theS. flexneri2457T genome included S3187 (named after the gene locus tag forS. flexneri2457T in the NCBI database).
We redesigned the primers used for each gene (except the genes associated with UTI in set 3) to give product lengths that would optimize the LOS hybrid-ization procedure using Primer Select Lasergene software (DNAstar, Inc., Mad-ison, WI). The Primer sequences, product lengths, and annealing temperatures for each gene probe are shown in Table 1. Each PCR tube contained 50 ng of purified DNA template, 100 pmol of each primer, and Platinum PCR Supermix (Invitrogen, Carlsbad, CA), resulting in a total volume of 50l. PCR amplifi-cation was performed by using the PTC-100 programmable thermal cycler (MJ Research, Waltham, MA). PCR conditions used were as follows: soaking time of 2 min at 94°C, followed by 30 cycles of denaturing at 94°C for 30 s, annealing at the temperatures given in Table 1 for 30 s, and extension at 72°C for 2 min. This was followed by a final extension at 72°C for 5 min. PCR products were then purified by gel electrophoresis using a 1% agarose gel. Gels were then stained with ethidium bromide for visualization of DNA bands. Bands were excised from the gel and purified by using a QIAquick gel extraction kit (Qiagen, Inc., Va-lencia, CA). PCR amplification was performed a second time using the same procedure except using purified PCR product as template DNA. The resulting PCR products were then purified by using a QIAquick PCR purification kit (Qiagen). Probes were labeled with fluorescein-12-dCTP (Perkin-Elmer, Wal-tham, MA) by using a BioPrime labeling kit (Invitrogen). A DNA quantification probe was created using the seven MLST genes:aspC,clpX,fadD,icdA,mdh,
lysP, anduidA. PCR amplification of the MLST genes was performed by using the MLST protocols described below and using DNA fromE. coliCFT073 as the template. PCR products from all seven genes were pooled and labeled with digoxigen-11-dUTP (Enzo Life Sciences, Inc., Farmingdale, NY) using a BioPrime labeling kit (Invitrogen). All probes were tested with positive (tem-plate strain and purified probe) and negative (water) controls on nylon mem-branes (Hybond H⫹; Amersham Pharmacia, Buckinghamshire, United King-dom) using the LOS hybridization procedure below to ensure the probes would hybridize as expected before use.
Microarray LOS arraying and hybridization.AnE. colimicroarray was cre-ated using 1,200 isolates and controls as described above. Genomic DNA was isolated by using a high-throughput sonication method as previously described (20). DNA from isolates and controls was arrayed onto Membrane Vivid mi-croarray slides (Pall Life Sciences Corp., Ann Arbor, MI) by using a VersArray ChipWriter compact system (Bio-Rad, Hercules, CA) and the Virtek microarray (Virtek Vision Corp., Waterloo, Ontario, Canada) using protocols previously described (19, 20). All probes were hybridized to slides by using a modified dot blot method as previously described (21). Briefly, the quantification probe was hybridized to microarray slides overnight at 68°C in PerfectHyb Plus hybridiza-tion buffer (Sigma-Aldrich, St. Louis, MO). Slides were washed and the digoxi-gen-labeled quantification probe was detected using anti-digoxigen horseradish peroxidase and an aminoethylcarbasole peroxidase kit (Enzo Life Sciences). The quantification probe was then stripped from the slides using ethanol and washed. The PHAT probes of interest were then hybridized to the slides as before. After a washing step, the fluorescein-labeled PHAT probes were detected by using anti-fluorescein alkaline phosphatase (Roche, Basel, Switzerland) and an alka-line phosphatase kit (ArrayIt; TeleChem, Sunnyvale, CA). The intensity of each spot on the slide for each PHAT probe was normalized to the intensity of the quantification probe, thus accounting for differences in DNA concentration at each spot. The normalized intensities were compared to the intensities for positive and negative controls (sequence strains known to be positive and neg-ative for the probe) to determine the presence or absence of the gene fragment in differentE. colistrains, using previously described protocols (18, 19).
on May 16, 2020 by guest
http://jcm.asm.org/
TABLE 1. Refined set of PHAT gene probes
Gene probe name
Gene function Template strain a Sequence (5 ⬘ –3 ⬘ ) b PCR annealing temp (°C) Amplicon size (bp) Source or reference Primer 1 Primer 2 chuA Outer membrane heme/hemoglobin receptor CFT073 ATCGCGGCGTGCTGGTTCTTGT AGCCAGTTGGTCGGGTTGATAGTC 59 985 1 yjaA Hypothetical protein CFT073 TGAAAGCAAACGTGAAGTGTC TGCTTAAACATTGCCAGGAC 50 324 1 tspE4.C2 Anonymous DNA fragment CFT073 CTTCCCGCTCTCCAGGCAACAT GTGAGACAGAAACGCGGGTA GATA 57 781 1 stx1 Shiga toxin 1 TW07814 AGGGCGTGGAGGATGTCAAGAATA TGCCGGACACATAGAAGGAA ACTC 57 915 15 stx2 Shiga toxin 2 TW07814 GTTCCGGAATGCAAATCAGTCGTC ATTTTTCACCAGTCGCCCACAC 57 946 15 eae Intimin, attaching and ef facing adherence protein TW07892 TTCGCAATGGTAATACTCTGGTTC CCGGTTTGCTTTTCCCTTCC 54 857 15 bfp Bundle-forming pili TW03875 AGAGAAGAACCCTGGAT TCGACCTGAAATGTTGC 45 411 15 lt Heat-labile toxin TW07814 TCGATGATGCTACCCCTGAAAAAC CGCTCCGACCTGACCAAATG 56 975 15 ipaH Invasion plasmid antigen TW06117 TTACCCGAGACGTTAGAAGA CAGAGCGCCGGTATCATTATCG 50 830 15 virF Transcription-al activator of virulence loci TW06117 AAGGTGTTCAATGACGGTTAGC GCATGCGAATATCAAGAAGGA 50 560 15 aafII Aggregative adherence fimbria II TW04393 CCAGGTGCGGCAATCAGAGT TGGCAGGGCAGTATCGTTCAT 54 988 15 c0286 Hypothetical protein CFT073 TTGCTTCCCTGCGATTATTTAGTG CTGCGGTTCTGGCTGTGATGGATT 54 930 This study c0311 Hypothetical protein CFT073 AGTGTTTCTGCCTTTCCTG GACTTCGTACATACCGCTCTG 50 286 This study c0340 Hypothetical protein CFT073 AGGATGTTCTGGAGGAGTGC CAGGGATATGACGAGTTGTTC 54 528 This study c1164 Hypothetical protein ycdT CFT073 TCGGTATTGTTTGTGGGTGGATTT TTGGCCGATGCTGATTGAACTGTC 52 1,024 This study c1600 Putative periplasmic iron binding protein, SitA CFT073 TCGGAAATCGTACTCTCGCTAAA GCTGCAGAAGTCTCATCCATAACC 54 599 This study c3389 Hypothetical protein CFT073 TGCCTGCGGTGGATAACAAC AGAACGCGGAACAAGACTGATTT 55 839 This study c3680 Hypothetical protein CFT073 CGGAAGTGGTCAACGGGCATAC TTCGTCTTCATAGCGCTCTTTACC 54 698 This study S3187 Hypothetical protein 2457T GTGGTCGACCCCGGTTACTTTTT GGATTCATTATTCGGGGTCTATTC 54 488 This study iroN Iron-related siderophore receptor CFT073 AAGTCAAAGCAGGGGTTGCCC GACGCCGACATTAAGACGCAG 65 700 8 ompT Outer membrane protease CFT073 AGCAGTAGTGATGAAGTTAT CGGACATTAGTCTTGGAACT 54 800 5 hly Alpha-hemolysin, lyses red blood cells CFT073 AGATGATGAGCTTCAGGTTC ATCCGACTTGTACTATGTGC 54 1500 5 kpsMT Group II capsule CFT073 GCGCATTTGCTGATACTGTTG CATCCAGACGATAAGCATGAG 52 519 5 aer Aerobactin, aerotaxis receptor CFT073 CGTACAGTATCCCGTGAAGAGTTT AAGGGCATCAGTGAGGGAAG TATT 65 764 5 aAll strains are E. coli except for S. flexneri strain 2457T. bThe primers for the following probes were designed from E. coli CFT073 locus numbers: chuA (c4308), yjaA (c4968), tspE4.C2 (c4836), c0286, c0311, c0340, c1164, c1600, c3386, c3389, and c3680. The primers for the following probes were designed from the S. flexneri 2457T locus number S3187. The primers from the following probes were designed from the indicated GenBank accession numbers: stx1 (J93SLT1), stx2 (X07865), bfp (AB024946, AF119170, EC13FPGNS, U21784), lt (ECLT87, ECOELTBH), eae (AJ298279, AJ308550, AJ308551, AJ308552, M58154, U38618, U66102, Z11541, AB040740, AF025311, AF065628, AF116899, AF200363, AF449418, AF530555, AF530556, AF530557, AJ271407), ipaH (AF386526, AL391753, AF391753, AF348706, M76445, M32063), virF (AY206433, AF386526, AF348706, AL391753, X16661, X58464, M29172), and aafII (AF114828). Template strains identified by the prefix TW are from T. Whittam’s collection (National Food Safety and Toxicology Center, Michigan State University).
on May 16, 2020 by guest
http://jcm.asm.org/
[image:3.585.106.494.70.728.2]MLST.MLST was performed previously on all representativeE. colicollection isolates of T. Whittam. We used the same protocol to perform MLST on selected isolates from the cystitis, pyelonephritis, and vaginal and rectal collections for verification of the cluster analysis. MLST PCR protocols from theEcMLST database (16) webpage (www.shigatox.net/stec/mlst-new/index.html) were fol-lowed using PlatinumTaqDNA polymerase (Invitrogen). PCR products were purified by using a QIAquick PCR purification kit (Qiagen) and then sequenced at the University of Michigan Biology Core facility using primers for both 3⬘and 5⬘directions. DNA sequence chromatograms were visualized and edited by using FinchTV software (Geospiza, Inc., Seattle, WA). A consensus sequence was obtained for each of the seven gene fragments for each isolate by using MegAlign (DNAstar, Inc.). DNA sequences were then compared to theEcMLST database to determine the allele type for each gene. The allele type profiles for each isolate were then used to assign sequence type (ST) and CG designations.
Analytic strategy.Our aim was to identify an optimal PHAT probe set which can maximally classify theE. coliisolates into different phylogenetic groups and compare the groups to classification using MLST. We performed cluster analysis using Cluster v2.11 and subsequently visualized the results by creating dendro-grams with TreeView v1.60 software available at: http://rana.lbl.gov /EisenSoftware.htm (4), initially for classifying the representativeE. coli collec-tion for which MLST data were available. In the cluster analysis, distances between of all pairs of data to be clustered (e.g., all of the CGs in the current data set) were calculated using a Pearson correlation. Cluster uses agglomerative hierarchical processing, which consists of repeated cycles where the two closest remaining items (those with the smallest distance) are joined by a node/branch of a tree, with the length of the branch set to the distance between the joined items. The two joined items are removed from list of items being processed replaced by an item that represents the new branch. The distances between this new item and all other remaining items are computed, and the process is re-peated until only one item remains. The CGs and STs used in the cluster analysis were as follows: CG7 (STs 23, 24, 25, 26, 357, and 378), CG13 (STs 86, 87, 88, and 296), CG14 (STs 104, 106, 110, and 310), CG17 (STs 118, 119, 120, 225, and 255), CG23 (STs 169, 170, 171, 172, 272, 273, 298, and 343), CG38 (STs⫺20,⫺3, 27, 28, 265, 271, 299, 338, and 346), and CG58 (ST 281, 282, 300, 344, and 384). The identified probe set was then used to classify isolates from other collections. As a validation, MLST was performed on a subset of isolates with PHAT signatures that corresponded to major CGs consensus PHAT signatures in the representa-tiveE. colicollection.
RESULTS
All isolates from the five collections—diarrhea, cystitis, pyelonephritis, rectal, and vaginal—were probed using the identified PHAT probe set with LOS. The presence or absence of PHAT probes was determined unequivocally in 1,000 strains; these strains were used for cluster analysis and MLST validation.
Cluster analysis. The distribution of PHAT probes in the
representativeE. colicollection was analyzed to compare the PHAT classification to MLST CGs. The results were imported into TreeView to create a dendrogram (Fig. 1). Here, all 62 CGs in the collection were distinguished as separate branches in the tree. Using any less than the full set of 24 PHAT probes gave results in which not all 62 CGs could be distinguished.
In order to have sufficient power to determine whether PHAT could distinguish between MLST STs within a CG, we limited the analysis to the seven CGs that had five or more isolates (resulting in “major” CGs) in order to have power to distinguish between STs in a given CG. The major CGs used were CG7 (EPEC 4: O119:H6 strains, basal to EPEC 1), CG13 (ETEC P: from pigs, including O157:H43 clone), CG14 (EHEC 2: O26:H11 and O111:H8 and relatives), CG17 (EPEC 2: classical EPEC with H2 antigen), CG23 (ECOR A:E. coli
Reference Collection group A and including atypical EPEC O111:H12), CG38 (UTI 1: uropathogens, including CFT073), and CG58 (“new” designation).
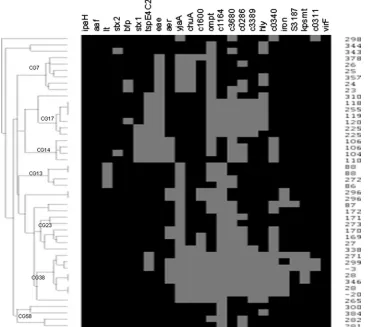
The PHAT probe set distinguished between many of the STs
(Fig. 2) but had trouble distinguishing others, sometimes plac-ing STs from the same CG into different PHAT groups. The sensitivity and specificity of this PHAT probe set for placing STs into the correct MLST CG ranged from excellent to good as follows: CG7 (100.0 and 100.0%), CG13 (66.6 and 95.0%), CG14 (80.0 and 100.0%), CG17 (100.0 and 97.5%), CG23 (50.0 and 94.7%), CG38 (80.0 and 94.4%), and CG58 (80.0 and 100.0%). Overall, the PHAT probe set has a sensitivity and a specificity of 78.3 and 97.5%, respectively, for this subset of strains from the representativeE. colicollection, with the high-est sensitivity and specificity for CG7 and CG17 and somewhat less for the other CGs. Identifying additional probes specific for each CG would improve this classification.
The PHAT probe set also correctly distinguished between isolates of the same ST and CG in 14 cases in the representa-tiveE. coli collection. These cases include the following CGs
FIG. 1. Dendrogram of cluster analysis results for isolates of the representativeE. colicollection (n⫽221). All 62 multilocus ST CGs were distinguished using 24 PHAT probes. CG 0 contains 73 singleton STs.
on May 16, 2020 by guest
http://jcm.asm.org/
and STs: CG0 and STs 10, 212, 227, 292, 304, and 339; CG11 and ST66; CG14 and ST106; CG28 and ST205; CG34 and ST89; CG38 and ST28; CG48 and ST381; CG65 and ST319; and CG67 and ST165. The genes best at differentiating strains within the same ST for a given CG were as follows:hly(seven CGs),ompT(three CGs), c0286 (three CGs),stx1(two CGs),
aer(two CGs),kpsMT(one CG), c0311 (one CG), c1164 (one CG), c3389 (one CG), c3680 (one CG), andstx2(one CG).
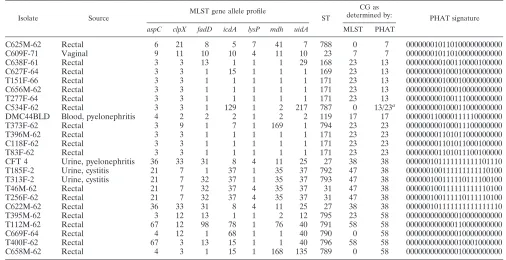
MLST validation.From the cluster analysis of
representa-tiveE. colistrains, we assigned a PHAT type that corresponded to each CG. In order to validate the PHAT assignment to CG, we identified all isolates in the cystitis, pyelonephritis, rectal, and vaginal collections whose PHAT type corresponded to a CG, based on the representative E. coli collection strains tested. From each pool of isolates identified from a specific CG, we randomly selected up to six isolates for MLST, for a total of 24. No isolates were chosen from CG14 (EHEC 2) because there were no isolates in the cystitis, pyelonephritis, rectal, or vaginal collections which matched the PHAT probe signature for this CG. The MLST typing results are shown in Table 2. The overall sensitivity and specificity of PHAT to predict MLST CG is 64.7 and 88.3%, respectively, with the most accurate assignments for CG7 and CG17: CG7 (100.0 and 95.6%), CG13 (0.0 and 75.0%), CG17 (100.0 and 100.0%),
CG23 (40.0 and 92.8%), CG38 (100.0 and 81.8%), and CG58 (100.0 and 86.4%).
DISCUSSION
For large bacterial collections, where time and cost require-ments of MLST may be prohibitive, PHAT is an ideal first level of analysis. Since PHAT is able to identify groups that are equivalent to major CGs of MLST, it provides a picture of the distribution of major groups in the collection, in addition to phylogenetic groupings and virulence signatures. After PHAT typing, investigators can choose selected isolates from each PHAT group to determine the ST and CG, saving the cost of applying MLST to all isolates in the collection.
[image:5.585.111.483.71.398.2]The PHAT probe set can be refined to include a varied set of genes, including potential virulence genes, phylogenetic markers, antibiotic resistance genes, or other genes of interest. Probes can be added to a core set of PHAT probes, so as to better define closely related groups that may need more dis-crimination. For bacteria with very heterogeneous genomes, such asE. coli, the accuracy of assignment to CGs based on PHAT may vary somewhat with study collection, so additional or alternative probes may be required. While the PHAT probe set presented here was created and validated using E. coli FIG. 2. Dendrogram of the STs of the major CGs from the representativeE. colicollection (n⫽46) with PHAT genetic signatures. Gray squares indicate the presence of the gene for a given ST, and black indicates the absence of the gene. All STs in CG7 and CG17 were correctly grouped together, while between one and four STs were misclassified for CG13, CG14, CG23, CG38, and CG58.
on May 16, 2020 by guest
http://jcm.asm.org/
isolates, other probe sets can be created to type other bacterial agents. Any new PHAT probe set, however, would need to be properly validated for the agent of interest. Thus, PHAT is a very adaptable system that can be modified to suit many typing objectives, in a relatively time- and cost-efficient manner.
MLST analysis demonstrated that the refined PHAT probe set is able to correctly resolve most isolates for MLST CGs CG7, CG17, and CG14, with the most discriminatory probes for these CGs beingchuA, yjaA, tspE4.C2, c1164, and c3389. However, PHAT did not resolve all CGs the same as MLST, since classification by PHAT grouped strains of certain CGs together (CG13/CG23 and CG38/CG47), and a majority of CG58 strains were classified into different CGs. Isolates of CG13 and 23 are both phylogenetic group A, while CG38 and CG47 are both group B2. The PHAT probe results have con-siderable overlap for each pair of CGs, suggesting that each pair may be closely related. While four of five CG58 isolates were correctly classified in the cluster analysis, only two vali-dation isolates were typed as CG58 by MLST. Three other validation isolates were typed as CG0 or CG23. However, the PHAT probe set was developed using uropathogenic, diar-rheal, meningitic, and commensalE. coliisolates, but isolates included in the final validation were mostly commensalE. coli
isolates. This may have contributed to lower concordance be-tween PHAT and MLST typing. A more detailed discussion on these results is included below.
In the cluster analysis, PHAT correctly classified all isolates within CG7 (EPEC 4), CG17 (EPEC 2), and all but one isolate of CG14 (EHEC 2). All isolates in CG7, CG14, and CG17 were positive for the geneeae, while all other CGs are negative for this gene. Theeaegene encodes for intimin protein located in the locus of enterocyte effacement. The locus of enterocyte
effacement is responsible for attaching and effacing histopa-thology, a defining feature of the diarrheal disease caused by the pathotypes EPEC and EHEC (11).
The phylogenetic probes chuA, tspE4.C2, and yjaA were useful in differentiating CGs by PHAT. The cluster analysis shows that CG14 and CG17 are related and are both phyloge-netic group B1. This finding is consistent with previous studies (2, 7). CG14 and CG17 are further differentiated by probes c1164 and c3389, which are positive for CG17 and negative for CG14. The gene c1164, also known asycdT, encodes a hypo-thetical inner membrane protein with a predicted diguanlyate cyclase domain. The gene c3389 encodes a hypothetical pro-tein that is similar to the OmpA family of outer membrane proteins. The gene c3389 was also found in most CG38 iso-lates, while being absent in all of the other major CGs. c3389 has been previously associated with group B2 strains and has been found to be absent in strains from phylogenetic groups A and D (3). A better understanding of the function of c1164 and c3389 would help to inform about the differences between these CGs.
[image:6.585.38.544.81.341.2]The refined PHAT probe set is capable of classifying isolates into groups in a manner similar to major clonal complexes of MLST, indicating coevolution between the chromosomal back-ground and the flexible gene pool. While groupings between MLST and PHAT are similar, they do not match exactly, and therefore the results are not directly comparable. However, this is to be expected given that the evolutionary basis for change is different in each method. MLST classifies isolates based on base pair changes in DNA fragments of conserved housekeeping genes. Most changes in these genes are thought to represent a distant genetic history of a given strain, giving rise to a situation where two related strains share a common
TABLE 2. Comparison of CG assignment by MLST and PHAT for selectedE. coliisolates
Isolate Source
MLST gene allele profile
ST
CG as
determined by: PHAT signature
aspC clpX fadD icdA lysP mdh uidA MLST PHAT
C625M-62 Rectal 6 21 8 5 7 41 7 788 0 7 000000010110100000000000
C609F-71 Vaginal 9 11 10 10 4 11 10 23 7 7 000000010110100000000000
C638F-61 Rectal 3 3 13 1 1 1 29 168 23 13 000000000100110000100000
C627F-64 Rectal 3 3 1 15 1 1 1 169 23 13 000000000100010000000000
T151F-66 Rectal 3 3 1 1 1 1 1 171 23 13 000000000100010000000000
C656M-62 Rectal 3 3 1 1 1 1 1 171 23 13 000000000100010000000000
T277F-64 Rectal 3 3 1 1 1 1 1 171 23 13 000000000100111000000000
C534F-62 Rectal 3 3 1 129 1 2 217 787 0 13/23a 000000000100011000000000
DMC44BLD Blood, pyelonephritis 4 2 2 2 1 2 2 119 17 17 000000110000111110000000
T373F-62 Rectal 3 9 1 7 1 169 1 794 23 23 000000000100011100000000
T396M-62 Rectal 3 3 1 1 1 1 1 171 23 23 000000001101011000000000
C118F-62 Rectal 3 3 1 1 1 1 1 171 23 23 000000001101011000100000
T83F-62 Rectal 3 3 1 1 1 1 1 171 23 23 000000001101011100100000
CFT 4 Urine, pyelonephritis 36 33 31 8 4 11 25 27 38 38 000000101111111111101110
T185F-2 Urine, cystitis 21 7 1 37 1 35 37 792 47 38 000000100111111111110100
T313F-2 Urine, cystitis 21 7 32 37 1 35 37 793 47 38 000000100111110111100100
T46M-62 Rectal 21 7 32 37 4 35 37 31 47 38 000000100111111111110100
T256F-62 Rectal 21 7 32 37 4 35 37 31 47 38 000000100111110111110100
C622M-62 Rectal 36 33 31 8 4 11 25 27 38 38 000000101111111111111110
T395M-62 Rectal 3 12 13 1 1 2 12 795 23 58 000000000000010000000000
T112M-62 Rectal 67 12 98 78 1 76 40 791 58 58 000000000000110000000000
C669F-64 Rectal 4 12 1 68 1 1 40 790 0 58 000000000000010000000000
T400F-62 Rectal 67 3 13 15 1 1 40 796 58 58 000000000000010001000000
C658M-62 Rectal 4 3 1 15 1 168 135 789 0 58 000000000000010000000000
a
Using the PHAT probe genetic signatures, this isolate was included in both CG13 and CG23.
on May 16, 2020 by guest
http://jcm.asm.org/
ancestor. PHAT, on the other hand, classifies isolates based on the presence or absence of genes to give a binary signature. Changes in whole gene presence or absence are likely to reflect much more recent genetic history for a given strain, given that these virulence genes tend to be propagated by horizontal gene transfer mechanisms, such as bacteriophages, plasmids, and transposable elements. Therefore, two related strains by PHAT typing do not necessarily share a common ancestor for core genes. Thus, we are comparing two very different evolu-tionary measurement scales, with MLST changes occurring on a slow time scale and PHAT changes which may occur on a faster time scale. Instances where STs share similar lineages (as determined by MLST) but different PHAT signatures are especially interesting to characterize further, since they may represent lineages where acquisition of specific sets of viru-lence genes may result in increased propensity to cause dis-ease.
Although these two typing systems give results that are not directly comparable, they are highly complementary. Many studies are focused on the virulence potential and the clinical implications of particular strains, and the relevance of the MLST gene is likely to occur only through indirect genetic linkages to actual virulence genes (14). PHAT, however, would be an ideal typing system to use to answer these types of questions since any potential virulence gene could be a PHAT probe candidate. These candidate genes can then be screened for across the collection relatively quickly to determine whether any relationships between the gene and clinical dis-ease exist, which may help to determine whether further study is warranted. One caveat is that discriminatory power of a specific PHAT probe may vary by study collection. As the PHAT probe set is further developed and refined by applying to large sets of isolates from various diseases, it will be possi-ble, and of practical importance, to establish an all-round array for PHAT.
ACKNOWLEDGMENTS
This study was supported in part by National Institutes of Health/ Alliance for the Prudent Use of Antibiotics.
We thank Harry Mobley and Patricia Brown for providing some of theE. coliisolates for the present study and Hardik Doshi for help with the LOS hybridizations.
REFERENCES
1.Clermont, O., S. Bonacorsi, and E. Bingen.2002. Rapid and simple deter-mination ofEscherichia coliphylogenetic group. Appl. Environ. Microbiol.
66:4555–4558.
2.Donnenberg, M. S., and T. S. Whittam.2001. Pathogenesis and evolution of virulence in enteropathogenic and enterohemorrhagic Escherichia coli. J. Clin. Investig.107:539–548.
3.Durant, L., A. Metais, C. Soulama-Mouze, J. M. Genevard, X. Nassif, and S. Eschaich.2007. Identification of candidate for a subunit vaccine against extraintestinal pathogenicEscherichia coli. Infect. Immun.17:1916–1925.
4.Eisen, M. B., P. T. Spellman, P. O. Brown, and D. Botstein.1998. Cluster analysis and display of genome-wide expression patterns. Proc. Natl. Acad. Sci. USA95:14863–14868.
5.Foxman, B., L. Zhang, K. Palin, P. Tallman, and C. F. Marrs.1995. Bacterial virulence characteristics ofEscherichia coliisolates from first-time urinary tract infection. J. Infect. Dis.171:1514–1521.
6.Foxman, B., S. D. Manning, P. Tallman, R. Bauer, L. Zhang, J. S. Koopman, B. Gillespie, J. D. Sobel, and C. F. Marrs.2002. UropathogenicEscherichia coliare more likely than commensalE. colito be shared between hetero-sexual sex partners. Am. J. Epidemiol.156:1133–1140.
7.Girardeau, J. P., A. Dalmasso, Y. Bertin, C. Ducrot, S. Bord, V. Livrelli, C. Vernozy-Rozand, and C. Martin.2005. Association of virulence genotype with phylogenetic background in comparison to different seropathotypes of Shiga toxin-producingEscherichia coliisolates. J. Clin. Microbiol.43:6098– 6107.
8.Johnson, J. R., T. A. Russo, P. I. Tarr, U. Carlino, S. S. Bilge, J. C. Vary, Jr., and A. L. Stell.2000. Molecular epidemiological and phylogenetic associa-tions of two novel putative virulence genes,ihaandiroNE. coliamong
Esch-erichia coliisolates from patients with urosepsis. Infect. Immun.68:3040– 3047.
9.Maiden, M. C., J. A. Bygraves, E. Feil, G. Morelli, J. E. Russell, R. Urwin, Q. Zhang, J. Zhou, K. Zurth, D. A. Caugant, I. M. Feavers, M. Achtman, and B. G. Spratt.1998. Multilocus sequence typing: a portable approach to the identification of clones within populations of pathogenic microorganisms. Proc. Natl. Acad. Sci. USA95:3140–3145.
10.Marrs, C. F., L. Zhang, P. Tallman, S. Manning, P. Somsel, P. Raz, R. Colodner, M. E. Jantunen, A. Siitonen, H. Saxen, and B. Foxman.2002. Variations in 10 putative uropathogen virulence genes among urinary, faecal, and peri-urethralEscherichia coli. J. Med. Microbiol.51:138–142. 11.Nataro, J. P., and J. B. Kaper.1998. DiarrheagenicEscherichia coli. Clin.
Microbiol. Rev.11:142–201.
12.Noller, A. C., M. C. McEllistrem, O. C. Stine, J. G. Morris, Jr., D. J. Boxrud, B. Dixon, and L. H. Harrison.2003. Multilocus sequence typing reveals a lack of diversity amongEscherichia coliO157:H7 isolates that are distinct by pulsed-field gel electrophoresis. J. Clin. Microbiol.41:675–679.
13.Srinivasan, U., L. Zhang, A. M. France, D. Ghosh, W. Shalaby, J. Xie, C. F. Marrs, and B. Foxman.2007. Probe hybridization array typing: a binary typing method forEscherichia coli. J. Clin. Microbiol.45:206–214. 14.Turner, K. M. E., and E. J. Feil.2007. The secret life of the multilocus
sequence type. Int. J. Antimicrob. Agents29:129–135.
15.Vidal, M., E. Kruger, C. Duran, R. Lagos, M. Levine, V. Prado, C. Toro, and R. Vidal.2005. Single multiplex PCR assay to identify simultaneously the six categories of diarrheagenicEscherichia coliassociated with enteric infec-tions. J. Clin. Microbiol.43:5362–5365.
16.Wiehong, Q., D. W. Lacher, A. C. Bumbaugh, K. E. Hyma, L. M. Ouellette, T. M. Large, C. L. Tarr, and T. S. Whittam.2004.EcMLST: an online database for multi locus sequence typing of pathogenicEscherichia coli, abstr., p.520–521. Abstr. Proc. 2004 IEEE Comput. Systems Bioinformatics Conf. IEEE Computer Society, Stanford, CA.
17.Yang, J., J. Wang, Z. J. Yao, Q. Jin, Y. Shen, and R. Chen.2003. Genome-Comp: a visualization tool for microbial genome comparison. J. Microbiol. Methods54:423–426.
18.Zhang, L., B. W. Gillespie, C. F. Marrs, and B. Foxman.2001. Optimization of fluorescent-based phosphor imaging dot blot DNA hybridization assay to assessEscherichia colivirulence gene profiles. J. Clin. Microbiol. Methods
44:225–233.
19.Zhang, L., U. Srinivasan, C. F. Marrs, D. Ghosh, J. R. Gilsdorf, and B. Foxman.2004. Library on a slide for bacterial comparative genomics. BMC Microbiol.4:12.
20.Zhang, L., B. Foxman, J. R. Gilsdorf, and C. F. Marrs.2005. Bacterial genomic DNA isolation using sonication for microarray analysis. Bio-Techniques39:640–644.
21.Zhang, L., U. Reddi, U. Srinivasan, S. Li, S. M. Borschardt, P. Pillai, P. Mehta, A. N. Styka, J. DeBusscher, C. F. Marrs, and B. Foxman.2008. Combining microarray technology and molecular epidemiology to identify genes associated with invasive group BStreptococcus. Interdisc. Persp. Infect. Dis. doi:10.1155/2008/314762.