6
I
January 2018
A Fast Method for Haze Evacuation in Remote
Sensing Images by Using Gaussian Filter
M. Vasudeva Reddy1
1
Research Scholar Rayalaseema University, Kurnool-518007
Abstract: The perceivability of the open air images is degraded on account of terrible climate conditions. Robust solutions to this issue, a simple and novel strategy to take out the haze from satellite remote sensing images using Gaussian filter. The task is challenging due to variations in dark channel prior, air light, transmission map and radiance map. The nearness of haze in the atmosphere degrades the quality of images captured by visible camera sensors. The expulsion of haze is commonly performed under the statistical strategies. Due to haziness, an image generally lost shading and edges. So de hazing strategy restores edge losses and shading impacts seriously. The strategy plays out a per-pixel operation, which is direct to create develop and then apply the Gaussian filter to improve the image quality. Exploratory outcomes show that the proposed strategy can permit a quick execution, it is viable for visual engaging and shading loyalty contrasted with some state-of-the-art methods.
Keywords: multi scale fusion, Gaussian filter, PSNR, MSE and Normalized Cross Correlation.
I. INTRODUCTION
Haze is an irritating variable when it appears in the image since it causes poor perceivability. This is the real issue utilized as a part of different fields including agriculture, forestry, metrology, and military. Be that as it may, boundless utilization of satellite remote sensing images is predicated on superb images. Poor perceivability because of haze is caused by suspended particles in the atmosphere . The approaching light from a scene or thing is scaterred because of this and henceforth it is constrict till it achieves the camera. This debasement will make the image lose complexity and shading rightness. Moreover, the airlight which influence the image relies upon the profundity of the scene. This information is generally utilized for dehazing issues. We likewise receive this intimation to tackle the haze evacuation issue. Image haze evacuation has gotten a developing interest as of late. An ever increasing number of strategies are presented in the previous three years. By the by, dehazing is a testing theme since the haze is subject to the obscure depth data. Frequently, the images of open air scenes are debased by awful climate conditions. In such cases, environmental marvels like haze corrupt altogether the perceivability of the caught scene. Since the airborne is moistened by extra particles, the reflected light is scattered and accordingly, inaccessible objects and parts of the scene are less obvious, which is portrayed by decreased differentiation and blurred colors. Dark channel [2][9] in the neighboring pixels window to appraise the air light and transmission outline by delicate tangling to refine the image. The strategy fundamentally improves the nature of hazy images [1]. Additionally, the strategy creating transmission map can't ensure edge preseving and subsequently sharpness of the image corrupts. Dehazing is very required in consumer photography and PC vision applications. Since numerous PC vision applications are experience the ill effects of low-differentiate scene radiance. For instance there is an issue of haze in submerged images. There are numerous techniques accessible to expel haze from open air image.
II. EXISTING METHOD
A. Multi Scale Fusion
Figure1: Multi-scale fusion Architecture
Get two inputimages from the first input with the recuperating the perceivability for each area of the scene in no less than one of them. In the first input information will be acquired by applying white balancing.Second input will be acquired by applying contrast improvement method. This is processed in per-pixel mold which characterizes the spatial connection of debased zones. As we requires just the critical component of image, we channel the vital highlights by processing the weight maps. It is behind weight outline to protect the locale with great perceivability. There are three weight utilized as a part of this segment.
B. Uminance Weight Map
This weight map is used to gauge the perceivability in every pixel. Allots high an incentive to district with great perceivability and low an incentive to area with low perceivability[12]. One of the easy approach to gauge the perceivability is to discover loss of colorfulness. Since hazy image hve low immersion. Luminance can be figured by averaging the R, G, B channel.
= ( − ) +( − ) +( − ) (1)
k files the inferred inputs. Luminance have a tendency to diminish the worldwide differentiation and colorfulness to beat this impact we go for another weight outline.
C. Chromatic Weight Map
This weight map controls the saturation gain in the outputs. This map is ascertained by finding the separation between saturation value S and most extreme of saturation range for every pixel.
=exp(-(
( ) )
) (2)
default value is 0.3. Here likewise the pixel with low saturation is relegated low value and those with high is appointed high value.
D. Saliency Weight map
This weight delineate the level of presentation as for the area region.This measures assess a specific object emerges from rest of the image. For this map calculation we utilize saliency calculation. The saliency weight at pixel position (x,y) of information Ik is characterized as:
Original Image
Input I1 Input I2
Chromatic Weight map Luminance Weight map Saliency Weight map Chromatic Weight map Luminance Weight map Saliency Weight map
Fusion Fusion
=|| (x)- || (3)
where is the normalpixel of the input . By utilizinga small 5×5 16 [1, 4, 6, 4, 1]separable binomial portionwith the high frequency cut-off value ωHc = π/2.75, is acquired. Finally we normalize the resultant weight maps using:
(x)= ( )
( )(4)
In order to avoid the artifacts presentedby the weight maps we go for multi-scale combination. Combinationis completed by summing the input weighted by guided normalized weight maps.
Apply multi-scale combination [4], using a Laplacian pyramid delegation of input sources mixed alongside Gaussian pyramids of standardized weights to get the haze free image [11]. Apply Unsharp concealing strategy for image dehazing on unique hazy inputimage to acquire the haze free image. Look at the consequences of single image dehazing utilizing multi-scale combination technique with unsharp masking strategy [3] of single image dehazing to demonstrate the productivity of unsharp covering strategy [8].
III. PROPOSED METHOD
In reconnaissance framework, remote detecting systems, and submerged, the image appearance is subject to climatic condition such as haze. Haze arrangement model[10][11] is broadly utilized as a part of PC vision and image processing.
Figiure.2 Block diagram of Proposed Method
This model utilized for the arrangement of image within the sight of awful environmental conditions. Image quality is debased because of the nearness of generous particles in the climate which have noteworthy size between 1-10 μm.
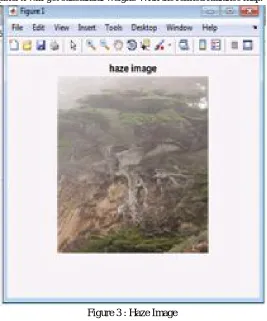
Haze Image
Dark Channel Prior
Air light calculation
Transmission Map Haze Image Radiance Map
Gaussian Filter
Dehaze Image
The light originating from a camera is ingested and scattered by these air particles. Accept that this haze demonstrate is direct model. From the meaning of linearity in this model [6] just pixel position is changed. This intangibility is happened by two basic: Direct attenuation and Air light. Furthermore, it is depict as follow:
I(x) = J(x)*t(x) + A*(1-t(x) (5)
Where I (x) is the observed intensity of the x pixel, J (x) is the scene radiance the genuine nature that we need to recoup), A is the atmospheric light, and t is the transmission medium describing the portion of the light that is not scattered and reaches direct to the camera.
In the condition initially term, J(x)*t(x) is known as the direct attenuation; the second term, A*(1-t(x)) is called air light. This haze display is straightforwardly reached out to each RGB part of a shading image.
A. Dark Channel Prior
Dark channel prior [9] to the haze free open air images, which underpins that a large portion of nearby areas barring the sky have low force in no less than one shading channel. The forces of these dark pixels are principally caused by Shadows, Colorful protests or surfaces and Dark objects or surfaces [2]. Correspondingly, it has been observed that the pixels in hazy areas have high esteems in every single shading channel. The dark channel is characterized as where is a channel of and is a nearby neighborhood focused at. In view of the dark channel earlier, is a steady in a neighborhood image patch. In this manner, we characterize the nearby transmission as and bring the min operation with a neighborhood patch on. It is coarsely great yet contains some block impacts, since the climatic light isn't generally steady in a patch. In other words, a neighborhood patch may contain the locale where the scene depth is intermittent. For maintaining a strategic distance from this issue, evaluated the environmental light utilizing Gaussian filter on the negligible part of the hazy image. It in light of the perception that no less than one shading channel has a few pixels whose intensityvalues are low and near zero. In this it is processed as
J =min ϵΩ( )((1-σ )*μϵ{ , , }(J (y)) (6)
Where J a color channel of J, µ is is a mean and σ is a standard deviation of r, g, b intensity values and Ω(x) is a nearby patch focused at x.We consider top 1% pixels in registering airlight and discover the pixel which has most extreme estimation of J in its dull channel among the pixels in light of equation(6). The estimation of I at that pixel is considered as airlight.
B. Estimation Of Atmospheric Light
By and large, the atmospheric light[7] is constantly considered as the brightest intensity in the whole image on the grounds that a lot of haze makes the object scene brighter than itself. The fundamental thought of this technique is that atmospheric light ought to be assessed from the locale with brighter intensity [6] and less surface. atmospheric light is assessed as the value that has minimal separation to the unadulterated white. Pad Array comprises of zeros. It depends on Padsize, is a vector of nonnegative numbers that indicates both the amount of padding to add and the measurement along which to include it. The estimation of a component in the vector determines the amount of padding to add. The request of the component in the vector indicates the dimension along which to include the padding. In this work, we choose this technique since it is basic however productive. Nonetheless, it isn't vigorous on the grounds that the evaluated climatic light might be the noise[13]. So we respect the mean estimation of the best 5% brightest values in the chose area as the air light to reject the noise impact viably.
C. Saturation Map
It changes over the Haze image to the equal HSV image [10]. RGB is a 3 image exhibit whose three planes contain the red, green and blue segments for the image. HSV is returned as a 3 picture exhibit whose three planes contain the Hue, Saturation and value parts of the image.
D. Transmission Map and Radiance Map
It is observed that the saturation of shading in a hazy image diminishes with the thickness of haze which thus relies upon depth or separation of the object. In this strategy we consolidate saturation map and airlight to get a more exact transmission map clearer image [5]. The transmission outline is figured by utilizing
t=1-f(S)( ( ))((1- )* { , , }( ( )
Where f(s) reliesuponthe saturation of the input image at x. It is expressed as
f(S)=0.8-(0.2*S) (8)
where S is saturation of the pixel (0≤S≤1). We outline estimation of the pixels to f(S) to improve the output as we observed lesser saturation in an object that are far away and have more haze. If the saturation is less, f(S) will be progressively and the other way around. This evacuates conflicting shading patches in the yield [13]. We estimate scene radiance as
J(x)= ( )
( ( ), )+ A (9)
Where is a factor to confine the noise level.
E. Gaussian Filter
We utilize a low-pass Gaussian filter to refine the radiance map [14]. Gaussian filter is a nonlinear filter that smooth’s the images. We smooth the radiancemap using a low-pass Gaussian channel, the refined radiance outline V(x) can be expressed as
V(x) = ∑ (|| − ||) (y) (10)
Where is the entirety weight of the neighborhood patch centered at pixel x
= (|| − ||)(11)
[image:6.612.174.441.370.691.2]Here G is a Gaussian function, and the parameter a represents the size of the area used to smooth a pixel. Standard deviation of the Gaussian dissemination, determined as a scalar or 3- component vector of positive values [11]. As per the low-pass Gaussian filter, those pixels close to the focused pixel x will get substantial weight. With the refined radiance map.
Figure 3 : Haze Image
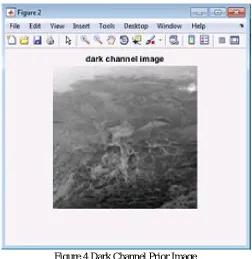
Figure.4 Dark Channel Prior Image
Figure 4demonstrates the dull channels from hazy images as the base an incentive for every one of the channels and every one of the pixels in that patch and create pixels that have values far over zero.
Figure.5 Airlight Image
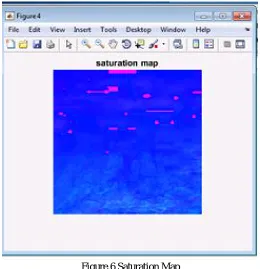
Figure.6 Saturation Map
Figure 6 demonstrates changing over haze image into Hue saturation value..The columns of the input matrix represent intensities of red, green, and blue, individually. The columns of the output matrix represent hue, saturation, and value, respectively.
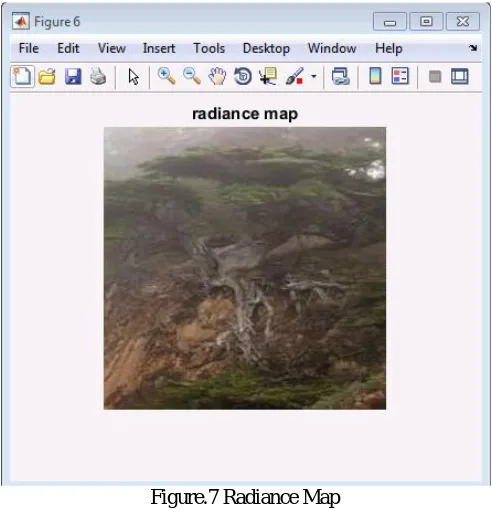
Figure.7 Radiance Map
[image:9.612.178.438.373.604.2]Figure 8 indicates expands the intensity of animage by considering the maximum pixels of airlight, saturation map and transmission map.
Figure.8 Dehaze Image
Figure 9 demonstrates every individual pixel is supplanted with a Gaussian shaped with the same aggregate weight from the first intensity value. It renders little structures undetectable and smoothens sharp edges.
VI. RESULTS AND DISCUSSION
Table 1. Comparison Table
Parameters Multi Scale Fusion Gaussian Filter
Peak Signal-Noise Ratio 43.7677 53.7878
Mean Square Error 0.9787 0.2718
Normalized cross correlation 0.0007 0.0035
From the Table 1, on satellite remote sensing images of different datasets demonstrates that our novel strategy is viable for dehazing. Hence in the overall implementation peak signal-noise-ratio, mean square error and normalized cross correlation is better than multi scale fusion.
VII. CONCLUSION
For some PC vision applications, haze removal algorithm turned out to be more helpful. It was found that most of the existing strategies gradient reversal issue that is no method is exact for various sort of conditions. The issue of over- brightening is anissue for haze from the satellite remote sensing images. We concentrate on an enhanced atmospheric scattering model by considering noise and haze simultaneously. The probability of back likelihood in light of Gaussian filter is assessed by the factual earlier and target supposition of debased image. Meanwhile, we concentrate more on the effectiveness by choosing the transmission map to get the scene radiance. Gaussian filter which can help to achieve the balance between dehazing and denoising. The experimental results demonstrate that our approach is effective, particularly in challenging scenes with both haze and noise. However, color distortion still exists which will be involved in our future work.
VIII.ACKNOWLEDGEMENTS
This paper is dedicated to our Parents, Colleagues and Friends for their help without which the effective fruition of this paper isn't conceivable.
REFERENCES
[1] R. Fattal, “Single image dehazing,” ACM Transactions on Graphics, vol. 27, no. 3, article 72, pp. 1–9, 2008.
[2] T. M. Bui, H. N. Tran, W. Kim, and S. Kim, “Segmenting dark channel prior in single image dehazing,” Electronics Letters, vol. 50, no. 7, pp. 516–518, 2014. [3] C. O. Ancuti and C. Ancuti, “Single image dehazing by multi-scale fusion,” IEEE Transactions on Image Processing, vol. 22, no. 8, pp. 3271–3282, 2013 [4] W. Wang, W. Li, Q. Guan, and M. Qi, “Multi scale single image dehazing based on adaptive wavelet fusion,” Mathematical Problems in Engineering, vol.
2015, Article ID 131082, 14 pages, 2015.
[5] S.-C. Huang, J.-H. Ye, and B.-H. Chen, “An advanced single-image visibility restoration algorithm for real-world hazy scenes,” IEEE Transactions on Industrial Electronics, vol. 62, no. 5, pp. 2962–2972, 2015.
[6] G. Meng, Y. Wang, J. Duan, S. Xiang, and C. Pan, “Efficient image dehazing with boundary constraint and contextual regularization,” in Proceedings of the 14th IEEE International Conference on Computer Vision (ICCV '13), pp. 617–624, IEEE, Sydney, Australia, December 2013.
[7] S.-C. Huang, B.-H. Chen, and W.-J. Wang, “Visibility restoration of single hazy images captured in real-world weather conditions,” IEEE Transactions on Circuits and Systems for Video Technology, vol. 24, no. 10, pp. 1814–1824, 2014.
[8] Q. Zhu, J. Mai, and L. Shao, “A fast single image haze removal algorithm using color attenuation prior,” IEEE Transactions on Image Processing, vol. 24, no. 11, pp. 3522–3533, 2015
[9] D.-Y. Zhang, M.-Y. Ju, and X.-M. Wang, “A fast image haze removal algorithm using dark channel prior,” Acta Electronica Sinica, vol. 43, no. 7, pp. 1437– 1443, 2015.
[10] Q. Zhu, J. Mai, and L. Shao, “A fast single image haze removal algorithm using color attenuation prior,” IEEE Transactions on Image Processing, vol. 24, no. 11, pp. 3522–3533, 2015.
[11] C. T. Thurow, Real-Time Image Dehazing, Technical University, Berlin, Germany, 2011.
[12] W. Ren, S. Liu, H. Zhang, J. Pan, X. Cao, and M.-H. Yang, “Single image dehazing via multi-scale convolutional neural networks,” in ECCV. Springer, 2016, pp. 154–169.
[13] B. Cai, X. Xu, K. Jia, C. Qing, and D. Tao, “Dehazenet: An end-to-end system for single image haze removal,” IEEE TIP, vol. 25, no. 11, pp. 5187–5198, 2016.