University of Huddersfield Repository
Ghori, Muhammad U.
Release kinetics, compaction and electrostatic properties of hydrophilic matrices
Original Citation
Ghori, Muhammad U. (2014) Release kinetics, compaction and electrostatic properties of hydrophilic matrices. Doctoral thesis, University of Huddersfield.
This version is available at http://eprints.hud.ac.uk/id/eprint/24269/
The University Repository is a digital collection of the research output of the University, available on Open Access. Copyright and Moral Rights for the items on this site are retained by the individual author and/or other copyright owners. Users may access full items free of charge; copies of full text items generally can be reproduced, displayed or performed and given to third parties in any format or medium for personal research or study, educational or notforprofit purposes without prior permission or charge, provided:
• The authors, title and full bibliographic details is credited in any copy; • A hyperlink and/or URL is included for the original metadata page; and
• The content is not changed in any way.
For more information, including our policy and submission procedure, please contact the Repository Team at: [email protected].
Release kinetics, compaction and
electrostatic properties of
hydrophilic matrices
Muhammad Usman Ghori
Pharm.D
A thesis submitted in partial fulfilment of the requirements for the degree of
Doctor of Philosophy
The University of Huddersfield
ii
“He who leaveth home in search of knowledge, walk
in the path of God”
iii
Abstract
This thesis illustrates the behaviour of cellulose ethers during powder processing, compaction and drug release, as these are frequently employed in the fabrication of compressed hydrophilic matrices. The handling operations can give rise to the electrification of powder particles, which can affect the end product‘s quality. Controlling the parameters which can dictate the quality of compressed matrices is an ambition inherent in the development of pharmaceutical formulations. Thus, the aims and objectives of this thesis were to firstly study the electrostatic, surface adhesion, dissolution and compaction properties of plain polymers and model drugs. Secondly, binary mixtures of fixed drug to polymer ratios were made in order to investigate the effect of polymer concentration and physico-chemical attributes (particle size, chemistry and viscosity) on the tribo-electric charging, surface adhesion (SA), swelling, erosion, drug release kinetics and compaction properties of model drugs.
It can be discerned that the both drugs charged negatively, whereas the methylcellulose (MC) and hydroxypropyl methylcellulose (HPMC) particles charged positively. The physico-chemical properties associated with MC and HPMC, such as particle size, chemical heterogeneity and molecular size of cellulose ethers all have a significant effect on charging and adhesion behaviour of plain MC and HPMC particles. Moreover, the concentration, particle size, chemical heterogeneity and molecular size of MC/HPMC all significantly affect the charging and SA propensity of the model drugs studied.
The swelling and dissolution results confirm that the extent and rate of swelling, swelling exponent, dissolution rate and drug release kinetic parameters were affected by physico-chemical attributes (concentration, particle size, substitution and viscosity) of MC/HPMC and drug solubility. The mechanism of swelling and drug release was found to be anomalous. However, it inclined towards more diffusion-oriented swelling/drug release with higher MC/HPMC levels, viscosity, Hpo/Meo substitution ratios, drug solubility but smaller MC/MC particle size.
The matrix erosion results obtained from newly developed phenol-sulphuric acid assay (PSA) method confirmed that the solubility of the drug, and levels of HPMC in a particular matrix tablet, significantly affect the matrix erosion rate and the results were similar to those determined using the much more labour-intensive gravimetric method. Moreover, the combination of conventional UV drug analysis technique and PSA assay can be used to simultaneously quantify the matrix erosion, polymer dissolution and drug release kinetics in a single set of experiments avoiding the need for separate studies.
The compaction results confirmed that the FBP has poor compaction as compare to THP. The particle size, substitution ratios and molecular size of MC/HPMC affect the compaction and consolidation behaviour of plain MC/HPMC compacts. Furthermore, it can be noticed that the concentration and physico-chemical attributes (particle size, chemistry and molecular size) of MC/HPMC have a significant influence on the densification and consolidation process of hydrophilic matrices.
iv
Dedication
This thesis is dedicated to my family, especially in the memory of my father, without their
v
Acknowledgments
I would like to express my sincere appreciation to my research supervisor, Prof.
Barbara Conway, for her supervision, guidance, support and freedom in the development of
this project. You have been my mentor, my colleague, friend and a never-ending fount of
moral support. If I do take the academic path, I only hope that I can be half the advisor that
you have been to me. Whatever path I do take, I will be prepared because of you. I sincerely
thank you for making my doctoral degree a wonderful learning experience with not only the
technical content but also the philosophical aspects.
I must also extend my thanks to Dr. Alan Smith, Dr. Enes Šupuk, Dr. Kofi
Asare-Addo and Miss Hayley Markham for their friendship, support and help.
Further my thanks are due towards Dr. Peter Laity (University of Sheffield) who
provided me much needed training on Testometric® and Prof. Liam Grover (University of Birmingham) for his help using the helium pycnometer.
I would also like to thank all my colleagues who work in W1/28 and XG/11 for
creating a friendly working environment, as well as to the technical staff of the School of
Applied Sciences for their laboratory assistance.
I would also like to thank the University of Huddersfield for providing me a
fee-waiver scholarship to pursue doctoral degree at the School of Applied Sciences. I would also
like to thank the University of Huddersfield Graduate Centre for providing me with the much
needed conference presentation funds throughout the duration of my PhD.
To my mother, I thank you for everything you taught me growing up, and for
instilling in me a desire to learn and the belief that hard work pays off no matter how long it
takes.
Finally, I would like to thank my brother and sister for their tremendous support and
vi
Table of Contents
Abstract ... iii
Dedication ... iv
Acknowledgments ... v
Table of Contents ... vi
List of Figures ... xvii
List of Tables ... xxvii
List of abbreviations ... xxxii
Chapter 1: Introduction ... 1
1.1. Cellulose ethers ... 2
1.2. Manufacturing of cellulose ethers ... 4
1.3. Derivatives of cellulose ethers ... 6
1.4.1. Methylcellulose (MC) ... 8
1.4.2. Hypromellose (Hydroxypropyl methylcellulose, HPMC) ... 9
1.4. Pharmaceutical applications of MC and HPMC ... 10
1.5. Profiles of model drugs ... 13
1.5.1. Flurbiprofen ... 13
1.5.2. Theophylline ... 15
1.6. Aims and objectives ... 16
Chapter 2: General experimental ... 19
vii
2.2. Methods ... 21
2.2.1. Preparation of sodium phosphate buffer, pH 7.2 ... 21
2.2.2. Saturated solubility determination of model drugs ... 21
2.2.3. Particle size fractionation and storage of powders ... 22
2.2.4. Characterisation of powders ... 22
2.2.5. Tribo-electrification and powder SA studies ... 24
2.2.6. Swelling and erosion studies ... 27
2.2.7. Dissolution studies ... 31
2.2.8. Development and validation of PSA assay for erosion analysis ... 35
2.2.9. Compaction studies ... 40
Chapter 3: Tribo-electrification and adhesion studies ... 45
3.1. Introduction ... 46
3.2. Tribo-electrification ... 47
3.2.1. Metal-metal contacts... 47
3.2.2. Metal-insulator contacts ... 48
3.2.2.1. Electron transfer in metal-insulator contacts ... 49
3.2.2.2. Ion transfer in metal-insulator contacts ... 51
3.2.2.3. Material transfer in metal-insulator contacts ... 53
3.2.3. Insulator-insulator contacts ... 55
3.3. Powder processing ... 57
viii
3.4.1. Nature and work function of contacting surfaces ... 58
3.4.2. Contact surface roughness ... 60
3.4.3. Contact surface contamination ... 62
3.4.4. Particle size ... 62
3.4.5. Particle shape and roughness ... 65
3.4.6. Material chemistry ... 66
3.4.7. Crystallinity and amorphicity ... 66
3.4.8. Mixing ratios... 67
3.4.9. Mixing speed/frequency of contact ... 68
3.4.10. Atmospheric conditions ... 69
3.5. Applications and hazards of tribo-electric charging ... 71
3.6. Powder mixing ... 73
3.6.1. Random powder mixtures ... 74
3.6.2. Ordered powder mixtures ... 75
3.7. Section A, Tribo-electrification and adhesion studies of model drugs. ... 75
3.7.1. Introduction ... 75
3.7.2. Experimental ... 76
3.7.2.1. Materials ... 76
3.7.2.2. Methods ... 76
3.7.3. Results and discussion ... 77
ix
3.7.3.2. Tribo-electrification and adhesion properties of model drugs ... 78
3.8. Section B, Tribo-electrification and adhesion studies of cellulose ethers ... 81
3.8.1. Introduction ... 82
3.8.2. Experimental ... 82
3.8.2.1. Materials ... 82
3.8.2.2. Methods ... 82
3.8.3. Results and discussion ... 83
3.8.3.1. Surface morphology of MC and HPMC powder particles ... 83
3.8.3.2. Tribo-electrification and adhesion properties of MC and HPMC ... 85
3.8.3.2.1. Effect of Methocel® particle size ... 86
3.8.3.2.2. Effect of Methocel® substitution ... 87
3.8.3.2.3. Effect of Methocel® molecular size (viscosity) ... 88
3.9. Section C, Tribo-electrification and adhesion studies of MC and HPMC based binary mixtures ... 90
3.9.1. Introduction ... 90
3.9.2. Experimental ... 92
3.9.2.1. Materials ... 92
3.9.2.2. Methods ... 92
3.9.3. Results and discussion ... 93
3.9.3.1. Formation of ordered mixtures ... 93
3.9.3.2. Tribo-electrification and adhesion properties of binary mixtures .... 106
x
3.9.3.2.2. Effect of Methocel® particle size ... 110
3.9.3.2.3. Effect of Methocel® substitution ... 113
3.9.3.2.4. Effect of Methocel® molecular size (viscosity) ... 113
3.9.4. Relationship between tribo-electric charging and surface adhesion ... 117
3.10. Summary ... 121
Chapter 4: Swelling, erosion and dissolution studies of hydrophilic matrices ... 122
4.1. Introduction ... 123
4.2. Hydrophilic matrices ... 123
4.3. Cellulose ether based hydrophilic matrices ... 124
4.4. Mechanism of swelling, drug release and matrix erosion ... 125
4.5. Factors affecting swelling, erosion and drug release ... 131
4.5.1. Effect of Methocel® concentration ... 131
4.5.2. Effect of Methocel® particle size ... 133
4.5.3. Effect of Methocel® substitution ... 134
4.5.4. Effect of Methocel® molecular size (viscosity) ... 135
4.5.5. Effect of drug solubility ... 136
4.6. Section A, Compaction of model drugs ... 139
4.6.1. Introduction ... 139
4.6.2. Experimental ... 139
4.6.2.1. Materials ... 139
xi
4.6.3. Results and discussion ... 140
4.7. Section B, Swelling, erosion and dissolution properties of hydrophilic matrices. . 143
4.7.1. Introduction ... 143
4.7.2. Experimental ... 144
4.7.2.1. Materials ... 144
4.7.2.2. Methods ... 145
4.7.3. Results and discussion ... 146
4.7.3.1. Swelling and erosion properties of plain Methocel® matrices ... 146
4.7.3.1.1. Effect of Methocel® particle size ... 147
4.7.3.1.2. Effect of Methocel® substitution ... 147
4.7.3.1.3. Effect of Methocel® molecular size (viscosity) ... 148
4.7.3.2. Mixing efficiency of Methocel® : FBP/THP powders ... 151
4.7.3.3. Swelling, erosion and dissolution studies of FBP/THP matrices ... 152
4.7.3.3.1. Effect of Methocel® concentration ... 152
4.7.3.3.2. Effect of Methocel® particle size ... 160
4.7.3.3.3. Effect of Methocel® substitution ... 167
4.7.3.3.4. Effect of Methocel® molecular size (viscosity) ... 174
4.7.3.3.5. Effect of drug solubility ... 191
4.7.3.4. Inter-relationship between swelling and dissolution rates ... 193
xii
Chapter 5: Development and validation of PSA assay for erosion analysis ... 198
5.1. Introduction ... 199
5.2. Experimental ... 201
5.2.1. Materials ... 201
5.2.2. Methods ... 201
5.3. Results and discussion ... 202
5.3.1. Erosion study of plain MC/HPMC compacts ... 202
5.3.1.1. Effect of Methocel® particle size ... 203
5.3.1.2. Effect of Methocel® substitution ... 205
5.3.1.3. Effect of Methocel® molecular size (viscosity) ... 206
5.3.2. Drug release studies from K4M : FBP/THP matrices ... 207
5.3.3. HPMC dissolution studies ... 210
5.3.4. Matrix tablet erosion studies ... 213
5.3.5. Quantitative relationship between GM and PSA ... 217
5.3.6. Inter-relationship between HPMC erosion and drug release kinetics ... 223
5.4. Summary ... 224
Chapter 6: Compaction studies of hydrophilic matrices ... 226
6.1. Introduction ... 227
6.2. Powder compaction ... 228
6.3. Mechanism of powder compaction ... 229
xiii
6.4.1. Distance attraction forces ... 233
6.4.2. Solid bridges ... 234
6.4.3. Non- freely movable bridges ... 234
6.4.4. Bonding due to movable bridges ... 234
6.4.5 Mechanical interlocking ... 235
6.5. Compaction properties of Methocel® ... 235
6.6. Factors affecting compaction properties of Methocel® ... 236
6.6.1. Effect of particle size ... 236
6.6.2. Effect of substitution ... 237
6.6.3. Effect of molecular size (viscosity) ... 238
6.6.4. Effect of humidity ... 238
6.7. Mathematical models of powder compression ... 241
6.7.1. The Heckel mathematical equation ... 241
6.7.2. The Kawakita mathematical equation ... 244
6.8. Section A, Compaction of model drugs ... 246
6.8.1. Introduction ... 246
6.8.2. Experimental ... 246
6.8.2.1. Materials ... 246
6.8.2.2. Methods ... 246
6.8.3. Results and discussion ... 246
xiv
6.9.1. Introduction ... 254
6.9.2. Experimental ... 255
6.9.2.1. Materials ... 255
6.9.2.2. Methods ... 256
6.9.3. Results and discussion ... 256
6.9.3.1. Compaction properties of plain Methocel® compacts ... 256
6.9.3.1.1. Effect of Methocel® particle size ... 258
6.9.3.1.2. Effect of Methocel® substitution ... 259
6.9.3.1.3. Effect of Methocel® molecular size (viscosity) .. 267
6.9.3.2. Mixing efficiency of Methocel® : FBP/THP powders ... 268
6.9.3.3. Compaction properties of FBP/THP matrices ... 268
6.9.3.3.1. Effect of Methocel® concentration ... 269
6.9.3.3.2. Effect of Methocel® particle size ... 280
6.9.3.3.3. Effect of Methocel® substitution ... 288
6.9.3.3.4. Effect of Methocel® molecular size (viscosity) ... 296
6.9.3.4. Inter-relationship between Pyand b-1 ... 316
6.10. Summary ... 319
Chapter 7: Conclusions and future work ... 320
7.1. Conclusions ... 321
xv
Chapter 8: References ... 326
xvi
List of Figures
Chapter 1
Figure 1.1: Structure of cellulose ... 3
Figure 1.2: Schematic outline of cellulose ether manufacturing process ... 6
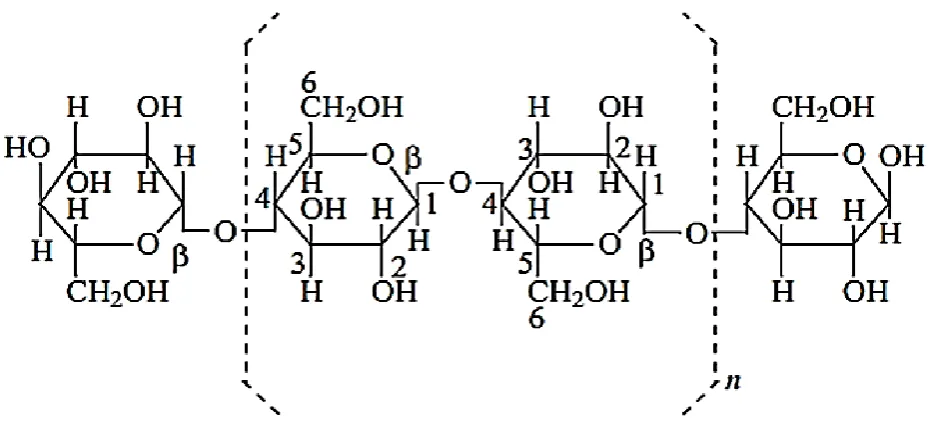
Figure 1.3: Structure of cellulose ethers ... 7
Figure 1.4: Structure of FBP ... 14
Figure 1.5: Structure of THP ... 15
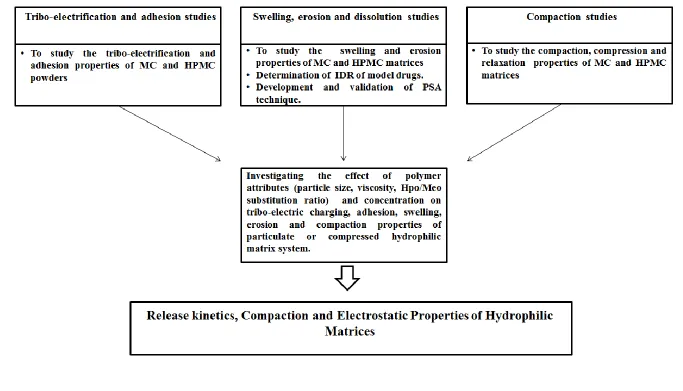
Figure 1.6: Outline of aims and objectives of thesis... 18
Chapter 2 Figure 2.1: Helium pycnometer ... 23
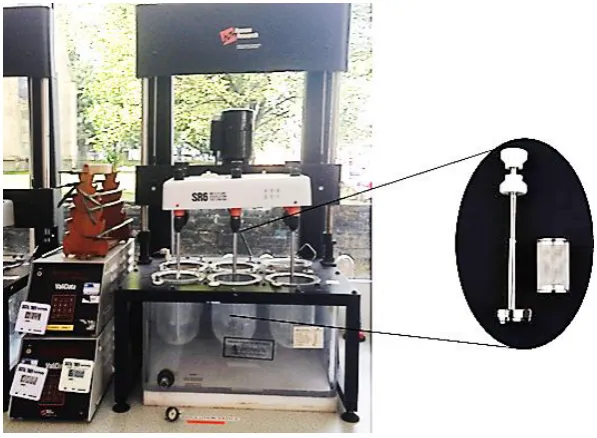
Figure 2.2: Tribo-electric charging measurement set up ... 26
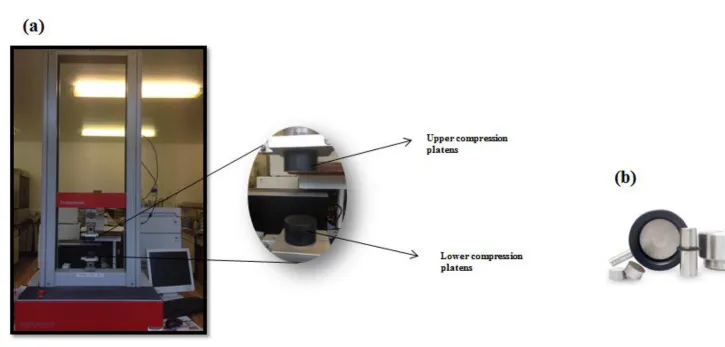
Figure 2.3: (a) Specac® 13.00 mm evacuable die set and (b) Specac® manual hydraulic press. ... 28
Figure 2.4: Swelling experimental set up (a) wire mesh (b) glass petri dish (17 mm × 45
mm) ... 30
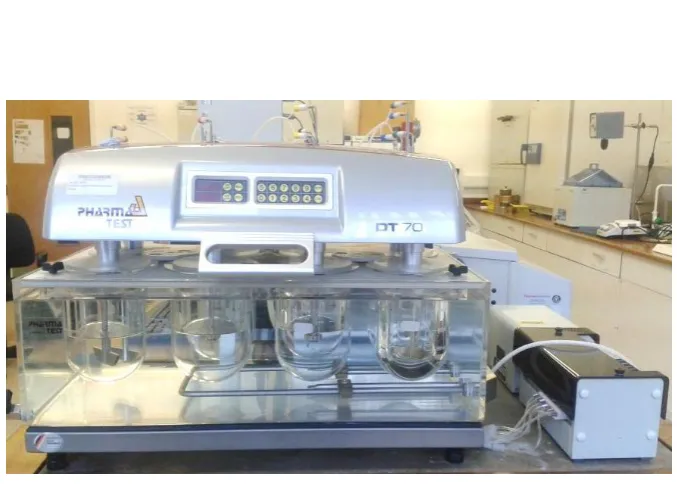
Figure 2.5: Dissolution apparatus used for IDR determination ... 32
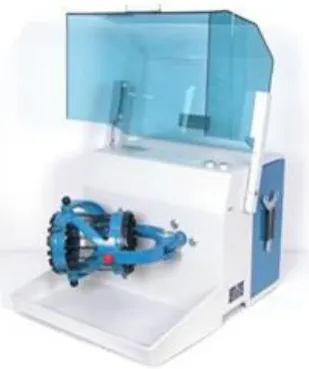
Figure 2.6: Tubular shaker-mixer ... 36
Figure 2.7: Dissolution apparatus I (basket assembly) ... 38
xvii Chapter 3
Figure 3.1: Schematic illustration of charge generation during metal-metal contact. ... 48
Figure 3.2: Schematic illustration of electron transfer theory of tribo-electric charge
generation ... 50
Figure 3.3: Schematic illustration of ion transfer theory of tribo-electric charge generation ………..…52
Figure 3.4: Schematic illustration of material transfer theory of tribo-electric charge
generation ... 54
Figure 3.5: SEM micrographs of (a) FBP and (b) THP powder particles. ... 77
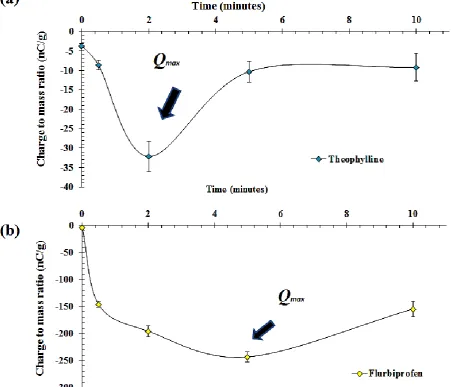
Figure 3.6: Tribo-electrification charging profiles of (a) FBP and (b) THP powder particles
(n = 3) ... 78
Figure 3.7: Schematic illustration of tribo-electrific charging of FBP and THP powder
particles ... 79
Figure 3.8: SEM micrographs of MC and HPMC, (a) A4M (b) F4M (c) E4M (d) K4M (e)
K15M (f) K100M ... 84
Figure 3.9: Schematic illustration of tribo-electrification charging of MC and HPMC powder
particles ... 86
Figure 3.10: Schematic illustration of tribo-electric charge generation of powder mixtures………95
Figure 3.11: Figure 3.11, SEM micrographs of FBP powder mixtures, (a) A4M/THP
(b)F4M/THP (c) E4M/THP (d) K4M/THP (e) K15M/THP and (d) K100M/THP ... 98
Figure 3.12: SEM micrographs of THP powder mixtures, (a) A4M/THP (b) F4M/THP (c)
E4M/THP (d) K4M/THP (e) K15M/THP and (d) K100M/THP ... 99
Figure 3.13: DSC profiles of (a) MC/HPMC and (b) FBP/THP ... 101
xviii
Figure 3.15: PXRD patterns of (a) MC/HPMC and (b) FBP/THP. ... 104
Figure 3.16: PXRD patterns of (a) THP and (b) FBP powder mixtures ... 105
Figure 3.17: Effect of polymer concentration on the tribo-electric charging of cellulose ether
: FBP powder mixtures; polymer particle size (a) 150 - 250 µm and (b) 90 - 150 µm (n=3) 108
Figure 3.18: Effect of polymer concentration on the tribo-electric charging of cellulose ether
: THP powder mixtures; polymer particle size (a) 150 - 250 µm and (b) 90 - 150 µm (n=3)
... 109
Figure 3.19: Effect of polymer molecular size (viscosity) on the tribo-electric charging of
MC/HPMC : FBP powder mixtures; polymer particle size (a) 150 - 250 µm and (b) 90 - 150
µm, n=3, (viscosity (cp) in parentheses on x-axis) ... 115
Figure 3.20: Effect of polymer molecular size (viscosity) on the tribo-electric charging of
MC/HPMC : THP powder mixtures; polymer particle size (a) 150 - 250 µm and (b) 90 - 150
µm, n=3, ( viscosity (cp) in parentheses on x-axis). ... 116
Figure 3.21: Effect of tribo-electric charging (nC/g) of FBP powder mixtures on SA(%), (a)
A4M (b) F4M (c) E4M (d) K4M (e) K15M (f) K100M having polymer particle size 90-150
µm and 150-250 µm ... 119
Figure 3.22: Effect of tribo-electric charging (nC/g) of THP powder mixtures on SA(%), (a)
A4M (b) F4M (c) E4M (d) K4M (e) K15M (f) K100M having polymer particle size 90-150
µm and 150-250 µm ... 120
Chapter 4
Figure 4.1: Cross-sectional view of a typical hydrophilic matrix tablet ... 124
Figure 4.2: Mechanism of drug release from hydrophilic matrix tablets ... 128
Figure 4.3: Drug release mechanism of water soluble and poorly water soluble drugs from
xix
Figure 4.4: Dissolution profiles of FBP and THP compacts ... 142
Figure 4.5: Swelling profiles of cellulose ethers based matrix tablets of particle prize (a)
90-150 (b) 90-150-250 µm (n = 3) ... 149
Figure 4.6: Comparative erosion of plain MC/HPMC compacts (n = 3). ... 150
Figure 4.7: Swelling profiles of A4M/FBP, (a) 90-150 µm and (b) 150-250 µm and
A4M/THP (c) 90-150 µm and (d) 150-250 µm hydrophilic matrices (n=3) ... 155
Figure 4.8: Comparative erosion of (a) A4M/FBP and (b) A4M/THP hydrophilic matrices
(n=3) ... 156
Figure 4.9: Dissolution profiles of A4M/FBP hydrophilic matrices having A4M particle size
(a) 90-150 µm and (b) 150-250 µm (n=3) ... 157
Figure 4.10: Dissolution profiles of A4M/THP hydrophilic matrices having A4M particle
size (a) 90-150 µm and (b) 150-250 µm (n=3) ... 158
Figure 4.11: Swelling profiles of F4M/FBP, (a) 90-150 µm and (b) 150-250 µm and
F4M/THP (c) 90-150 µm and (d) 150-250 hydrophilic matrices (n=3) ... 162
Figure 4.12: Comparative erosion of (a) F4M/FBP and (b) F4M/THP hydrophilic matrices
(n=3) ... 163
Figure 4.13: Dissolution profiles of F4M/FBP hydrophilic matrices having F4M particle size
(a) 90-150 µm and (b) 150-250 µm (n=3)… ... 164
Figure 4.14: Dissolution profiles of F4M/THP hydrophilic matrices having F4M particle size
(a) 90-150 µm and (b) 150-250 µm (n = 3) ... 165
Figure 4.15: Swelling profiles of E4M/FBP, (a) 90-150 µm and (b) 150-250 µm and
E4M/THP (c) 90-150 µm and (d) 150-250 µm hydrophilic matrices (n = 3). ... 169
Figure 4.16: Comparative erosion of (a) E4M/FBP and (b) E4M/THP hydrophilic matrices
xx
Figure 4.17: Dissolution profiles of E4M/FBP hydrophilic matrices having E4M particle size
(a) 90-150 µm and (b) 150-250 µm (n = 3) ... 171
Figure 4.18: Dissolution profiles of E4M/THP hydrophilic matrices having E4M particle size
(a) 90-150 µm and (b) 150-250 µm (n = 3) ... 172
Figure 4.19: Swelling profiles of K4M/FBP, (a) 90-150 µm and (b) 150-250 µm and
K4M/THP (c) 90-150 µm and (d) 150-250 µm hydrophilic matrices (n = 3) ... 176
Figure 4.20: Comparative erosion profiles of (a) K4M/FBP and (b) K4M/THP hydrophilic
matrices (n = 3) ... 177
Figure 4.21: Dissolution profiles of K4M/FBP hydrophilic matrices having K4M particle
size (a) 90-150 µm and (b) 150-250 µm (n = 3) ... 178
Figure 4.22: Dissolution profiles of K4M/THP hydrophilic matrices having K4M particle
size (a) 90-150 µm and (b) 150-250 µm (n = 3). ... 179
Figure 4.23: Swelling profiles of K15M/FBP, (a) 90-150 µm and (b) 150-250 µm and
K15M/THP (c) 90-150 µm and (d) 150-250 µm hydrophilic matrices (n = 3) ... 181
Figure 4.24: Comparative erosion of (a) K15M/FBP and (b) K15M/THP hydrophilic
matrices (n = 3). ... 182
Figure 4.25: Dissolution profiles of K15M/FBP hydrophilic matrices having K15M particle
size (a) 90-150 µm and (b) 150-250 µm (n = 3). ... 183
Figure 4.26: Dissolution profiles of K15M/THP hydrophilic matrices having K15M particle
size (a) 90-150 µm and (b) 150-250 µm (n = 3). ... 184
Figure 4.27: Swelling profiles of K100M/FBP, (a) 90-150 µm and (b) 150-250 µm and
E4M/THP (c) 90-150 µm and (d) 150-250 µm hydrophilic matrices (n = 3). ... 186
Figure 4.28: Comparative erosion of (a) K100M/FBP and (b) K100M/THP hydrophilic
xxi
Figure 4.29: Dissolution profiles of K100M/FBP hydrophilic matrices having K100M
particle size (a) 90-150 µm and (b) 150-250 µm (n = 3) ... 188
Figure 4.30: Dissolution profiles of K100M/THP hydrophilic matrices having K100M
particle size (a) 90-150 µm and (b) 150-250 µm (n = 3). ... 189
Figure 4.31: Effect of swelling on IDR of FBP based matrix tablets, (a) A4M (b) F4M (c)
E4M (d) K4M (e) K15M (f) K100M having polymer particle size 90-150 µm and 150-250
µm (n = 3) ... 195
Figure 4.32: Effect of swelling on IDR of THP based matrix tablets, (a) A4M (b) F4M (c)
E4M (d) K4M (e) K15M (f) K100M having polymer particle size 90-150 µm and 150-250
µm (n = 3). ... 196
Chapter 5
Figure 5.1: Dissolution/erosion profiles of cellulose ethers based matrix tablets of particle
size (a) 90-150 (b) 150-250 µm (n = 3). ... 204
Figure 5.2: Effect of HPMC (K4M) concentration on the (a) FBP and (b) THP release from
matrix tablets. ... 209
Figure 5.3: Effect of HPMC concentration on the HPMC release from (a) FBP and (b) THP
containing matrix tablets. ... 211
Figure 5.4: Erosion profiles of HPMC/FBP matrix tablets, (a) gravimetrical technique and
(b) phenol-sulphuric acid assay method. ... 214
Figure 5.5: Erosion profiles of HPMC/THP matrix tablets, (a) gravimetrical technique and
(b) phenol-sulphuric acid assay method ... 215
Figure 5.6: Comparative analysis of erosion rates calculated from both techniques. ... 218
Figure 5.7: Comparative analysis of degree of erosion calculated from both techniques, (a)
xxii
Figure 5.8: Residual plot of erosion rate, a comparison between GM and PSA techniques…
... 220
Figure 5.9: Residual plot of comparative degree of erosion between GM and PSA assay, (a)
FBP and (b) THP matrices. ... 222
Figure 5.10: Comparative analysis between HPMC erosion rate (k) and drug release
diffusional exponent (n) ... 224
Chapter 6
Figure 6.1: Schematic illustration of different phases of powder compaction ... 232
Figure 6.2: Schematic illustration of a typical Heckel plot, representing three different
powder compression regions... 243
Figure 6.3: Schematic illustration of a typical engineering strain (C) and compressional
pressure (MPa) and interpretation of Kawakita parameters ... 245
Figure 6.4: A typical force-displacement curve for FBP and THP ... 248
Figure 6.5: In-die relative density profile of model drugs ... 250
Figure 6.6: In-die porosity profile of model drugs. ... 250
Figure 6.7: Heckel plots of FBP and THPwith respect to compression pressure ... 251
Figure 6.8: Kawakita plots of model drugs with respect to compression pressure ... 251
Figure 6.9: Schematic illustrating the compaction mechanisms of FBP and THP ... 253
Figure 6.10: In-die relative density profiles of Methocel® with respect to compression pressure (a) 90-150 µm and (b) 150-250 µm. ... 261
Figure 6.11: In-die porosity profiles of Methocel® with respect to compression pressure (a) 90-150 µm and (b) 150-250 µm. ... 262
xxiii
Figure 6.13: Kawakita plots of Methocel® with respect to compression pressure (a) 90-150 µm and (b) 150-250 µm. ... 265
Figure 6.14: Compaction mechanism of MC/HPMC : FBP/THP matrices ... 273
Figure 6.15: In-die relative density profiles of matrices with respect to compression pressure
(a) A4M: FBP and (b) A4M : THP (n = 3) ... 274
Figure 6.16: In-die porosity profiles of matrices with respect to compression pressure (a)
A4M : FBP and (b) A4M : THP (n = 3) ... 275
Figure 6.17: Heckel plots of matrices with respect to compression pressure (a) A4M : FBP
and (b) A4M : THP (n = 3) ... 277
Figure 6.18: Kawakita plots of matrices with respect to compression pressure (a) A4M : FBP
and (b) A4M : THP (n = 3) ... 278
Figure 6.19: In-die relative density profiles of matrices with respect to compression pressure
(a) F4M : FBP and (b) F4M : THP (n = 3) ... 282
Figure 6.20: In-die porosity profiles of matrices with respect to compression pressure (a)
F4M : FBP and (b) F4M : THP (n = 3) ... 283
Figure 6.21: Heckel plots of matrices with respect to compression pressure (a) F4M : FBP
and (b) F4M : THP (n = 3) ... 285
Figure 6.22: Kawakita plots of matrices with respect to compression pressure (a) F4M : FBP
and (b) F4M : THP (n = 3) ... 286
Figure 6.23: In-die relative density profiles of matrices with respect to compression pressure
(a) E4M : FBP and (b) E4M : THP (n = 3). ... 290
Figure 6.24: In-die porosity profiles of matrices with respect to compression pressure (a)
E4M : FBP and (b) E4M : THP (n = 3). ... 291
Figure 6.25: Heckel plots of matrices with respect to compression pressure (a) E4M : FBP
xxiv
Figure 6.26: Kawakita plots of matrices with respect to compression pressure (a) E4M : FBP
and (b) E4M : THP (n = 3)... 294
Figure 6.27: In-die relative density profiles of matrices with respect to compression pressure
(a) K4M : FBP and (b) K4M : THP (n = 3) ... 298
Figure 6.28: In-die porosity profiles of matrices with respect to compression pressure (a)
K4M : FBP and (b) K4M : THP (n = 3) ... 299
Figure 6.29: Heckel plots of matrices with respect to compression pressure (a) K4M : FBP
and (b) K4M : THP (n = 3) ... 301
Figure 6.30: Kawakita plots of matrices with respect to compression pressure (a) K4M : FBP
and (b) K4M : THP (n = 3) ... 302
Figure 6.31: In-die relative density profiles of matrices with respect to compression pressure
(a) K15M : FBP and (b) K15M : THP (n = 3) ... 304
Figure 6.32: In-die porosity profiles of matrices with respect to compression pressure (a)
K15M : FBP and (b) K15M : THP (n = 3) ... 305
Figure 6.33: Heckel plots of matrices with respect to compression pressure (a) K15M : FBP
and (b) K15M : THP (n = 3) ... 307
Figure 6.34: Kawakita plots of matrices with respect to compression pressure (a) K15M:
FBP and (b) K15M : THP (n = 3) ... 308
Figure 6.35: In-die relative density plots of matrices with respect to compression pressure (a)
K100M : FBP and (b) K100M : THP (n = 3) ... 310
Figure 6.36: In-die porosity plots of matrices with respect to compression pressure (a)
K100M : FBP and (b) K100M : THP (n = 3) ... 311
Figure 6.37: Heckel plots of matrices with respect to compression pressure (a) K100M : FBP
xxv
Figure 6.38: Kawakita plots of matrices with respect to compression pressure (a) K100M :
FBP and (b) K100M : THP (n = 3) ... 314
Figure 6.39: Relationship between Py and b-1 of FBP based matrices, (a) A4M, (b) F4M, (c)
E4M, (d) K4M, (e) K15M AND (f) K100M ... 317
Figure 6.40: Relationship between Py and b-1 of THP based matrices, (a) A4M, (b) F4M, (c)
E4M, (d) K4M, (e) K15M AND (f) K100M ... 318
xxvi
List of Tables
Chapter 2
Table 2.1: Specifications of methylcellulose (MC) and hypromellose (HPMC) ... 21
Table 2.2: Equations derived from standard calibration curves of model drugs. ... 22
Table 2.3: Equations derived from standard calibration curves of different Methocel® grades. ... 37
Chapter 3
Table 3.1: Summary of insulator-metal tribo-electric charging theories ... 56
Table 3.2: Summary of factors affecting tribo-electric charging ... 61
Table 3.3: Tribo-electric charging and surface adhesion results for theophylline and
flurbiprofen (standard deviations in parentheses). ... 80
Table 3.4: Charge-to-mass ratio and percentage particle adhesion of MC/HPMC (standard
deviation is shown in parentheses, n=3) ... 89
Table 3.5: Content uniformity of powder mixture containing (a) FBP and (b) THP (n=3). ... 96
Table 3.6: Adhesion (%) of polymer/ FBP powder mixtures (standard deviation in
parentheses, n=3) ... 111
Table 3.7: Adhesion (%) of polymer/ THP powder mixtures (standard deviation in
parentheses, n=3) ... 112
Table 3.8: Inter-relationship between tribo-electric charge and surface adhesion (n = 3) .... 118
Chapter 4
Table 4.1: Summary of factors affecting drug release from Methocel® based hydrophilic
xxvii
Table 4.2: Solubility and dissolution parameters of FBP and THP (n = 3, standard deviation
given in parenthesis) ... 142
Table 4.3: Swelling kinetics and erosion parameters of plain Methocel® compacts (n = 3,
standard deviation given in parenthesis) ... 150
Table 4.4: Content uniformity of powder mixture containing FBP and THP (n=3) ... 151
Table 4.5: Swelling kinetics and matrix erosion of A4M based hydrophilic matrices (n = 3,
standard deviation given in parenthesis) ... 156
Table 4.6: Summary of dissolution parameters of A4M based hydrophilic matrices (n = 3,
standard deviation given in parenthesis) ... 159
Table 4.7: Summary of drug release kinetics parameters from A4M based hydrophilic
matrices (n=3) ... 159
Table 4.8: Swelling kinetics and matrix erosion of F4M based hydrophilic matrices (n = 3,
standard deviation given in parenthesis) ... 163
Table 4.9: Summary of dissolution parameters of F4M based hydrophilic matrices (n = 3,
standard deviation given in parenthesis) ... 166
Table 4.10: Summary of drug release kinetics parameters of F4M based hydrophilic matrices
(n = 3) ... 166
Table 4.11: Swelling kinetics and matrix erosion of E4M based hydrophilic matrices (n = 3,
standard deviation given in parenthesis) ... 170
Table 4.12: Summary of dissolution rate parameters of E4M based hydrophilic matrices (n =
3, standard deviation given in parenthesis) ... 173
Table 4.13: Summary of drug release kinetics parameters of E4M based hydrophilic matrices
(n = 3) ... 173
Table 4.14: Swelling kinetics and matrix erosion of K4M based hydrophilic matrices (n = 3,
xxviii
Table 4.15: Summary of dissolution parameters of K4M based hydrophilic matrices (n = 3,
standard deviation given in parenthesis) ... 180
Table 4.16: Summary of drug release kinetic parameters of K4M based hydrophilic matrices
(n = 3) ... 180
Table 4.17: Swelling kinetics and matrix erosion of K15M based hydrophilic matrices (n = 3,
standard deviation given in parenthesis) ... 182
Table 4.18: Summary of dissolution parameters of K15M based hydrophilic matrices (n = 3,
standard deviation given in parenthesis) ... 185
Table 4.19: Summary of drug release kinetic parameters of K15M based hydrophilic
matrices (n = 3) ... 185
Table 4.20: Swelling kinetics and matrix erosion of K100M based hydrophilic matrices (n =
3) ... 187
Table 4.21: Summary of dissolution parameters of K100M based hydrophilic matrices (n =
3, standard deviation given in parenthesis) ... 190
Table 4.22: Summary of drug release kinetics parameters of K100 based hydrophilic
matrices (n = 3) ... 190
Table 4.23: Correlation co-efficient of swelling and IDR inter-relationship (n = 3) ... 194
Chapter 5
Table 5.1: Summary of MC/HPMC erosion kinetics parameters (n = 3). ... 205
Table 5.2: HPMC (K4M) and drug release kinetics parameters of THP and FBP matrix
tablets (n = 3, standard deviation are in parenthesis) ... 212
Table 5.3: Erosion kinetic parameters for THP and FBP matrix tablets... 216
Table 5.4: Comparison of erosion rates of matrix tablets from gravimetrical and PSA assay
xxix
Table 5.5: Comparison of degree of erosion (%) of matrix tablets from gravimetrical and
PSA assay from residual plots (n = 3, standard error is in parenthesis) ... 221
Chapter 6
Table 6.1: Summary of factors affecting compaction properties of Methocel® matrices .... 240
Table 6.2: Relative density, porosity (in-die and out-of-die), tensile strength and elastic
recovery of FBP and THP compacts (n = 3, standard deviation given in parenthesis) ... 252
Table 6.3: Heckle and Kawakita compression parameters for FBP and THP compacts (n = 3)
... 252
Table 6.4: Relative density, porosity (in-die and out of die), tensile strength and elastic
recovery of Methocel® compacts (n = 3, standard deviation given in parenthesis) ... 263
Table 6.5: Heckel and Kawakita compression parameters of Methocel® compacts (n = 3).
... 266
Table 6.6: Summary of In-die and out of die relative density values of A4M : FBP/THP
matrices (n = 3) ... 276
Table 6.7: Summary of In-die and out of die porosity values of A4M : FBP/THP matrices (n
= 3) ... 276
Table 6.8: Summary of tensile strength and elastic recovery of A4M : FBP/THP matrices (n
= 3, standard deviation given in parenthesis)... 279
Table 6.9: Summary of Heckel and Kawakita compressional parameters of A4M : FBP/THP
matrices (n = 3). ... 279
Table 6.10: Summary of In-die and out of die relative density values of F4M : FBP/THP
xxx
Table 6.11: Summary of In-die and out of die porosity values of F4M : FBP/THP matrices (n
= 3) ... 284
Table 6.12: Summary of tensile strength and elastic recovery of F4M : FBP/THP matrices (n
= 3). ... 287
Table 6.13: Summary of Heckel and Kawakita compressional parameters of F4M : FBP/THP
matrices (n = 3). ... 287
Table 6.14: Summary of In-die and out of die relative density values of E4M : FBP/THP
matrices (n = 3). ... 292
Table 6.15: Summary of In-die and out of die porosity values of E4M : FBP/THP matrices (n
= 3) ... 292
Table 6.16: Summary of tensile strength and elastic recovery of E4M : FBP/THP matrices (n
= 3, standard deviation given in parenthesis)... 295
Table 6.17: Summary of Heckel and Kawakita compressional parameters of E4M : FBP/THP
matrices (n = 3). ... 295
Table 6.18: Summary of In-die and out of die relative density values of K4M : FBP/THP
matrices (n = 3). ... 300
Table 6.19: Summary of In-die and out of die porosity values of K4M : FBP/THP matrices
(n = 3). ... 300
Table 6.20: Summary of tensile strength and elastic recovery of K4M : FBP/THP matrices (n
= 3, standard deviation given in parenthesis)... 303
Table 6.21: Summary of Heckel and Kawakita compressional parameters of K4M :
FBP/THP matrices (n = 3). ... 303
Table 6.22: Summary of In-die and out of die relative density values of K15M : FBP/THP
xxxi
Table 6.23: Summary of In-die and out of die porosity (%) values of K15M : FBP/THP
matrices (n = 3). ... 306
Table 6.24: Summary of tensile strength and elastic recovery of K15M : FBP/THP matrices
(n = 3, standard deviation given in parenthesis) ... 309
Table 6.25: Summary of Heckel and Kawakita compressional parameters of K15M :
FBP/THP matrices (n = 3). ... 309
Table 6.26: Summary of In-die and out of die relative density values of K100M : FBP/THP
matrices (n = 3). ... 312
Table 6.27: Summary of in-die and out of die porosity (%) values of K100M : FBP/THP
matrices (n = 3). ... 312
Table 6.28: Summary of tensile strength and elastic recovery of K100M : FBP/THP matrices
(n = 3, standard deviation given in parenthesis) ... 315
Table 6.29: Summary of Heckel and Kawakita compressional parameters K100M : FBP/THP
matrices (n = 3). ... 315
xxxii
List of abbreviations
AGU Anhydroglucose unit
ANOVA Analysis of variance
API Active pharmaceutical ingredient
CMC Carboxymethyl cellulose
CPD Contact potential difference
Cp Centipoise
CR Controlled release
CI Compressibility index
DC Direct compression
DSC Differential scanning calorimetry
EC Ethyl cellulose
ER Extended release
FBP FBP
FG Food grade
GIT Gastrointestinal tract
GM Gravimetrical method
HCO Hydrogenated castor oil
HEC Hydroxyethyl cellulose
xxxiii
Hpo Hydroxypropyl
IDR Intrinsic dissolution rate
kN Kilonewtons
LV Low viscosity
MC Methylcellulose
Meo Methoxy
MPa Megapascals
NSAIDs Non-steroidal anti-inflammatory drugs
PS Polystyrene
PET Polyethylene terephthalate
PI Plasticity index
PSA Phenol-sulphuric acid assay
PTFE Polytetrafluoroethylene
PVC Polyvinyl chloride
PXRD Powder x-ray diffraction
Py Yield pressure
R2 Correlation co-efficient
xxxiv
UV Ultraviolet
1
1-
Introduction
2
1-
Introduction
1.1-
Cellulose ethers
Over the past few decades, the application of polymers in the science of drug delivery has led
to the development of numerous polymer-based drug delivery systems (Wen et al., 2010).
Among them, hydrophilic cellulose ethers are unarguably the most frequent and widely used
polymers, and are usually manufactured through etherification of cellulose (Maderuelo et al.,
2011). Cellulose is an abundantly occurring biopolymer and there are many sources
considered suitable for cellulose ether manufacturing. These include seed fibres (cotton),
wood fibres, bast fibres, grasses, algae and bacteria, however, cotton seed and wood fibres
are considered to be the prime and more reliable sources (Craver and Carraher, 2000).
Cellulose is a polysaccharide made up of glucose units with an empirical formula C6H12O6
and sometimes designated as a beta-D-glucopyranose or anhydroglucose unit (AGU). These
units usually hooked together through a condensation reaction to form a cellulose molecule
(Figure 1.1). It is insoluble in water and its poor solubility is considered to be linked
primarily with the strong inter- and intra-molecular hydrogen bonding between the individual
polymer chains. Despite its poor solubility, it is used in range of applications including
netting, composites, upholstery, coatings and paper. Moreover, chemical modification can be
performed to produce different derivatives suited for specific pharmaceutical applications
3
Figure 1.1, Structure of cellulose
In 2000, the net global consumption of cellulose ethers was estimated to be 371,000 tonnes,
with a total world market of nearly $2.0 billion. An overall average growth rate of 3.5 % per
year is expected for all cellulose ether products in 2012–2018. In Asia, the lowest growth is
expected in Japan, while China will lead global growth. The regions with the largest current
consumption are Europe and China with an annual growth rate of 2.0 % and 4.6 %,
respectively (SRI, 2013). Their popularity can be attributed to their non-toxic and
biocompatible properties, with some even being approved as direct food additives (Alderman,
1984).
The only considerable recognised risk related to cellulose ethers utilization is that they may
form flammable dusts when finely divided powder particles are suspended in air. An
explosion may result if suspended dust contacts an ignition source. Cloud and layer ignition
temperatures generally vary between 290 and 410 °C and critical airborne concentrations vary
4
and proper design and operation of handling equipment (NFPA, 1986). Another minor hazard
is associated with water-soluble cellulose ether powders as they have a tendency to form a
slippery surface when wet; therefore spills should be cleaned immediately in the working
area to avoid slipping mishaps.
1.2-
Manufacturing of cellulose ethers
In 1912 the first experimental work was conducted to produce useful derivatives of cellulose.
Firstly, methyl and ethyl derivatives were manufactured but soon after that
carboxymethylcellulose (CMC) and hydroxyethylcellulose (HEC) were produced (Worden,
2011). In 1920s, Germany started to produce these cellulose ethers on a commercial scale,
however, in United States commercial production was started in 1930s. The presence of
hydroxyl groups in cellulose structure gave a hope to organic chemists that it could be
converted to useful derivatives and since then, there have been much advancement in the
preparation methodologies (Kroschwitz and Seidel, 2007; Mark, 2014; Worden, 2011). The
building blocks of cellulose are AGUs bound through ß-1,4-glycosidic linkages (Figure 1.1).
The AGU rings contain three hydroxyl groups, a primary hydroxyl at the C- 6 position and
two secondary groups at the C- 2 and C- 3 positions. In the native state the chains are linked
together by strong inter- and intra-molecular bonds and as a result cellulose is not water
soluble (Wertz et al., 2010). For manufacturing of cellulose ethers, the irreversible
nucleophilic substitution reaction is commonly employed and its simplified form can be
expressed as shown in scheme 1.1 (Trimm, 2011).
(1.1)
Where other organic radicals are represented by R, such as methyl (- CH3), ethyl (- C2H5),
5
Cellulose ethers are commonly manufactured on a commercial scale by reaction of purified
cellulose with alkylating reagents, usually in the presence of a base (sodium hydroxide) and
an inert diluent (acetone or propanol) (Salamone, 1996). The combination of water and base
activates the cellulose matrix by disrupting hydrogen-bonded crystalline regions, thereby
increasing accessibility to the alkylating reagent and this activated matrix is termed ‗alkali
cellulose‘ (Mark, 2014). Methylcellulose (MC) is usually produced by methylation of alkali
cellulose through methyl halide, as shown in scheme 1.2:
RCell-O - + CH3-X → R Cell – O – CH3 + X - (1.2)
Where, RCell-O- is ‗alkali cellulose‘ and RCell-O-CH3 is methylcellulose.
Hydroxypropyl methylcellulose (HPMC), a mixed cellulose ether, is prepared by reaction of
mixtures of methyl chloride and propylene oxide with alkali cellulose (CH3 CH CH2O) as
shown in scheme 1.3;
Rcell- O - + CH3 CH CH2O → Rcell-O-CH2CH(OH)CH3 + NaOH (1.3)
Where, Rcell-O-CH2CH(OH)CH3is hydroxypropyl methylcellulose.
The ratios of methyl and hydroxypropyl groups can be controlled by changing the
concentration of the reactants (România, 1995). To make this complex manufacturing process
more commercially reliable and robust, different types of reagents can be added. Likewise
inert diluents are frequently used in these processes which firstly suspend/disperse the
6
product. Secondly, the diluent can facilitate the reagents‘ distribution which might lead to
uniform reaction (Yokota, 1985). Moreover, these reactions are typically conducted at
elevated temperatures (∼50–140◦C), under nitrogen, to inhibit oxidative molecular weight degradation of the polymer (Kroschwitz and Seidel, 2007). After reaction, crude grades are
simply dried, ground, and packed; however, purified grades require eradication of
by-products before drying. Low concentrations of colloidal silica can be added to some by-products
prior to drying or before packaging to improve handling operations (Mark, 2014; Worden,
2011). A schematic outline of the manufacturing process is illustrated in Figure 1.2.
Figure 1.2, Schematic outline of cellulose ether manufacturing process (Mark, 2014)
1.3-
Derivatives of cellulose ethers
Cellulose ethers are a commercially important class of polymers and their properties are
generally determined by their molecular weights, distribution of the substitution groups and
degree of substitution. Moreover, their important intrinsic properties usually include
7
of mostly used cellulose ethers are: methylcellulose (MC), hydroxypropyl methylcellulose
(HPMC), hydroxyethylcellulose (HEC), hydroxypropyl cellulose (HPC), ethylcellulose (EC)
and sodium carboxymethylcellulose (NaCMC). However, MC and HPMC are most
frequently employed candidates in pharmaceutical controlled release matrix systems (Wen et
al., 2010). A general chemical structure of cellulose ethers with their respective substituents
(R) is shown in Figure 1.3.
Cellulose ether Substituents (R)
MC -H, -CH3
HPMC -H, -CH3, -CH2CH(OH)CH3
HPC -H, -CH2CH(OH)CH3
EC -H, -C2H5
HEC -H, -CH2CH2OH
NaCMC -H, -CH2COONa
8
1.3.1- Methylcellulose
Methylcellulose is a long chain, linear, non-ionic and substituted cellulose in which almost
27–32 % of parent hydroxyl groups are in the form of the methyl ether (Mark, 2014).
Methylcellulose is an odourless, tasteless, white, fibrous granular powder which is practically
insoluble in acetone, chloroform, methanol, ethanol (95%), ether, saturated salt solutions,
toluene, and hot water. In cold water, methylcellulose swells and disperses slowly to form a
clear to opalescent, viscous and colloidal dispersion ( Rowe et al., 2012).
The various grades of methylcellulose have degrees of polymerization in the range 50–1000,
with molecular weights (average number) in the range of 10 000 – 220 000 Da. The degree of
methylcellulose substitution is defined as the average number of methoxyl (- OCH3) groups
attached to each of the AGUs along the chain. The degree and levels of substitution affect the
physical properties of methylcellulose, including its solubility. MC contains a two-fold helix
conformation similar to cellulose, however, the integration of - OCH3 groups on glucose
monomer induce steric hindrance which in turn opens up the cellulose backbone
(Embuscado, 2014) resulting in an ability to dissolve in cold water (Sarkar and Walker,
1995).
MC is available commercially from a number of sources; grades in this thesis were from Dow
Chemical Company. The first part of the trade name (A) is indicative of its chemistry which
is followed by an indication of the viscosity of an aqueous 2% w/w solutions (cps) at 20 °C,
with a multiplier of 100 (denoted by the letter C) or 1000 (denoted by the letter M). A final
suffix identifies the grade of the material, such as premium (P), low viscosity (LV),
9
1.3.2- Hypromellose (Hydroxypropyl methylcellulose, HPMC)
Hydroxypropyl methylcellulose (HPMC) is a semisynthetic, inert, viscoelastic polymer used
as an excipient in pharmaceutical formulations and a controlled-delivery component in oral
medicaments (Wertz et al., 2010). It is a non-ionic, odourless, tasteless, white or
creamy-white fibrous or granular powder. It is soluble in cold water, forming a viscous colloidal
solution; practically insoluble in hot water, chloroform, ethanol (95%), and ether, but soluble
in mixtures of ethanol and dichloromethane, mixtures of methanol and dichloromethane, and
mixtures of water and alcohol. It is available in several grades that vary in viscosity and
extent of substitution ( Rowe et al., 2012).
HPMC also contains a two-fold helix conformation similar to MC and cellulose but the
presence of - OCH3 and hydroxypropoxy groups (- CH2CH(OH)CH3 ) on AGUs induce steric
hindrance which opens up the cellulose backbone in a similar manner to MC. This
modification in chemical structure of HPMC also confers the ability to dissolve in cold water
same (like MC, as described earlier in section 1.3.1) (Embuscado, 2014). However, the
presence of different levels of -CH2CH(OH)CH3 groups in various HPMC grades affects
their gelation behaviour (Sarkar and Walker, 1995). HPMC produces strong films but these
are not as strong as those produced using MC because MC has a linear structure and
non-ionic nature, ideal for inter-polymer association which is necessary for films development.
However, in case of HPMC the -CH2CH(OH)CH3 groups result in a greater level of steric
hindrance which keeps these HPMC polymeric chains further apart compared to MC
(Embuscado, 2014).
Many commercial hypromelloses are identified by codes. For instance, for those
manufactured by the Dow Chemical Company, the first part of the nomenclature is a letter
(E, F or K) that relates to the degree of substitution. The K grades (hypromellose 2208) have
10
(hypromellose 2906) have a methoxy substitution of 27–30% and a hydroxypropyl
substitution of 4.0– 7.5%. E grades (hypromellose 2910) have a methoxy substitution of 28–
30% and a hydroxypropyl substitution of 7–12% (Dow Commercial Information 2002). This
first letter is followed by an indication of the viscosity of their aqueous 2% w/w gels (in
centipoises) at 20 °C, with a multiplier of 100 (denoted by the letter C) or 1000 (denoted by
the letter M). A final suffix identifies the grade of the material, such as premium (P), low
viscosity (LV), controlled release (CR), granular (G), surface treated (S) or food grade (FG).
Controlled-release dosage forms mainly use the K or E grades of hypromellose (Dow, 2006).
1.4- Pharmaceutical applications of MC and HPMC
Methylcellulose (MC) and hypromellose (HPMC) are used extensively in the pharmaceutical
industry for a wide range of purposes.
(i) Applications in pharmaceutical coating
Pharmaceutical solid dosage forms like tablets, pellets, pills, beads, granules and
microcapsules are often coated for various reasons such as protection of sensitive drugs from
humidity and inappropriate environmental conditions, taste masking or enabling site or time
specific release characteristics (Wen et al., 2010). MC and HPMC are generally hydrophilic,
having excellent film-forming characteristics and are widely used for coating solid dosage
forms (Banker et al., 1981; Entwistle and Rowe, 1979). Lower molecular weight grades of
MC and HPMC tend to be employed for coating tablets and granules. Film properties have
been shown to be affected by the molecular weight of the polymer with higher molecular
weight polymers producing harder and less elastic films (Fukui et al., 2000; Macleod et al.,
1999; Pradhan et al., 2014).
(ii) Ophthalmic applications
MC and HPMC are used as stabilizers and thickeners for ophthalmic solutions (eye drops and
11
surface tension which improves wetting and spreading of the solution over the surface of the
eye (Kaur et al., 2000; Liu et al., 2006).
(iii) Applications as tablet binders
Wet granulation is an important tableting process in which drug substance is combined with
other excipients and processed using solvent (aqueous or organic) with subsequent drying and
sieving to produce uniform granules (Chowhan, 1980). The strong binding properties
exhibited by MC and HPMC enable their utilization in granule preparation in moist and dry
granulation formulations, to produce harder tablets upon compression (Itiola, 1991).
(iv) Applications as suspending agents
MC and HPMC can be used as suspending agents because of their viscosity enhancing
properties. Choice of the optimum concentration and viscosity grade is vital, as too high a
polymer concentration can cause gelling and failure of the sedimented particles to redisperse
(Raghavan et al., 2003).
(v) Applications as emulsifying agents
Cellulose ethers, especially MC and HPMC, act to stabilize an emulsion by forming a
multimolecular film around the dispersed globules at the oil/water interface. They can also
increase the viscosity of the continuous phase of an o/w emulsion. Lower molecular weight
MC and HPMC were found to be better emulsifying agents than higher molecular weight
grades because of their polymer chain flexibility (Schulz and Daniels, 2000; Wollenweber et
al., 2000).
(vi) Applications as extended release (ER) solid dosage form excipients
Matrices are very simple and efficient systems for controlling drug release from dosage
forms. Cellulose ethers, in particular MC and HPMC, are widely used to develop ER
12
et al., 2010). Varying concentration of MC and HPMC can be used to delay or control the
drug release profiles regardless of their solubility characteristics, however, the relative
solubility of the drug can affect the release mechanism; water soluble drugs are released
mainly by diffusion but poorly water soluble drugs are released predominantly by erosion
(Ghori et al., 2014b; Li et al., 2005).
(ix) Applications as compressibility enhancers
Almost 80 % of pharmaceutical products are administered in the form of tablets. There are
different ways of tablet manufacturing but direct compression is a straight forward, simple
and fast tablet compression technique. This method commonly used for tableting of medium
to high potency drugs where the drug contents are less than 30 % of the formulation (Jivraj et
al., 2000). One of the common difficulties in direct compression and dry granulation is poor
compaction properties of drugs, especially when the amount of drug in tablet formulation is
more than 30 %. So, in these scenarios an efficient compressibility enhancer can help in the
development of tablets having acceptable pharmaceutical characteristics. All of the cellulose
ethers have good compaction properties and these can significantly improve compressibility
of poorly compactable powder mixtures (Shokri and Adibkia, 2013).
(x) Applications as tablet fillers
MC and HPMC can be used as fillers in pharmaceuticals solid dosage forms because of their
compatibility with the most of the other pharmaceutical excipients and drugs. Furthermore,
neither of these polymers cause any irritancy to any part of gastrointestinal tract (GIT)
(Shokri and Adibkia, 2013).
(xi) Applications as disintegrants
Solid oral dosage forms, specifically tablets, go through several steps before the drug reaches
the systemic circulation. Among these, disintegration is the key initial step which starts
13
aqueous environment(Esezobo, 1989). MC and HPMC, in low concentrations, can be used as
disintegration agents (Rowe et al., 2012).
(xii) Miscellaneous pharmaceutical applications
Other pharmaceutical applications of MC include use as a bulk laxative and HPMC can be
an alternative to gelatin in the manufacturing of hard-shell medicinal capsules (Sarkar, 1979).
MC and HPMC have also been reported to have applications as a contraceptive as they have
the ability to immobilize human sperm ( Hofmann and Steiner, 1980; Loewit, 1977; Oyelola
et al., 1987).
1.5- Profiles of model drugs
1.5.1- Flurbiprofen
Flurbiprofen (FBP) is a propionic acid derivative, first synthesized in 1974 during the
pharmacological testing of substituted phenylalkanoic acid and the most potent was
substituted 2- (4-biophenyl) propionic acid (Lemke and Williams, 2012). It was initially
marketed as a sodium salt for topical ophthalmic use in 1987 in United States. However, the
first oral form of FBP (Ansaid®) was introduced in 1988. It is a white crystalline powder, practically insoluble in water, (variously reported as 0.034 mg/ml (Tavornvipas et al., 2002),
0.008 mg/ml (Yalkowsky et al., 2010) and 0.024 mg/ml (Maitre et al., 2007)), however, it is
freely soluble in alcohol (Sweetman, 2009). It has a high propensity to electrostatic charging,
poor compaction and SA properties in comparison to other drugs and pharmaceutical
excipients (Šupuk et al., 2012; Šupuk et al., 2013). It is a weak acid (pKa = 4.22) (Xu and
Madden, 2011) and contains a biphenyl group with a fluorine atom in the ortho position (Fig
14
Figure 1.4, Structure of FBP.
FBP is a non-steroidal anti-inflammatory drug (NSAID), a group of drugs that have
analgesic, anti-inflammatory, and antipyretic effects. NSAIDs inhibit cyclooxygenase (COX)
and which is in turn responsible for the inhibition of biosynthesis of prostaglandins (PG) and
thromboxanes from arachidonic acid (Katzung, 2007). It undergoes entero-hepatic circulation
and extensively metabolised by phase-I and phase-II biotransformation reaction. It is recanted
as a non-selective cox inhibitor as it inhibits both types of COX (COX-1 and COX-2)
enzymes. Its anti-inflammatory action is more effective than ibuprofen as it inhibits both
PGE2 and PGF2. However, inhibition of COX-1 is related to the toxic effects associated with
GIT (August et al., 1996). It is available in 50 and 100 mg tablets and indicated for acute or
chronic osteoarthritis, and rheumatoid arthritis (BNF, 2014). The most prominent adverse
effect related to NSAIDs is their toxicity prevailing in long term GIT intolerance and
ulceration. The commonest adverse effects of FBP are generally GIT disturbances, such as
GIT discomfort, nausea, and diarrhoea; these are usually mild and reversible but in some
patients, peptic ulceration and severe GIT bleeding may occur. However, FBP is generally
better tolerated compared to aspirin with low incidence of hepatic toxicity. Like other
NSAIDs it is contraindicated for patients suffering from nasal polyps, rhinitis, angioedema,
15
1.5.2- Theophylline
Theophylline (THP) is a methyl xanthine belonging to xanthine family. It was extracted from
tea plant leaves and its chemical identification was carried out in 1888, moreover its
commercial synthesis was started in 1895. THP was firstly marketed as a diuretic drug but
later its anti-asthmatic action was established. In 1970s it was introduced to the market as a
liquid syrup (Rheostat® 20 and Rheostat® 80) but in 1980s the first oral tablet (Quiroz®) was introduced in United States (Lemke and Williams, 2012). It is a white, odourless, crystalline
powder which is slightly soluble in water, 8.3 g/L, (Yalkowsky et al., 2010), sparingly
soluble in alcohol, chloroform, and ether but freely soluble in solutions of alkali hydroxides
and in ammonia (Sweetman, 2009). Chemically, it is 1,3-dimethylxanthine and contains an
acidic and basic nitrogen at N-7 and N-9, respectively (Fig. 1.5). It has good compaction and
electrostatic properties in comparison to FBP (Asare-Addo et al., 2013b;Šupuk et al., 2012;
Šupuk et al., 2013).
Figure 1.5, Structure of THP.
Although THP is considered among the pioneering drugs developed for the treatment of
asthma and chronic obstructive pulmonary disease (COPD), its precise mode of action is still
ambiguous. The main possibilities include non-selective phosphodiesterase inhibition and
antagonistic effects of adenosine. It undergoes n-methylation due to cytochrome P450 1A2
16
in reversible airways obstruction, severe acute and chronic asthma. However, it should be
avoided in peptic ulcer, hypertension and cardiac diseases. Nausea, vomiting, insomnia,
gastric irritation, tachycardia and palpitation are the typical adverse effects associated with
THP (Craig and Stitzel, 2004).
1.6- Aims and objectives
The aims of this thesis were to understand the tribo-electrification, swelling, erosion,
dissolution and compaction properties of MC and HPMC matrices containing model poorly
soluble and soluble drugs, as summarised below (Figure, 1.6).
1.6.1- Tribo-electrification and adhesion studies
1. To investigate the tribo-electrification and adhesion properties of MC and HPMC
powders.
2. To study the impact of polymeric attributes such as particle size fractions, substitution
levels and molecular size (viscosity) on tribo-electric and adhesion properties.
3. To study the tribo-electrification and adhesion properties of model drugs.
4. To study the impact of varying proportions and physical attributes of MC and HPMC
on tribo-electric and adhesion properties of model drugs.
1.6.2- Swelling, erosion and dissolution studies
1. To study the swelling and erosion properties of MC and HPMC matrices.
2. To study the impact of polymeric attributes such as particle size fractions, substitution
levels and molecular size (viscosity) on the swelling and erosion properties.
17
4. To study the impact of varying proportions and physical attributes of MC and HPMC
on swelling, erosion and dissolution properties of hydrophilic matrices.
5. Development, characterisation and validation of phenol-sulphuric acid assay (PSA)
based erosion determination technique for hydrophilic matrices.
1.6.3- Compaction studies
1. To study the compaction, compression and relaxation properties of MC and HPMC
matrices.
2. To study the impact of polymeric attributes such as particle size fractions, substitution
levels and molecular size (viscosity) on compaction, compression and relaxation
properties of MC and HPMC.
3. To study the compaction, compression and relaxation properties of model drugs.
4. To study the impact of varying proportions and physical attributes of MC and HPMC
18