University of South Carolina
Scholar Commons
Theses and Dissertations
8-9-2014
The Prevalence Rate and Neurocognitive
Morbidity Associated with Obstructive Sleep
Apnea in Children with Sickle Cell Disease
Tal KatzUniversity of South Carolina - Columbia
Follow this and additional works at:https://scholarcommons.sc.edu/etd Part of thePsychology Commons
This Open Access Dissertation is brought to you by Scholar Commons. It has been accepted for inclusion in Theses and Dissertations by an authorized administrator of Scholar Commons. For more information, please [email protected].
Recommended Citation
The Prevalence Rate and Neurocognitive Morbidity Associated with Obstructive Sleep Apnea in Children with Sickle Cell Disease
by
Tal Katz
Bachelor of Arts Hebrew College, 2007
Master of Arts
University of South Carolina, 2011
____________________________________________
Submitted in Partial Fulfillment of the Requirements
For the Degree of Doctor of Philosophy in
Clinical-Community Psychology
College of Arts and Sciences
University of South Carolina
2014
Accepted by
Jeffery Schatz, Major Professor
Scott Decker, Committee Member
Kimberly Hills, Committee Member
Carla Roberts, Committee Member
ii
iii
Acknowledgments
I would like to thank Dr. Jeff Schatz, my advisor, for his continuous guidance and
support while working on this dissertation and throughout my graduate school career.
Jeff’s calm, flexible and common-sense style has allowed me to complete this work and
all other program hurdles while starting a family of my own. I am grateful for having his
support and for the opportunity to work with him for the past 6 years. I would also like to
thank my dissertation committee members Carla Roberts, M.D., Scott Decker, Ph.D., and
Kimberly Hills, Ph.D. for their willingness to take part in this process and for their
thoughtful guidance and advice. Lastly but most importantly, I would like to thank my
wife, Carrie, and my children Mia and David. Carrie: thank you for your patience and
support throughout this long process. I really could not have done this without you. Mia
iv Abstract
Sickle-cell disease (SCD) refers to a group of genetic blood disorders resulting
from the inheritance of genes for S-type hemoglobin. The disease is life-long and is
associated with multiple complications including pain episodes, organ damage, and
neurological morbidities such as stroke, and silent cerebral infarcts which often lead to
cognitive dysfunction. Obstructive sleep apnea (OSA) is a serious medical condition
characterized by intermittent hypoxemia (reduction in blood oxygen levels), hypoxia, and
fragmented sleep that can lead patients to suffer from daytime behavioral and cognitive
dysfunction and reduced quality of life. Children with SCD are at high risk for
developing OSA, which can increase the likelihood for developing cognitive deficits. The
prevalence of OSA in SCD is currently not well-documented; moreover, the relationship
between the two conditions and its combined effect of neurocognitive functioning has
received little attention to date. The purpose of this study is to describe the prevalence
rate of OSA in children with SCD in a large clinic-wide sample and examine the
v
Table of Contents
Acknowledgments... iii
Abstract ... iv
List of Tables ... vi
List of Figures ... vii
Chapter 1: Introduction ...1
Chapter 2: Methods ...20
Chapter 3: Results ...29
Chapter 4: Discussion ...55
vi List of Tables
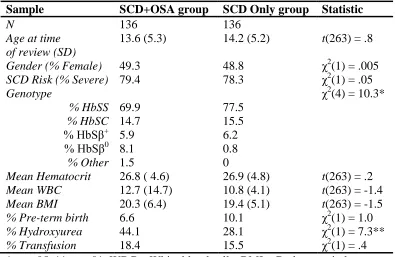
Table 3.1. Descriptive Information for the SCD Sample and Matched Controls ...41
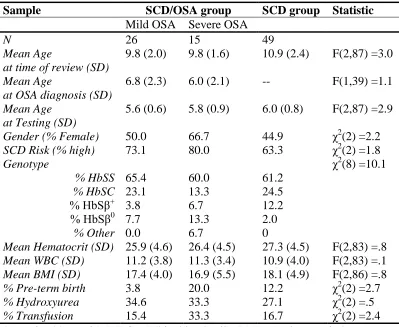
Table 3.2. Descriptive Information for the Cognitive Dataset by Group ...42
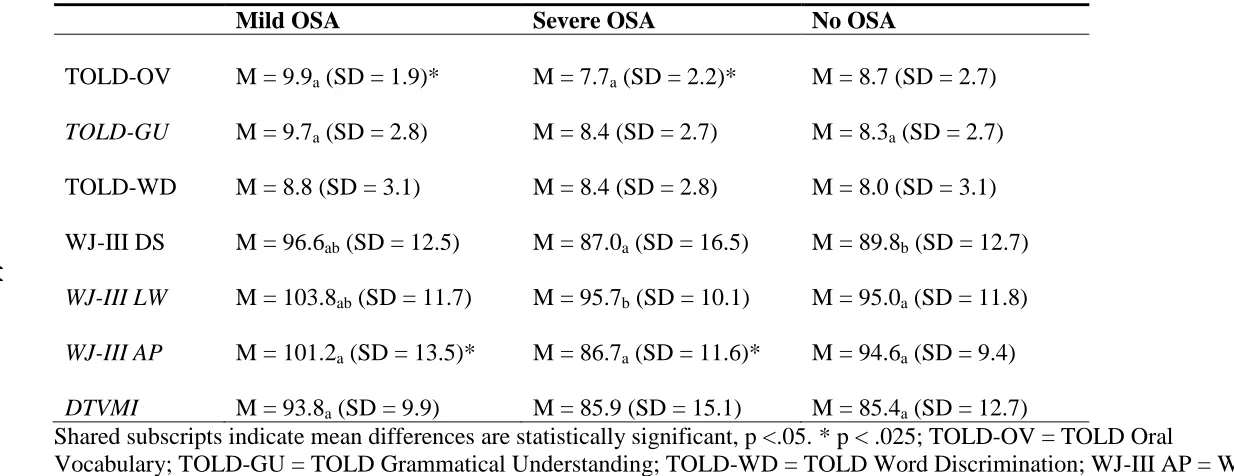
Table 3.3. Descriptive Statistics for Cognitive Variables ...43
Table 3.4. Means and Standard Deviations for Cognitive Variables by OSA Status ...44
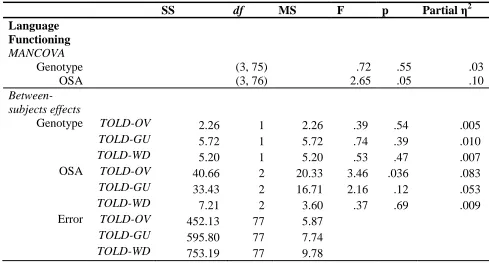
Table 3.5. MANCOVAs for Language Functioning and Academic Skills ...45
Table 3.6. ANCOVAs for Processing Speed and Visual Motor Abilities ...47
Table 3.7. Group Differences on the SDQ ...48
Table 3.8. History of SCD Morbidity for Children with OSA and Controls ...49
Table 3.9. Sleep Study Variables Descriptive Statistics ...50
Table 3.10. Group Differences in Sleep Study Variables Based on SCD Genotype ...51
vii List of Figures
Figure 3.1. Flow Chart for OSA Screening and Sleep Study Results ...53
1
Chapter 1: Introduction
Obstructive sleep apnea (OSA) is a serious medical condition characterized by
intermittent hypoxemia (reduction in blood oxygen levels), hypoxia, and fragmented
sleep. As a result, patients often suffer from daytime behavioral and cognitive
dysfunction and reduced quality of life (Jackson, Howard, & Barnes, 2011). Untreated
individuals with OSA have reported higher levels of depression, anxiety, fatigue, and
irritability, as well as problems with memory, attention, and executive functions.
Children with sickle-cell disease (SCD) often suffer from OSA (Rogers, Lewin, Winnie,
& Geiger-Brown, 2010), however little information exists on the relationship between the
two conditions. The prevalence of OSA in SCD is currently not well-documented and
there is a need for studies describing the frequency, and severity of OSA in children with
SCD. OSA may impart an additional risk for developing neurological morbidity and
cognitive dysfunction.
Additionally, there is a complicated relationship between the pathophysiology of
SCD and OSA, putting children suffering from both conditions at high risk for
developing serious neurological complications and cognitive deficits. However, this
relationship has received little attention to date. The purpose of this study is to describe
the prevalence rate of OSA and examine the relationship between OSA and
2
Epidemiology and Pathophysiology of Obstructive Sleep Apnea
Obstructive sleep apnea is a severe form of sleep-related breathing disorders
(SBD) and is a common condition in both adults and children. The full spectrum of SBD
includes habitual snoring with minor or minimal disruption of sleep and no
sleep-associated hypoxemia on the mild end, and OSA syndrome (OSAS) at the higher end.
There is also an intermediate condition termed Upper Airway Resistance Syndrome
(UARS), in which increased respiratory effort associated with the heightened upper
airway resistance during sleep leads to sleep fragmentation in the absence of obvious
hypoxemia (Kheirandish & Gozal, 2006). OSAS is usually characterized by obstruction
of the upper airway and continuous respiratory effort with a normal central-nervous
system respiratory drive; central sleep apnea (CSA), a variant of the condition, is
characterized by unstable respiratory control with periods of reduced or absent breathing
activity (Jackson et al., 2011). Mixed apnea is a condition in which OSA and CSA occur
in the same individual.
OSA is a relatively common condition based on lifetime prevalence with
approximately 24% of adult males and 9% of adult females suffering from the condition.
Age is considered a risk factor with a 2- to-3-fold prevalence increase in older individuals
(65 years and above)(Young, Skatrud, & Peppard, 2004). The spectrum of SBD also
occurs in children of all ages, from neonates to adolescents. Snoring is considered the
hallmark indicator of increased upper airway resistance during sleep and is a frequent
symptom during childhood. Up to 27% of children are affected by snoring occasionally,
and 7-12% reporting habitual snoring (defined as loud snoring recognized by parents
3
spectrum, is estimated at 2-3% of all children and African-American children are
considered to be at higher risk for developing this condition (Gottlieb et al., 2003;
Tauman & Gozal, 2011).
OSAS in children is characterized by recurrent events of partial or complete upper
airway obstruction during sleep, resulting in intermittent hypoxia (complete oxygen
deprivation), hypercapnia (excessive levels of carbon dioxide), and sleep fragmentation
(Tauman & Gozal, 2011). Nighttime symptoms of OSAS in children generally include
snoring, noisy breathing, snorting episodes, labored breathing, sweating, and restless
sleep. Daytime symptoms can include mouth breathing, difficulty in waking up,
moodiness, morning headaches, nasal obstruction, and daytime sleepiness. More severe
cases of OSAS may be associated with behavioral disturbances including hyperactivity
and cognitive deficits leading to problems in learning and school functioning
(Kheirandish & Gozal, 2006). Additionally, these children may also suffer from
cardiovascular complications, compromised somatic growth, as well as depression,
enuresis, and increased health-related costs.
The most significant anatomic risk factor for OSAS in non-obese healthy children
is adenotonsillar hypertrophy (enlarged tonsils). However, OSAS is not a result of this
structural abnormality alone. Inflammation in the nasopharyngeal area is also involved in
the pathophysiology of OSAS in children (Tauman & Gozal, 2011). Studies of
adenotonsillar tissues from children with OSAS have revealed significant increases in
inflammatory cell production (Dayyat et al., 2009; Goldbart et al., 2007;
Kheirandish-Gozal et al., 2009) as well as pro-inflammatory cytokines (Kim et al., 2009). It has been
4
the adenotonsillar tissues in OSAS, respiratory viruses and recurrent vibration of the
upper airway may promote localized inflammation followed by swelling and
over-expression of inflammatory cytokines.
Neurological Complications Associated with OSA
OSA is associated with two important complications thought to underlie
neurocognitive morbidity: hypoxemia and sleep fragmentation (Sforza & Roche, 2012).
The primary diagnostic criterion for OSA is frequent periods where the individual stops
breathing for ten seconds or more during sleep. In severe patients, respiration may stop
for periods of over three minutes or occur hundreds of time per night (Jackson et al.,
2011). These episodes terminate when the patient wakes up to breathe and result in
fragmented sleep. Additionally, hypoxemia occurs during apneic events, causing a
disruption in the biochemical and hemodynamic state of the central nervous system with
blood oxygen levels reported to be at 50% below normal.
In addition, OSA is associated with increased risk of stroke and silent cerebral
infarction (Lal, Strange, & Bachman, 2012). These complications are thought to be
related to inflammatory processes which cause endothelial dysfunction leading to
constriction of blood vessels in the brain. Specifically, OSAS suppresses the vasodilator
molecule nitric oxide (NO) thereby causing blood vessel constriction and increased risk
of brain injury (Ip et al., 2000). Studies have suggested these complications are associated
with a decrease in gray matter in the hippocampus, anterior cingulate, cerebellum, and the
frontal, parietal, and temporal lobes (Canessa et al., 2011; Gale & Hopkins, 2004; Macey
et al., 2002; Morrell et al., 2003; Torelli et al., 2011) as well as decrease in white matter
5
Not surprisingly, the long-term consequences of OSAS in children include
behavioral and neurocognitive deficits. Behavioral problems are the most commonly
encountered complication of OSAS, and the vast majority of studies consistently report
some association between OSAS and hyperactivity, attention deficits, impulsivity and
attention deficit hyperactivity disorder-like symptoms. For example, one study (Rosen et
al., 2004) reported children ranging from mild to severe symptoms on the SBD spectrum
had a higher prevalence of problem behaviors with the strongest and most consistent
associations for hyperactive and aggressive behaviors. Similarly, symptoms of
hyperactivity, inattention, and aggressiveness were significantly higher than controls in a
large sample of 5-year-old children (Gottlieb et al., 2003).
In addition to the behavioral comorbidities of OSAS, there are many reports of
children with OSAS demonstrating cognitive impairments (Lal et al., 2012; Sforza &
Roche, 2012). Problems in school performance have been reported in children with
OSAS, and are associated with more extensive behavioral disturbances such as
restlessness, aggressive behavior, excessive daytime sleepiness and poor test performance
(Gozal, 1998). Impairments in executive functioning have been commonly reported in
adults with SBD and also in children (Gozal, Kheirandish-Gozal, Bhattacharjee, &
Spruyt, 2010; Naismith, Winter, Gotsopoulos, Hickie, & Cistulli, 2004). For example,
preschoolers with SBD have shown lower general intelligence, poorer executive
functioning, and poorer memory skills than unaffected peers (Beebe et al., 2004; Gottlieb
et al., 2004).
Interestingly, treatments for OSA have resulted in improvements in learning and
6
Montgomery-Downs, Crabtree, & Gozal, 2005), suggesting these neurocognitive and
behavioral deficits may be at least partially reversible in this clinical population. The
most common treatment involves the use of continuous positive airway pressure (CPAP).
This treatment has been shown to help reverse some neurological symptoms (Bedard,
Montplaisir, Malo, Richer, & Rouleau, 1993; Ferini-Strambi et al., 2003; Gale &
Hopkins, 2004) and evidence also suggests brain regions with decreased grey matter may
regain some volume following treatment (Canessa et al., 2011).
Epidemiology and Pathophysiology of Sickle-Cell Disease
SCD refers to a group of genetic disorders that are characterized by the
production of abnormal “S-type” hemoglobin (Hb-S) (Rees, Williams, & Gladwin, 2010).
Production of this type of hemoglobin occurs when a person inherits a gene for the S-type
hemoglobin from one biological parent along with another abnormal hemoglobin gene
from the other biological parent. The disease occurs most frequently in people of African
descent with about 1:400 African American newborns having the disease. Overall, close
to 100,000 persons are affected by the disease in the United States (Hassell, 2010). The
most common form of SCD is the homozygous variant called sickle cell anemia (HbSS),
found in approximately 65% of patients. The second most common form is the
heterozygous variant (HbSC), found in approximately 25% of patients. Two other
common forms of the disease include sickle β plus thalassemia (HbSβ+ - 8%) and sickle β
zero thalassemia (HbSβ0
- 2%) (Gold, Johnson, Treadwell, Hans, & Vichinsky, 2008).
Patients with the HbSS and HbSβ0
genetic sub-types tend to suffer from the most severe
complications (termed here “high risk genotypes”), while those with the HbSC and
HbSβ+
7
symptoms associated with SCD include episodes of pain, acute chest syndrome,
pulmonary hypertension, neurological complications (including stroke and silent cerebral
infarcts), hemolytic anemia, priapism, and organ damage such as osteonecrosis, and renal
failure (Kato, Gladwin, & Steinberg, 2007).
Despite these severe complications, life expectancy for individuals with SCD has
improved over the last several decades from only about 50% of all patients with SCD
surviving beyond the age of twenty (Prabhakar, Haywood, & Molokie, 2010) to median
ages at death of 42 and 48 for men and women (respectively) with sickle cell anemia, and
60 and 68 for men and women with hemoglobin SC disease (Platt et al., 1994). As life
expectancy continues to improve, more attention needs to be paid to the serious
neurocognitive complications associated with SCD, which have a significant negative
impact on quality of life (McClellan, Schatz, Sanchez, & Roberts, 2008; Panepinto,
O'Mahar, DeBaun, Loberiza, & Scott, 2005).
The pathophysiology of SCD primarily results from the production of sickle
hemoglobin (Hb-S). This type of hemoglobin, under low oxygen conditions (as found in
distal arteries in the body), causes red blood cells (RBCs) to take on an abnormal crescent
shape, become more viscous, lose oxygen carrying capacity, and break down prematurely
(Rodgers, 1997; Steinberg, 2008). When Hb-S molecules in RBCs are deoxygenated, the
cell wall polymerizes, deforming the cell’s shape and weakening its structure. Multiple
cycles of oxygenation and deoxygenation ultimately lead RBCs to become permanently
sickled and breakdown prematurely. The cells’ abnormal shape and early breakdown
8
occlusion and constriction of blood vessels, as well as lower oxygen carrying capacity,
hemolytic anemia, and organ damage.
Occlusion will likely first occur in smaller blood vessels when sickle cells adhere
to vascular endothelium, causing further obstruction as platelets and white blood cells
(WBC) also become entrapped (Steinberg, 2008). Larger vessels leading to the lungs and
brain can also become occluded, likely due to injury of the endothelial wall, which causes
an inflammatory reaction. Increased levels of cytokines due to inflammation also play an
important role in vaso-occlusion by enabling RBCs to stick to vascular endothelium
(Pathare, Kindi, Daar, & Dennison, 2003). Evidence suggests that a multitude of other
factors related to elements in the sickle cell, on the cell, the endothelial cells, and other
elements in the vascular walls and plasma are related to vaso-occlusion pathophysiology;
however, the exact mechanisms are not yet fully understood (Steinberg, 2008).
Hemolytic anemia is another important disease mechanism that mainly results
from the breakdown of RBCs within blood vessels (hemolysis) (Abboud & Musallam,
2009). Increased amounts of free hemoglobin that is released into the blood stream
rapidly react with the nitric oxide (NO) molecules and convert them to nitrite. Normally,
NO plays a crucial role in vaso-dilation and its decreased bioavailability results in further
constriction of blood vessels.
Neurological Complications Associated with SCD
Together, hemolytic anemia and vaso-occlusion put patients with SCD at high
risk for developing cerebro-vascular disease (Schatz & Puffer, 2006). Direct effects of
SCD on the brain include strokes and silent cerebral infarcts, as well as localized
9
is rare in childhood, but cerebral lesions from stroke and silent cerebral infarcts occur in
approximately 20% of children with HbSS (Pegelow et al., 2002). In SCD, hemolysis can
lead to insufficient oxygen and glucose delivery to the brain, resulting in deficits in brain
function without structural tissue death (Powars et al., 1999; Reed, Jagust, Al-Mateen, &
Vichinsky, 1999), and is also linked to higher rates of stroke (Abboud & Musallam,
2009; Kato et al., 2007; Kwiatkowski et al., 2009). Imaging studies in children with SCD
have found considerable variability in the location of neurological damage (Grueneich et
al., 2004; Hogan, Vargha-Khadem, Saunders, Kirkham, & Baldeweg, 2006; Kwiatkowski
et al., 2009; Pegelow et al., 2002; Wang et al., 2008). The majority of patients appear to
have lesions involving the frontal lobe, followed by the parietal lobe, the basal ganglia,
thalamus, and the temporal lobe. Many children have more than one lesion that often
spans more than one lobe or region. Lesions tend to encompass both cortex and white
matter and frequently occur in border zones between middle and anterior cerebral arteries
(Kirkham, 2007). More diffuse brain effects are also seen in this population across
different regions of gray matter, which may represent neuronal changes caused by
chronic oxygen deprivation induced by hemolytic anemia (Steen et al., 2003).
In addition to overt stroke or silent cerebral infarcts, there appears to be additional
sources of cognitive deficits in children with sickle cell disease with a number of
mechanisms that have been put forth as potential etiological sources such as pre-term
birth, and/or low birth-weight (particularly if the mother has SCD), brain perfusion
deficits without cerebral infarction, and other more speculative mechanisms (Schatz &
Puffer, 2006). For example, pre-term birth can result in white matter injury and decreased
10
also show nutritional deficiencies compared to controls. This may be due to increased
metabolic demands related to their disease that are not met, and acute periods of illness
and hospitalizations (Schatz & Puffer, 2006). Nutritional deficits may also be associated
with cognitive deficits in these children (Puffer, Schatz, & Roberts, 2009).
Taken together, disease processes related to hemolytic anemia, vaso-occlusion,
and other factors put children with SCD at high risk for neurocognitive impairments.
Studies have suggested that children with SCD who have suffered from overt stroke have
experienced an average of a 10-15 point decline in IQ scores compared with normative
age groups as well as significant educational attainment deficits (Schatz & McClellan,
2006). Cognitive deficits that impact academic performance are also common in
approximately 75% of children suffering from silent cerebral infarcts (Schatz, Brown,
Pascual, Hsu, & DeBaun, 2001). Children with SCD and no known brain insults have
been found to have specific deficits in attention and executive functions, which include
inhibition, planning, organization, sequential processing, response monitoring, decision
making, judgment, reasoning, mental flexibility and working memory (Berkelhammer et
al., 2007). Deficits in working memory are especially important as they can limit
performance in other areas such as problem solving and language comprehension,
ultimately leading to lower academic attainment (Schatz, 2004). For example, in one
study children with high-risk genetic subtypes have been found to have deficits in several
language domains (Schatz, Puffer, Sanchez, Stancil, & Roberts, 2009). Cognitive deficits
can be shown early in the pre-school period in high-risk subtypes of SCD (Schatz &
11
studied to date, if these occur, they are most likely to happen later in the
middle-childhood period (Schatz et al., 2009).
Epidemiology of Co-occurring SCD and OSA
The population prevalence of SBD, including OSA, in children with SCD is not
well-documented, though several studies have examined base rates in relatively small
samples of convenience. There is a high occurrence of SBD, ranging from 44% to 79%,
among children with SCD referred due to concerns about sleep. Studies examining
children that were not selected based on clinical concerns have suggested prevalence
rates of approximately 20%, which appears much greater than the prevalence of 1-4% in
children without SCD (Strauss et al., 2012). Additionally, there is a reported high
prevalence (55%) of obstructive adenotonsillar hypertrophy in children and adolescents
with SCD, a primary cause of OSA that is also linked with an increased risk of
cerebrovascular morbidity (Abou-Elhamd, 2012). One study by Brooks and colleagues
(1996) reported 44% of children with SCD referred for evaluation of OSA were
diagnosed with the condition as measured by over-night polysomnography. In another
study with a small sample of children (n=19), Kaleyias and colleagues (2008) reported
63% of patients with SCD referred for evaluation were found to have OSA as measured
by polysomnography. The highest prevalence rate in children referred for OSA
evaluation was 69% (Rogers et al., 2010). A more conservative prevalence rate of 19.4%
was reported by Strauss and colleagues (2012). This study measured rates of OSA from a
sample of children with SCD who were not pre-screened for OSA-related symptoms,
which is a better estimate of prevalence rate than prior studies examining children
12
(Goldstein et al., 2011) in a sample of only high-risk genetic subtypes of SCD (HbSS and
HbSβ0
). Results from these studies suggest SBD are common in SCD, though better
studies of prevalence rates are needed as well as an understanding of the screening
procedures that lead physicians to recommend an evaluation for OSA diagnosis.
Research to-date suggests that OSAS affects children across the spectrum of SCD
severity, but it is unclear whether there are differences in severity between genetic
sub-types. Brooks and colleagues (1996) reported no statistically significant differences in
OSA severity between mild and severe SCD genetic subtypes. However, this study had a
small sample size (n=28) and therefore, conclusions are difficult to make. Similarly,
Daniel and colleagues (2010) reported no statistically significant differences in SBD
between mild and severe SCD patients in a larger sample of children (n=54); differences
in severity of OSA were meaningful when the SCD group in its entirety was compared to
healthy controls. Countering these results, others have found that patients with more
severe SCD genetic subtypes (HbSS) had more OSA symptoms than those with
lower-risk subtypes (HbSC) (Rogers et al., 2010). The reported lack of differences in OSA
symptoms between mild and severe genetic subtypes of SCD in some studies is
surprising since patients with more severe disease tend to suffer from more
complications. Results from these studies may suggest that OSA could serve as a useful
predictor of other complications such as neurocognitive morbidity over and above one’s
genetic subtype. However, the conflicting conclusions emerging from the literature do
not lend themselves to making strong statements about sleep apnea across SCD genetic
13
The methods of screening and selection criteria across studies of SBD differ,
which may help account for some of the discrepant findings. Notably, several studies
reported prevalence rate of OSA in groups of children who were referred for OSA
evaluation. However, initial screening methods to determine those children that should be
evaluated varied among studies. Studies recruited participants who had suspicious
symptoms of OSA as evaluated by their primary care physician (Brooks et al., 1996),
used established questionnaires (Kaleyias et al., 2008), established clinical guidelines
(Maddern, Reed, Ohene-Frempong, & Beckerman, 1989; Rogers et al., 2010) or did not
use or report the screening procedure (Goldstein et al., 2011; Strauss et al., 2012). This
variability reflects different screening methodologies as well as sampling decisions
(pre-screening vs. no (pre-screening) which likely account for some of the observed variability in
prevalence rates and could confound the examination of morbidity associated with SBD.
Surprisingly, although considered clinically important (Kemp, 1996), studies did
not report prevalence rates of OSA by age in children with SCD. In one report that
focused only on OSA (Jackson et al., 2011), the authors mentioned that age can be
considered a risk factor for OSA, but no studies to date have addressed this potentially
significant relationship in the SCD population. Given that OSA has been reported to
occur in children across a wide range of age, there is a need for studies to better
characterize how the prevalence of OSA varies by age.
Common Pathophysiological Mechanisms of SCD and OSA
Hypoxia and hypoxemia are thought to be important drivers of red blood cell
(RBC) polymerization and sickling in SCD. OSA is associated with hypoxia, but other
14
polymerization of sickle RBCs (Okoli, Irani, & Horvath, 2009). Additionally, sickle cells
tend to adhere to vascular endothelium, causing vaso-occlusion, and hypoxia may induce
adhesion of these cells to vascular walls, thereby exacerbating symptoms further
(Sultana, Shen, Rattan, Johnson, & Kalra, 1998). Recently, it has also been suggested that
neurocognitive deficits tend to coexist with endothelial dysfunction in children with
OSAS, and that both of these consequences may share similar pathophysiological
mechanisms (Gozal et al., 2010). Changes in brain metabolic function and systemic
inflammatory responses have been identified as potential factors in these complications
(Gozal, Crabtree, Sans Capdevila, Witcher, & Kheirandish-Gozal, 2007).
Hypoxia induced by OSA may also lower the bioavailability of nitric oxide (NO)
in the blood, thereby increasing vasoconstriction and the risk for developing neurological
complications such as stroke and silent cerebral infarcts (Kaleyias et al., 2008; Kirkham
et al., 2001; Prengler, Pavlakis, Prohovnik, & Adams, 2002). The combined pathological
effects of OSA and SCD on NO bioavailability make this sub-population particularly at
risk for developing neurological complications.
Another important common factor in the pathophysiology of SCD and OSA,
pro-inflammatory cytokines can be activated as a response to infection and cause
inflammatory responses. Persons with SCD suffer from many infections due to factors
such as tissue ischemia and spleen dysfunction (Rees et al., 2010) potentially making
them more vulnerable to the pathophysiologic effects of cytokines. Inflammatory
processes related to SCD and OSA may be exacerbated by cytokines and put patients at
risk for further complications (Conran, Franco-Penteado, & Costa, 2009). Cytokines have
15
Sciacca, Pinto, & Licata, 2008; Tuttolomondo et al., 2009). Specifically, cytokines are
found in the central nervous system and are activated after cerebro-vascular injury has
occurred. They in turn produce pro-inflammatory and pro-coagulant effects on
endothelium. It may be that hemolytic anemia that is associated with increased stroke risk
(Abboud & Musallam, 2009), leads to cerebro-vascular injury that in turn produces more
inflammation. Interestingly, a recent study (Ameringer & Smith, 2011) has also
suggested that fatigue, a common symptom in SCD, may be related to the action of
cytokines that are activated in response to vascular injury and can interrupt sleeping
patterns. It may be that interrupted sleeping patterns related to hypoxia and OSA also
induce further cytokine activity and exacerbate sickle cell adhesion, vaso-occlusion,
vaso-constriction, and risk for neurological complications and associated cognitive
dysfunction.
Blood flow velocity in the middle cerebral artery as measured by transcranial
Doppler (TCD), which provides an indication of the adequacy of brain blood flow
velocity, has emerged as an important predictor of cognitive outcomes for children with
OSAS (Hogan, Hill, Harrison, & Kirkham, 2008) and for children with SCD (Hogan,
Kirkham, et al., 2006; Hogan, Pit-ten Cate, Vargha-Khadem, Prengler, & Kirkham, 2006;
Sanchez, Schatz, & Roberts, 2010; Schatz, McClellan, Puffer, Johnson, & Roberts,
2008). TCD is a screening tool commonly used to identify children with high risk of
stroke in SCD (Adams, 2005; Quinn & Sargent, 2008) and can detect large-vessel
cerebrovasculopathy. Abnormally high blood-flow velocities in these vessels are related
to stroke, stenosis, severe anemia, and tissue hypoxia and therefore could be an indicator
16
however, the relationship between brain blood flow velocity and cognitive deficits in
children with SCD suffering from OSA has only been examined in one investigation
(Kirkham et al., 2001). These authors reported that elevated brain blood flow velocities as
measured by TCD and OSA severity were associated with higher rates of neurocognitive
morbidity. Given the overlap in underlying disease mechanisms of SCD and OSA, there
is a further need to investigate the use of TCD as an indicator of cognitive risk in children
who suffer from co-occurring SCD and OSA.
Surprisingly, few investigations to date have attempted to address the link
between SCD and OSA in studying neurocognitive morbidity associated with these
conditions. Robertson and colleagues (1988) reported on one six-year-old child with SCD
and OSA who suffered from stroke. The authors suggested that severe OSA and related
hypoxemia played a major role in precipitating the stroke and therefore the presence of
OSA should be considered an important indicator of stroke risk. The most comprehensive
study in this area was conducted by Kirkham and colleagues (2001) who prospectively
followed 95 children with SCD, measuring cerebral blood flow velocity and night-time
oxygen saturation. Of this sample, nineteen children who later suffered from strokes had
significantly higher cerebral blood flow velocities and lower oxygen saturation. A more
recent investigation (Hollocks et al., 2012) was the first to utilize magnetic resonance
imaging (MRI), as well as neuropsychological measures to examine the relationship
between SCD, OSA and neurocognitive dysfunction. Although only reporting from a
small sample (n=10), this study found that higher OSA severity was associated with
lower cognitive functioning, particularly on measures of executive function. From the
17
investigation. Studies are needed to elucidate the relationship between OSA and SCD and
their potential interactive effects on cognitive functioning in children. Given the evidence
that some children with SCD have been found to suffer from cognitive deficits in the
absence of cerebral infarcts (Berkelhammer et al., 2007; Schatz & McClellan, 2006),
OSA may be an important additional factor that accounts for cognitive deficits. This may
be especially relevant in light of evidence suggesting that treating OSA can reverse some
of its negative effects on cognitive functioning (Friedman et al., 2003; Gozal & Pope, 2001;
Montgomery-Downs et al., 2005).
Summary
Review of the literature on SCD and OSA has revealed significant variability in
prevalence rates of OSA occurring in children with SCD. Studies to date have not
adequately clarified the exact screening procedures used to decide which children should
be referred for evaluation of OSA. Variability in these procedures has likely contributed
to the large range (5-79%) of prevalence rates reported in the literature. Moreover,
studies have not yet established prevalence rates by age and there is a need for further
research to describe the potential relationship between age and prevalence of OSA in
children with SCD.
Additionally, multiple studies have reported neurocognitive complications in
children with OSA, or SCD but the literature linking these two conditions is severely
lacking. Only a handful of reports (Hollocks et al., 2012; Kirkham et al., 2001; Robertson
et al., 1988) have attempted to investigate the extent of neurocognitive morbidity in
children located at the intersection of these two debilitating conditions. Given the
18
children suffering from the two conditions are at a particularly high risk for developing
neurocognitive complications, highlighting the importance of further research in this area.
Aims and Hypotheses
The first aim of this study is to describe the prevalence rate of OSA in children
with SCD and examine factors that impact the prevalence rate. We examine prevalence
rates as measured in a large, representative sample of children with SCD as well as in the
sub-sample referred for OSA evaluation after screening.
Hypothesis 1A: Based on previous reports (Strauss et al., 2012), we hypothesize that the prevalence rates of OSA in the total sample should be approximately one in five
(20%). In the sub-sample of children who were referred for OSA evaluation due to
concerns about snoring, we hypothesize prevalence rates to be higher; for the purposes of
this study we will describe the proportion of true positives (children correctly identified
as having SBD) for this procedure.
Hypothesis 1B: The research to date has presented conflicting evidence as to the prevalence of OSA across SCD genetic subtypes. Since patients with the HbSS and
HbSβ0
genetic sub-types tend to suffer from the most severe complications, while those
with the HbSC and HbSβ+
variants tend to experience milder symptoms (Kirkham, 2007),
we hypothesize that rates of OSA will differ between low risk (HbSC and HbSβ+) and
high risk (HbSS and HbSβ0) subtypes with the high risk group showing higher rates.
Additional Goal: We aim to describe the relationship between age and OSA in children with SCD. The paucity of research addressing the relationship between age and
prevalence rates of OSA in children with SCD compels this goal to be less specific
19
The second aim of this study is to examine the relationship between OSA and
neurocognitive morbidity in children with SCD.
Hypothesis 2: Based on the demonstrated relationship between OSA and cognitive dysfunction (Gottlieb et al., 2004; Gottlieb et al., 2003; Jackson et al., 2011;
Kheirandish & Gozal, 2006; Rosen, 2004; Rosen et al., 2004), we hypothesize that
children with OSA will exhibit more neurocognitive morbidity than those without OSA.
Children with SCD and OSA will be compared to children with SCD but no OSA,
statistically controlling for low vs. high risk genotype. We will examine functioning in
areas of language, processing speed, visual-motor abilities, and academic skills.
Additional goal (1): Based on previous research, symptoms of hyperactivity, inattention, and aggressiveness have been found to be higher in children with OSA
(Gottlieb et al., 2003; Gozal, 1998). We will describe differences between groups on
these variables using the Strengths and Difficulties Questionnaire (SDQ). We will
additionally explore group differences on other dimensions of the SDQ including peer
and emotional problems.
Additional Goal (2): we aim to explore other areas of morbidity such as cerebral blood flow, pain, stroke, and hospitalizations for infections. We hypothesize that OSA
will be associated with greater morbidity. Additionally, children with OSA are
hypothesized to exhibit higher brain blood velocities as measured by TCD (Kirkham et
al., 2001) than unaffected peers.
Additional Goal (3): we aim to describe sleep study variables for the OSA group and examine differences in OSA severity between low and high risk genetic subtypes.
20
Chapter 2: Methods
Participants
Participants were children with SCD receiving routine medical care at a pediatric
hematology/oncology outpatient clinic in the southeastern USA. Approximately 450
families attend the clinic annually for their children’s medical care. Medical chart
reviews were conducted for a total of 300 children with SCD who were screened for OSA
as part of their routine care between April 2002 and April 2013. A search of the medical
record system using specific diagnostic codes for snoring, and OSA as defined by the
International Statistical Classification of Diseases and Related Health Problems (ICD-10)
(World Health Organization., 2004) identified 171 children. Chart reviews were then
conducted for a sample of 129children with SCD with negative screenings for OSA that
served as a control group. A case-control matching system was used for matching the two
groups according to age (within 4 months for children less than six years; within 6
months for children 6 -12 years; within 12 months for children 13 years and older),
genotype, gender, and the control closest in hemoglobin level from the most recent
routine blood lab, though minor deviations from this matching criteria occurred as
described below.
Additional record reviews were later conducted, as described below, that allowed
us to identify children who had overnight polysomnography exams, but who had not been
assigned one of the diagnostic codes above. Data were collected from electronic and
21
genetic subtype based on electrophoresis, routine blood lab results, height, weight, and
body mass index (BMI). In addition, information was collected pertaining to history of
preterm birth, and history of major disease complications including hospitalizations, pain,
acute chest syndrome, pneumonia, transfusions, splenic sequestration, infection, leg
ulcers, pulmonary hypertension, hydroxyurea treatment, and neurological complications,
as well as TCD results.
Inter-rater reliability for the medical record reviews was assessed. 25% of the
records (n = 68) were selected at random and reviewed by a secondary coder blinded to the first coder’s data. Inter-rater reliability was very good to excellent. Kappa values
ranged from .87 to 1.0 for variables with narrow response ranges. Two variables,
episodes of pneumonia and pain requiring hospital care, had large enough ranges to be
considered ordinal rather than nominal. In such cases the kappa statistic is problematic as
it is used generally used with nominal variables. Rank-order correlation were used for
these variables and yielded values of r = .98 and .97, respectively.
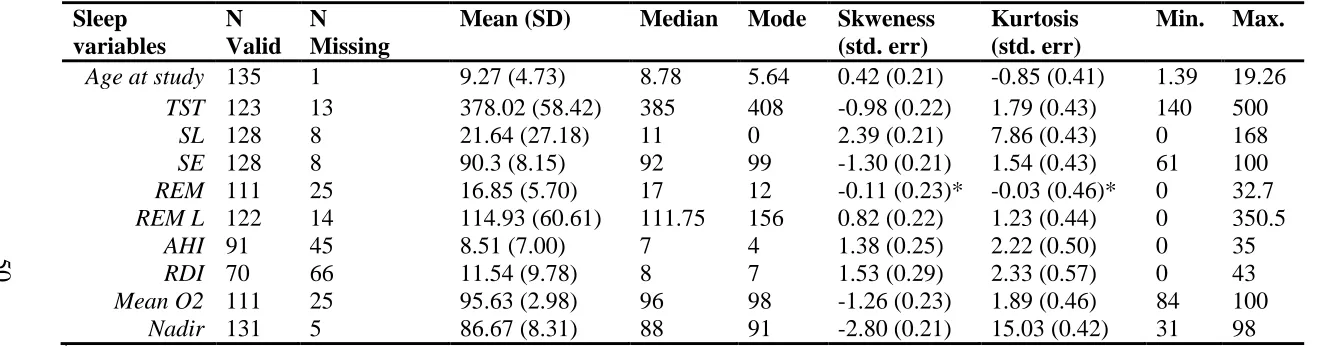
For the sub-sample receiving overnight polysomnography exams, additional
variables related to sleep apnea were collected for descriptive purposes. These included
general sleep variables such as total sleep time, sleep onset latency, sleep efficiency,
REM sleep latency, and % REM sleep. Information on respiratory functions was
collected including the apnea/hypopnea index (AHI) and/or respiratory disturbance index
(RDI) as well as oxygen saturation (mean saturation and lowest saturation during sleep).
OSA diagnosis was made based on results of overnight polysomnography. Of note,
children who received a diagnostic code for OSA or snoring but did not have a sleep
22
28) were excluded from the OSA group even if their chart indicated an OSA diagnostic
code. Medical record reviews were conducted on these cases for descriptive purposes.
All children seen at the clinic were also offered routine cognitive screening exams
at the beginning of middle childhood (approximately 5-7 years of age) since September
of 2004 with over 90% of children participating in this routine screening. Because some
children attend visits only every six months and there are occasional missed
appointments, children as early as 4 years, 9 months or as late as 8 years, 3 months were
also included to ensure that every child had the opportunity to participate in the
screening.
Children who took part in the screening completed a battery of cognitive tests
administered in a single, 60- to 90-minute session. Assessments were completed in the
clinic during routine appointments by licensed psychologists or graduate students trained
in administration of the measures according to the standardized testing procedures
provided in the test manuals. Children who were experiencing fatigue or pain on the day
of testing were rescheduled for their next clinic visit. Caregivers received letters with
results and a phone call to discuss recommendations, such as further psycho-educational
testing, if results suggested possible cognitive difficulties.
OSA Screening and Diagnosis
Screening Procedure
All patients are screened for symptoms of OSA at routine appointments. The
hematologist asked parents whether the child is snoring. If they answered in the
affirmative, follow-up questions include information on whether the snoring is loud and
23
questions prompted a referral for a sleep study to evaluate OSA symptoms. Additionally,
the hematologist asked parents whether the child experiences early morning headaches
and/or pain. The presence of these symptoms along with snoring also prompted and a
referral to evaluate OSA symptoms. A diagnostic code for snoring is usually assigned in
the medical record at this time.
Polysonomography
Polysomnographyis the electrographic recording of simultaneous physiologic
variables during sleep and is currently considered the gold standard for objectively
assessing sleep disorders (Roland et al., 2011). The polysomnogrpahy procedure and
diagnosis of OSA are based on the current recommended guidelines for the evaluation of
sleep disorders (Loughlin et al., 1996). Children who were referred for a diagnostic
evaluation of sleep disorders underwent overnight polysomnography using the Cadwell
Sleep System (Cadwell Laboratories, Inc. Kennewick, WA). A total of 16 channels were
monitored including four electroencephalography (EEG) channels measuring electrical
activity along the scalp, two electrooculography (EOG) channels measuring electrical
activity associated with eye movements, and two leg electromyography (EMG) channels
measuring electrical activity from skeletal muscles. Together these channels are used to
determine wake/sleep state and arousals. Additionally, channels for electrocardiography
(EKG) measuring heart rate changes and potential arrhythmias, as well as a snoring
microphone, oxygen saturation, oronasal flow thermistor, abdominal respiratory
movement, chest respiratory movement, chin EMG, and plethysmography used to
measure chest and abdominal respiratory effort and discriminate between nasal and oral
24
Measures
The neuropsychological measures used in the screening procedure assessed
language abilities, processing resources, visual-motor ability, and academic skills. Each
of these measures were recently found to have robust effect sizes for differences between
children with SCD at high risk for cognitive deficits and those with low risk or controls
(Schatz et al., 2009). Therefore, they are likely to be sensitive in detecting deficits in this
clinical population.
Test of Language Development-Primary: Third Edition (TOLD-P:3).
In the screening procedure, children’s language abilities were assessed with three
subtests taken from the Spoken Language Quotient of the TOLD-P:3 (Newcomer &
Hammil, 1997) with one subtest from each of three language domains assessing syntactic,
phonemic, and semantic processing abilities. Alpha coefficients for all TOLD subtests
administered range from .80 to .91, and test-retest reliability coefficients range from .81
to .91, indicating high reliability across subtests. In addition, for African-Americans
specifically, internal consistency reliability data reflects alpha values of .86 to .96 for
subtests chosen for this study. Adequate validity of the TOLD has also been supported by
analyses of item discrimination, item difficulty, and concurrent validity with similar
language measures. In addition, item response theory analysis has shown very low
cultural and gender bias on the TOLD.The syntactic domain was assessed using the
Grammatical Understanding subtest requiring the child to select a picture that best
demonstrates the meaning of sentences with increasingly complex syntax. Phonological
processing was assessed using the Word Discrimination subtest, which requires the child
25
words. Lastly, the semantic domain was measured via the Oral Vocabulary subtest, which
requires children to provide definition for orally presented words.
Tests of other cognitive abilities
The Decision Speed subtest from the Woodcock-Johnson test of Cognitive
Abilities, 3rd edition (Woodcock, McGrew, & Mather, 2001b) was used to assess
processing speed. High reliability coefficients have been reported for this subtest in five
to seven year olds (range = .78 to .90). Psychometric data also suggest adequate construct
validity, as well as low cultural bias. The Letter-Word Identification and the Applied
Problems subtests from the Woodcock-Johnson test of Achievement, 3rd edition
(Woodcock, McGrew, & Mather, 2001a) were used to assess academic/pre-academic
skills. High reliability coefficients have been reported for these subtests as well (range =
.92 to .99). Validity data from the WJ-III Tests of Achievement has shown adequate
construct validity, as well as low cultural bias.Lastly, the Beery-Buktenica
Developmental Test of Visual-Motor Integration (DTVMI), 5th edition (Beery & Beery,
2004)was used to assess visual-motor capabilities. Reliability coefficients for the Beery
VMI are all above .80, and validity data show evidence of construct and concurrent
validity.
Strengths and Difficulties Questionnaire
Parents completed the Strengths and Difficulties Questionnaire (SDQ) (Goodman,
2001) as part of the screening procedure. The SDQ is a brief behavioral screening
questionnaire designed for children aged 3-16 years. It is comprised 25 items intended to
measure five scales including emotional symptoms, conduct problems,
26
yields a score for the specific dimension being assessed; additionally, the scores can be
summed to yield a total score for the measure. The SDQ is commonly used for clinical
assessment and screening for psychological disorders in normal child populations
(Goodman, Ford, Simmons, Gatward, & Meltzer, 2000) and also in children with chronic
illness (Glazebrook, Hollis, Heussler, Goodman, & Coates, 2003). Internal consistency
reliability for the SDQ is considered satisfactory (mean Cronbach’s α = .73), as well as
reliability measured by cross-informant correlation (mean r = 0.34), or retest stability after 4 to 6 months (mean r = 0.62) (Goodman, 2001). The SDQ has demonstrated construct validity with scores above the 90th percentile predicting a substantially raised
probability of independently diagnosed psychiatric disorders (mean odds ratio: 15.7 for
parent scales, 15.2 for teacher scales, 6.2 for youth scales) (Goodman, 2001). In another
study, multi-informant (parents, teachers, older children) SDQ scores have identified
individuals with a psychiatric diagnosis with a specificity of 94.6% (95% Cl 94.1-95.1%)
and a sensitivity of 63.3% (59.7-66.9%) (Goodman et al., 2000).
Data Analysis
Hypotheses 1A and 1B: To address the first aim of this study, analyses will be conducted to examine the prevalence rate of OSA in a clinic-wide sample across ages and genetic
sub-types. Prevalence rates will be calculated along with a 95% confidence interval.
Binomial proportion confidence intervals were calculated with the Wilson score interval
(Newcombe, 1998). The rates of OSA in children referred for evaluation in this sample
will also be described. Differences in prevalence of OSA between genetic subtypes (low
27
analyses will also be reported for cases in which an OSA diagnostic code was provided
without a sleep study.
Additional goal: Histograms and descriptive statistics will be used to describe prevalence rate of OSA by age and the relationship between the variables.
Hypothesis 2: To examine the differences in cognitive functioning, multivariate analysis of covariance (MANCOVA) procedures will be used with group (SCD and SCD/OSA) as
the independent variable and cognitive measures as the dependent variables. SCD risk
(“high risk” vs. “low risk” genotype) will be used as a covariate in the analysis. Two
MANCOVAS will be used to examine group differences in language functioning (TOLD
subtests), and academic skills (WJ-III Letter-Word Identification and Applied Problems).
Two ANCOVAs will be used to examine differences in processing speed (WJ-III
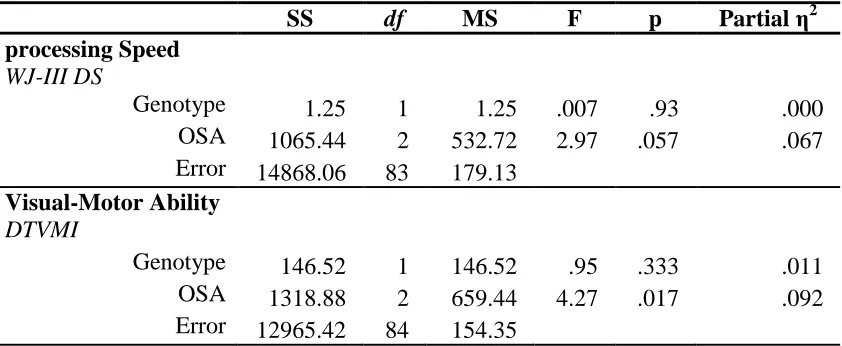
Decision Speed) and visual spatial ability (Beery VMI). Alpha of 0.05 will be used for
statistical significance. Additional exploratory analyses were conducted to examine if
severity of sleep apnea was related to cognitive functioning. Sleep study clinical
categorization (mild vs. severe sleep apnea) was examined with similar MANCOVA and
ANCOVA models as described above. Correlations between cognitive test performance
and the sleep study variables of mean nocturnal oxygen saturation and minimum
nocturnal oxygen saturation were examined based on their previous association with SCD
morbidity (Hargrave, Wade, Evans, Hewes, & Kirkham, 2003; Kirkham et al., 2001).
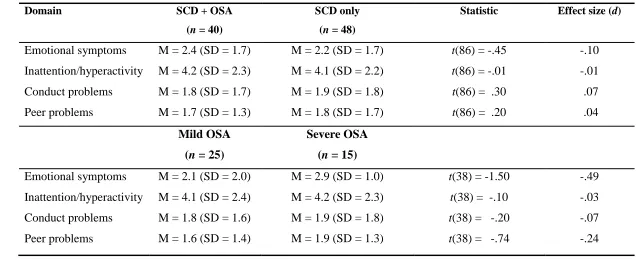
Additional goals (1) and (2): Between-group t-tests will be used to describe differences in hyperactivity, inattention, and aggressiveness (conduct problems) as well as emotional
symptoms and peer relationship problems as indicated by the Strengths and Difficulties
28
medical record reviews to assess the hypothesis of higher SCD morbidity in children with
OSA. Morbidities will be organized into groupings to capture a profile of morbidity
types for descriptive purposes. There was significant positive skew in these variables.
Therefore, Mann Whitney U tests were used to avoid the influence of outliers on results.
Z-scores from the Mann Whitney U were used as the test statistic given the sample size.
An alpha level of 0.05 was used to evaluate each hypothesis.
Additional goal (3): Statistics for sleep study variables will be examined for descriptive purposes. Between-group t-tests will be used to describe differences in OSA severity for
the low and high risk genetic subtypes. All group comparisons will have an alpha level of
29
Chapter 3: Results
Sample Description
The clinic-wide sample consisted of 641 individuals (46.33% female) ranging in
age between 4 months and 32 years at the time of medical record reviews who carry a
diagnosis of SCD (M = 11.5; SD = 6.9). The major genetic subtypes identified were
HbSS (58.2%), HbSC (25.7%), HbSβ+ (12.2%), and HbSβ0 (2.2%). 1.1% of cases were
identified as “other” genetic subtypes. The chart review identified 171 cases (26.68%;
95% CI 23.4% - 30.24%) as positive screenings for OSA based on diagnostic codes
provided in their medical record or sleep study results indicating an OSA diagnosis. Of
the positive screenings, 143 cases (83.63%; 95% CI 77.36% - 88.43%) had sleep studies
conducted. The 28 remaining cases had no sleep study data available because it could not
be obtained or was not done. Therefore a positive OSA diagnosis could not be made or
confirmed from sleep study results. These cases were not used in computing the overall
proportion of OSA cases in the total sample. Of the 143 positive screenings, 7 cases (5%;
95% CI 1.43% - 8.57%) did not receive an OSA diagnosis in the medical record
following a sleep study. Figure 3.1 presents a flow chart for OSA screening and sleep
study results.
The matched control group consisted of 129 individuals matched by age (within 4
months for children less than six years; within 6 months for children 6 -12 years; within
12 months for children 13 years and older), genotype, gender, and the control closest in
30
(81.62%). In cases where a precise match was not possible, we attempted to first match
by genotype followed by age, closest hemoglobin level, and gender. In 4 cases (2.94%)
where an exact match by genotype was not possible, we matched participants by similar
genotype (“milder” vs. “more severe”). Due to an uneven distribution of cases by age, 13
cases (9.56%) were matched outside of the desired age range. In these cases, the mean
number of months outside the specified age range was M = 16.1; SD = 8.98 and ranged
from 7 to 38 months. The median number of months was 13. One case (.75%) was not
matched by gender. Lastly, we were unable to locate an appropriate match for 7 of the
136 OSA cases (5.15%) among children with negative screenings. The 7 cases with
positive screenings, but negative sleep study exams were used to complete the matching
process with an equal number of cases and controls.
Hypothesis 1A
Based on previous prevalence estimates (Strauss et al., 2012), we hypothesized
that the prevalence rates of OSA in the total sample should be approximately one in five
(20%). This hypothesis was supported. In the clinic-wide sample, 136 cases (21.22%;
95% CI 18.23% – 24.55%) of individuals were diagnosed with some form of OSA based
on sleep study data. The screening procedure employed at the clinic correctly identified
136 of 143 cases referred for a sleep study (hit rate = 95.1%; 95% CI 90.23% - 97.61%).
The hit rate was determined by dividing the number of confirmed OSA cases based on a
sleep study (n = 136) divided by the number of positive screenings (n = 143). Hypothesis 1B
We hypothesized that rates of OSA will differ between” low risk” (HbSC and
HbSβ+) and “high risk” (HbSS and HbSβ0
31
showing higher rates. Of note, we identified three relatively rare variants of the disease as
part of the chart review. Three cases of HbS/o Arab and two cases of HbS/D were also
included in the analysis as part of the “high risk” group; two cases of HbS/HPFH-1 were
included in the “low risk” group (Rees et al., 2010). Of the 396 cases (61.78%) included
in the “high risk” group, 108 cases were diagnosed with OSA (27.27%; 95% CI 23.12% -
31.86%). In the “low risk” group, of 245 cases, only 28 cases (11.43%; 95% CI 8.03% -
16.02%) received an OSA diagnosis. Therefore, our hypothesis was supported.
Individuals with genetic subtypes that are associated with more severe complications also
suffered higher rates of OSA. Individuals with more severe genetic subtypes were
approximately 2.5 times more likely to have OSA.
We conducted separate analyses for the group of cases (n = 28) who received a
positive screening for OSA but for whom a sleep study could not be found. Eighteen
cases had a “high risk” genetic subtype (64.29%; 95% CI 45.83% - 79.3%) while 10
cases had a “low risk” variant (35.71%; 95% CI 20.7% - 54.17%). It is unclear whether
individuals who were positively identified during the screening procedure actually had
OSA.
Additional Goal:the relationship between age and OSA
Figure 3.2 displays a histogram of age (in years) at time of sleep study for the
OSA group. One case did not have the sleep study date and therefore age at time of sleep
study could not be computed. The mean age of OSA diagnosis for the remaining 135
cases was M = 9.27; SD = 4.73 ranging from 1.39 to 19.26 years of age. The median and
modal ages were 9 and 5 respectively suggesting a positively skewed shape. The obtained
32
therefore the curve may be considered as significantly deviating from a normal shape.
The results indicate that in our sample most children reported symptoms and were
diagnosed around 5 years of age followed by a decline between ages 6-8 and a sharp rise
in diagnoses around age 9. Most patients (64.4%) were diagnosed on or before their 10th
birthday; it is clear, however, that OSA diagnoses frequently occurred during the second
decade of life as well.
Our second aim was to examine the relationship between OSA and
neurocognitive morbidity in children with SCD. We first examined the time lag between
cognitive testing and OSA diagnosis. On average, children received an OSA diagnosis
approximately 0.85 years after cognitive testing (SD = 2.5), with a median time to
diagnosis of 0.46 years after testing, ranging between 3.5 years prior to testing to 7.9
years after testing. We further examined the time lag by OSA severity (mild vs. severe).
The mild OSA group received an OSA diagnosis 1.2 years after testing on average (SD =
2.6) with a median time of .72 years, ranging between 3.5 years before testing to 7.9
years after testing. The severe OSA group received a diagnosis on average .22 years after
testing (SD = 2.2) with a median time of .2 years, ranging from 3.4 years before testing to
3.9 years after testing. The mean time lag difference between the mild and severe OSA
groups was not statistically significant, t(39) = -1.2, p = .22. We found 16 cases (10 mild, 6 severe) received an OSA diagnosis within one year before or after cognitive testing; 8
cases (4 mild, 4 severe) were diagnosed more than one year prior to cognitive testing; and
17 cases (12 mild, 5 severe) were diagnosed more than one year after testing.
For our primary analysis of neurocognitive morbidity we examined group
33
processing speed, visual-motor abilities, and academic skills. We also examined
differences in emotional symptoms, conduct problems, hyperactivity/inattention, peer
relationship problems, and pro-social behavior for descriptive purposes. Lastly, we
described other areas of morbidity including stroke, pain, priapism, lung and other types
of infection.
Hypothesis 2
We hypothesized that children with OSA will exhibit more neurocognitive
morbidity than those without OSA. To follow-up on our primary hypothesis, we also
conducted post-hoc analyses to examine group differences within the OSA group
between mild OSA and severe OSA. We hypothesized that mild OSA group would show
better performance on cognitive tasks than the severe OSA group. Because the
comparison within the OSA group (mild vs. severe) was added post-hoc, we applied a
more conservative alpha level of .025 in an attempt to better balance Type I and Type II
errors. This was equivalent to applying a Bonferonni correction where there are two
comparisons made (alpha level divided by number of comparisons). As an additional
exploratory set of analyses we assessed the correlation between cognitive variables and
two key sleep study variables linked previously to SCD morbidity: average nighttime
oxygen saturation and lowest nighttime oxygen saturation.
Cognitive data were available for a sub-sample of 90 children. Within this group
41 children had OSA. Within the OSA group 26 children had mild OSA and 15 had
severe OSA. OSA severity level was determined based on participants’ AHI or RDI
scores. These indices are generally used to determine a diagnosis of OSA and a severity
34
cases had either AHI or RDI), we used either score to assign a severity level based on
established guidelines for children (Marcus & Katz, 2005): mild = 1-10 apnea, hypopnea,
or other respiratory events per hour of sleep, severe = more than 10. Table 3.2 presents
descriptive information for the sample. None of the groups differed significantly on age,
gender, SCD risk, or genotype.
Two MANCOVAs for language functioning (TOLD Grammatical Understanding,
Word Discrimination, and Oral Vocabulary subtests) and academic skills (WJ-III Applied
Problems and WJ-III Letter-Word identification) and two ANCOVA procedures for
processing speed (WJ-III Decision Speed) and visual-motor ability (DTVMI) were used
in these analyses. The factor was OSA status (SCD only, mild OSA, and severe OSA)
and the covariate was SCD risk (high/low) for all analyses.
Assumptions of ANCOVA and MANCOVA
Normality of the sampling distribution was assumed for all dependent variables.
Generally when df >20, the sampling distribution will be normal. Additionally, if the variable distribution is normal in shape, the sampling distribution will also be normal. An
examination of histograms as well as skweness and kurtosis values for all dependent
variables revealed no significant deviations from normality (see table 3.3).
ANCOVA also assumes independence of the covariate (SCD risk) and the factor
(OSA status). Logistic regression with SCD risk as the outcome variable and OSA as the
predictor indicated that OSA status did not differentiate between high and low risk
genotypes, χ2
(1) = 1.6, p = .205.
Finally, ANOCOVA assumes homogeneity of regression slopes: the DV in each
35
can be checked by adding the interaction term (OSA status X SCD risk) to the
ANCOVA. A non-significant interaction term suggests the relationship between the
covariate and the DV does not change depending on group. The analysis indicated that
for the DTVMI the interaction term was not significant, F(2, 82) = 0.125, p = 0.883.
Similarly, for the WJ-III DS, the interaction term was also not significant, F(2,81) = 2.15,
p = 0.123. Therefore, this assumption was likely met for both dependent variables.
The MANCOVA procedure assumes multivariate normality. If every DV is
univariate-normal, multivariate normality can be assumed. Since univariate normality for
each DV is assumed (see above), this assumption of MANCOVA is likely met.
MANCOVA also assumes homogeneity of covariance matrices. For this
assumption to hold, the univariate tests for equality of variances between groups should
be met. Levene’s test for equality of variance was non-significant for all dependent
variables. Box’s test for equality of the covariance matrices was also not significant for
both MANCOVAs. Therefore this assumption is likely met.
Lastly, MANCOVA assumes the correlation between dependent variables must be
equal across all levels of the factor. Similar to ANCOVA, including the interaction term
in the analysis can help determine whether the assumption is likely to be met. A
non-significant interaction term indicates that correlation among dependent variables does not
vary across levels of the factor. For the language functioning MANCOVA, the
OV interaction term was not significant, F(2,75) = .231, p =.795; similarly for the
TOLD-GU, F(2,75) = .043, p =.958; and for the TOLD-WD, F(2,75) = .302, p = .74. For the
36
= 1.37, p = .26; and for the WJ-III LW, F(2,82) = 1.36, p = .261. As none of the
interaction terms was significant, the assumption was likely met.
Analyses of Cognitive Test Performance
Table 3.3 presents means and standard deviations for all cognitive dependent
variables. Tables 3.4 and 3.5 present results of the MANCOVA and ANCOVA analyses.
In the Language Functioning domain, our primary hypothesis was not supported. The
SCD group did not differ significantly from SCD/OSA group. An examination of the
specific dependent variables indicated a statistically significant effect of OSA status only
for the TOLD-OV, controlling for the effects of SCD genotype (high vs. low risk),
though the direction of the effect was not as predicted. However, the post hoc comparison
of the Mild OSA and Severe OSA groups did differ significantly, t(34) = 2.47, p = .016,
Cohen’s d = .85, with the severe OSA group exhibiting worse performance. The overall MANCOVA for academic skills was statistically significant.
Controlling for SCD genotype (high vs. low risk), significant group differences were
found for the WJ-III LW and the WJ-III AP subtests; however, the direction of these
effects was not as hypothesized. Therefore, our primary hypothesis was not supported.
The difference between those and without OSA was not significant for WJ-III LW, t(86) = 1.8, p = .074, Cohen’s d = .39; and for WJ-III AP, t(86) = -.28, p = .78, Cohen’s d = -.06. The post-hoc comparisons within the OSA group revealed a difference for the WJ-III
LW, t(39) = 2.12, p = .037, Cohen’s d = .74 with the severe group performing worse; however, this was not considered statistically significant with an alpha of .025. The
comparison between mild and severe OSA groups revealed a statistically significant