An optimization study of a multiple-row pin-vented
brake disc to promote brake cooling using
computational fluid dynamics
E Palmer, R Mishra*,andJ Fieldhouse
Department of Engineering and Technology, University of Huddersfield, Queensgate, Huddersfield, UK
The manuscript was received on 27 October 2008 and was accepted after revision for publication on 18 March 2009.
DOI: 10.1243/09544070JAUTO1053
Abstract: Brake disc cooling is an important area of research for high-performance brake disc manufacturers, users as well as academia. In high-demand braking applications, vented discs are increasingly being used as these are considered to have high heat-dissipating char-acteristics. The cooling efficiency of ventilated brakes depends on three key characteristics: the mass flowrate through the disc, i.e. the pumping efficiency of the rotor, the average heat transfer coefficient on the surface of the disc, and the wetted area of the rotor. Recent research has shown that the pin-vented discs have high heat transfer rates because of an increase in turbulence which results in a higher heat transfer coefficient. The pin-vented discs also have a higher resistance to thermal deformation owing to the more even distribution of material, resulting in lower thermal stress build-up within the rotor. The pin-vented discs in general have multiple rows of pins. In this paper an optimal configuration of various rows has been found for the maximum heat transfer rate. It has also been found that the ratio of wetted area of the disc to the frontal area of pins defines the heat transfer rate from the disc uniquely and can be used as a design parameter for the optimal design of a brake disc.
Keywords: pin-vented brake disc, brake cooling, computational fluid dynamics, optimization
1 INTRODUCTION
In high-demand braking applications, vented discs are increasingly being used as these are considered to have high heat-dissipating characteristics. Tradi-tionally, ventilated discs have consisted of two rubbing surfaces separated by straight radial vanes. The cooling efficiency of ventilated brake discs depends on three key characteristics: the mass flowrate through the disc, i.e. the pumping efficiency of the rotor, the average heat transfer coefficient on the surface of the disc, and the wetted area of the rotor [1, 2]. Two of the most common types of vented disc being used in an attempt to maximize these parameters are vented discs with curved vanes and vented discs with pins. The vented discs with
curved vanes have been shown to have increased thermal dissipation characteristics [3]. However, the use of curved vanes requires the left and right sides of the discs to be the mirror images of each other. To overcome this problem and still have higher heat-dissipating characteristics than a straight radial vane rotor, pin-vented discs are used. In this type of disc the two rubbing surfaces are separated using a series of teardrop and diamond-sectioned columns and pillars instead of radial vanes. Recent research [4] has shown that the pin-vented discs have the same order of heat transfer rate as discs with curved vanes because pin-vented discs have inherent capability to generate additional turbulence which results in a higher heat transfer coefficient. The pin-vented discs also have a higher resistance to thermal deformation because the material distribution in such discs is fairly even, resulting in lower thermal stress build-up within the rotor.
The optimization of internal vanes and pins to improve heat transfer characteristics is an active *Corresponding author: Department of Engineering and
Tech-nology, University of Huddersfield, Queensgate, Huddersfield, West Yorkshire, HD1 3DH, UK.
research area. The parametric optimization of exist-ing brake discs is an integral part of the brake system design procedure as many of the parameters defin-ing the brake’s geometry and performance are often dictated by packaging constraints (the wheel dia-meter and offset influence the rotor diadia-meter and calliper size respectively). Therefore, it is imperative to look for the highest performance within the sys-tem constraints. Work by Qian [5] carried out on discs with straight radial vanes has shown that, by utilizing a parametric approach to find an optimized configuration, the average heat transfer coefficient of the brake disc could be improved by 35 per cent over a baseline design. Recently, Palmeret al.[6] carried out detailed computational fluid dynamics (CFD) analysis of the flow through a pin-vented disc and optimized the first-row pin geometry for better cooling characteristics. They reported an improve-ment of about 10 per cent in heat transfer char-acteristics. The work, however, was limited to the effect of the first-row pin geometry of a pin-vented disc having three rows of pins in a staggered arrangement on the heat transfer characteristics. Further work analysing the effect of the second row of pins found that a similar improvement in the global performance characteristics of the disc could be achieved [7].
The published literature [8] has stressed the importance of maximizing the average heat transfer rate and the wetted area when aiming for an optimized design of a brake disc. One of the largest problems facing the brake disc designer in fulfilling these criteria is identifying the balance between a design which provides a sufficiently large wetted area for the energy to be transferred to the cooling airflow and at the same time generates a sufficiently high mass flowrate to give a high heat transfer rate. This paper builds on previous work [6, 7] to study the effect of the geometry of the first, second, and third rows of pins within a pin-vented rotor on its aerodynamic and thermal performance as well as to attempt to identify new design parameters defining the rotor geometry as well as its thermal and
aerodynamic performance. These in turn can be utilized by the brake disc designers to design the brake rotors for optimal aerothermal performance.
2 GEOMETRIC PARAMETERS
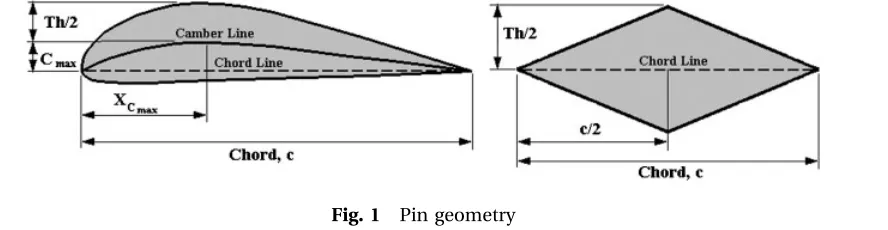
Palmeret al.[9] have shown that the pins used in a vented brake disc can be defined using wedges and NACA four series airfoils [10] with appropriate radii for casting. This method is highly robust for defining the shape of the pins as it allows complete control over the shape of the pin using only four parameters; the maxi-mum camber, the position of the maximaxi-mum camber, the thickness, and the length in the case of airfoil profiled pins. For wedge-shaped pins in the second row, only two parameters are required to control the shape of the pins: the length and thickness (defined as a percentage of the chord length), as shown in Fig. 1. This allows the effect of changing the various para-meters on the key flow field and heat transfer characteristics to be studied with relative ease.
This analysis takes a baseline rotor geometry based on a commercially available pin-vented brake rotor, consisting of a first row with a NACA0050 profile, a second row with a 40 per cent wedge profile, and a third row with a NACA0060 profile. The outer radius of the disc is 0.202 m and the three rows of pins are placed in a staggered arrangement, as shown in Fig. 2. A commercially available disc was selected to ensure the relevance of the work presented to practical application within the automotive industry. In this analysis the geometry of the pins has been changed by varying the thickness-to-chord-length ratio of the airfoils and wedges, while retaining a fixed chord length and 0uof camber for all pins. The thickness-to-chord length ratio of the pin profile for each row in turn is varied by ¡20 per cent from the baseline design, to find the effect of both increasing and decreasing the thickness of the pin with a view to obtaining an optimized pin thickness for each row. It has been deemed that a 20 per cent variation in the pin thickness would not lead to a substantial
[image:2.595.79.523.642.757.2]tion in the thermal mass of the disc or its mechanical strength. A full description of pin configuration attempted has been shown in Table 1.
3 MATHEMATICAL FORMULATION
In the present analysis, flow simulation through the disc has been carried out using commercially available Fluent software. The full details of the mathematical formulation can be found in the paper by Palmeret al. [6]. For completeness, essential information is pre-sented here. The following equations are solved using the finite volume method with appropriate boundary conditions for the discretized flow domain.
3.1 The mass conservation equation
The equation
Lr
Ltz=?ðruÞ~Sm ð1Þ
for conservation of mass is valid for both incom-pressible and comincom-pressible flows. The source term Smis the mass added to the continuous phase from
the dispersed second phase (e.g. owing to vaporiza-tion of liquid droplets) and any user-defined sources.
3.2 Momentum conservation equations
Conservation of momentum in an inertial (non-accelerating) reference frame is given by
LðrvÞ
Lt z=?ðvvÞ~{=pz=?ð ÞtzrgzF ð2Þ
The stress tensor is given by
t~±m =vz=vT{2 3=?vI
ð3Þ
The second term on the right-hand side of the equation accounts for the effect of volume dilation. This expression uses the eddy viscosity predicted by theK–eturbulence model, as described below.
To enable the modelling of a rotating body (in this case the disc) the code employs the rotating-reference-frame technique. This technique employs a modified version of the momentum and conserva-tion equaconserva-tions. In terms of absolute velocities the left-hand side of the momentum equations becomes
L
LtðrvÞz=?ðrvrvÞzrðV|vÞ ð4Þ
vr is defined as the relative velocity and V is the
[image:3.595.54.296.83.212.2]angular velocity vector. The continuity equation
Table 1 Analysis geometry
Design First-row profile Second-row profile Third-row profile Total blockage (mm2) Disc surface area (m2)
1 NACA0030 Wedge 40% NACA0060 370.8 0.028 570 77 2 NACA0040 Wedge 40% NACA0060 394.8 0.028 611 23 3 NACA0045 Wedge 40% NACA0060 406.8 0.028 631 85 4 NACA0050 Wedge 40% NACA0060 418.8 0.028 652 32 5 NACA0055 Wedge 40% NACA0060 430.8 0.028 672 32 6 NACA0060 Wedge 40% NACA0060 442.8 0.028 691 46 7 NACA0070 Wedge 40% NACA0060 466.8 0.028 742 12 8 NACA0050 Wedge 20% NACA0060 346.8 0.028 468 84 9 NACA0050 Wedge 30% NACA0060 382.8 0.028 563 33 10 NACA0050 Wedge 35% NACA0060 400.8 0.028 609 06 11 NACA0050 Wedge 40% NACA0060 418.8 0.028 652 32 12 NACA0050 Wedge 45% NACA0060 436.8 0.028 691 14 13 NACA0050 Wedge 50% NACA0060 454.8 0.028 722 27 14 NACA0050 Wedge 60% NACA0060 490.8 0.028 730 53 15 NACA0050 Wedge 40% NACA0040 367.2 0.028 543 41 16 NACA0050 Wedge 40% NACA0050 393 0.028 599 6 17 NACA0050 Wedge 40% NACA0055 405.9 0.028 617 3 18 NACA0050 Wedge 40% NACA0060 418.8 0.028 652 32 19 NACA0050 Wedge 40% NACA0065 431.7 0.028 666 86 20 NACA0050 Wedge 40% NACA0070 444.6 0.028 705 99 21 NACA0050 Wedge 40% NACA0080 470.4 0.028 758 19
[image:3.595.51.556.541.755.2]employed in rotating reference frame problems is written as
Lr
Ltz=?ðrvrÞ~Sm ð5Þ
The implementation of periodic boundary (cyclic symmetry) conditions meant that only a periodically repetitive 20usection of the disc was modelled rather than the whole disc. This had the effect of making the model much smaller, translating to lower hard-ware requirements and saving vast amounts of computational time.
The disc was modelled as rotating in still air by implementing atmospheric temperature and pres-sure at the inlet and outlet boundaries. The walls of the disc are represented as smooth walls at a constant temperature of 800 K. Although this is a massive simplification of most real-life braking events, it is deemed an adequate method for the simulation of brake discs in CFD for design compar-ison [4,8,11]. Symmetry boundary conditions have been used to generate zero-shear slip walls at the edge of the domain [12].
The speed of rotation for the simulation was 2000 r/min, correlating to approximately 100 per cent of maximum vehicle speed of a high-perfor-mance passenger car. As radiation and conduction to the hub are neglected within the simulation, higher speeds of rotation were chosen as previous work has shown that convective cooling becomes the predominate medium of heat transfer at rotation speeds above 500 r/min [11]. A complete summary of the boundary conditions used is given in Table 2 and shown in Fig. 3.
The Reynolds number over the first row of pins is calculated from the inlet velocity obtained using the velocity predicted by the equation proposed by Limpert [13] and given by
Vin~0:170 604n D2o{D2i
ð6Þ
The Reynolds number is then calculated using the hydraulic diameter of the gap between the pins of the front row as the characterizing length, yielding a value of 9.536105obtained for 2000 r/min and hence turbulent flow has been assumed to take place
within the disc using the transition criteria of 26105stated by Baskharone [14].
To model the turbulence the semiempirical stan-dard K–e turbulence model with standard wall treatment is employed in this study as it has been shown to give accurate flow predictions in previous work [3]. A second-order upwind discretization scheme is utilized as part of the solution regime for greater accuracy at the cell faces.
A mesh independence analysis as well as volume mesh optimization was carried out and the final mesh structure consists of a fine mesh near the walls of the disc and a coarse mesh near the boundaries of the domain. It was seen that the results became independent of the mesh spacing when approxi-mately 1.36106 tetrahedral elements were used in the flow domain. The mesh convergence analysis was performed on a model with an initial mesh of approximately 500 000 elements. The density of the mesh applied to the edges of the model was increased by a factor of 1.2 until a mesh-indep-endent solution was obtained, with additional den-sity applied in regions of high flow shearing. The standard relaxation factors were applied with con-vergence criteria of 0.0001 for all residuals as rec-ommended by the Fluent user guide [12] for tight convergence. A second-order upwind discretization scheme is utilized as part of the solution regime for greater accuracy at the cell faces.
[image:4.595.330.513.84.258.2]The computational approach has been validated by comparing the numerically simulated data for the
Table 2 Boundary conditions
Boundary Boundary condition Parameters
Inlet Pressure inlet Atmospheric pressure and temperature Outlet Pressure outlet Atmospheric pressure and temperature Domain edges Symmetry Symmetry
[image:4.595.76.502.694.752.2]vented discs with experimentally available data. A full description of the validation has been included in the paper by Palmeret al.[6]. It has been shown that the numerical simulations match experimental data favourably both qualitatively and quantitatively and can be used with confidence for further flow analysis. Comparison of the velocity field along two radial lines of investigation gave an average overall difference of 3.25 per cent with a standard deviation of just 0.3 between the experimental data and the CFD predicted flow. Therefore it can be ascertained that the modelling procedure is valid.
4 RESULTS
CFD analysis of the baseline disc unearthed many interesting fluid dynamic phenomena which have been included in the previous paper [6]. Some of the key results from the initial analysis included the identification of the position of maximum and minimum values of static pressure to be on the high-pressure and suction side of the leading edge of the pins in the front row. This corresponded to the positions of minimum and maximum relative velo-cities respectively. Further analysis of the tempera-ture field revealed that regions of low-velocity magnitude and recirculation lead to the creation of heat wells within the flow field. In turn, these heat wells lead to regions of poor local heat transfer coefficient on the disc, leading to the development relationship between the static pressure, velocity, temperature, and local heat transfer distribution. The data have been further analysed with a view to emphasizing the effects of the geometric character-istics of different rows on the flow field.
In order to characterize the relationship between the flow field and the pumping characteristics of the disc geometry, the radial velocity contours are shown in Fig. 4. The radial velocity values are shown on a plane at 50 per cent of the channel height. It can clearly be seen from Fig. 4 that the radial velocity varies over a wide range within the flow field and that the maximum radial velocity obtained in the analysis is 34.8 m/s. This value has been obtained on the high-pressure side of the pins in the first row. A negative radial velocity can also be clearly seen on the leading edge of the second row of pins. The regions of positive and negative radial velocities clearly demonstrate the regions of high flow and recirculation respectively, indicating considerable non-uniformity in the flow field.
The corresponding static pressure distributions across the inlet and outlet of different rows are
depicted in Fig. 5. Figure 5 shows the difference in pressure between the exit and the inlet of the respective row, as shown by the position of the area planes in Fig. 6. Hence, ifp2is the pressure at exit of
Fig. 4 Contours of radial velocity at 50 per cent of the channel height (m/s)
Fig. 5 Local pressure change within baseline disc
[image:5.595.317.556.84.245.2] [image:5.595.317.555.361.496.2] [image:5.595.346.522.537.733.2]the first row andp1is pressure at the inlet of the row,
the pressure difference is Dp15p22p1. The
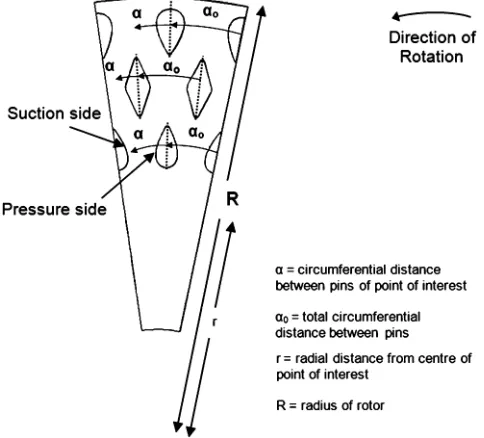
non-dimensional distance varies from the right edge to the left edge and is defined as the circumferential distance between the pressure side of the pin and the point of interest divided by the total circum-ferential distance between the pins, as shown in Fig. 7. Figure 5 clearly indicates that across the flow channel in the first-row pins there is a considerable change in static pressure which indicates strong non-uniformity and the presence of secondary flows in the flow. A large pressure drop on the pressure side (non-dimensional channel width less than 0.5) of the pins indicates a region of high flow, which is in agreement with the maximum radial velocity seen in Fig. 4 and path lines depicted in the previous paper [6], whereas on the suction side there is little flow and a tendency to separate occurs. The non-uniformity seen across the first row can be partly attributed to the rotation of the disc.
The non-uniformity across the second row of pins is far less than that of the first row, indicating a much smaller effect of rotation on the flow around the second-row pins. However, as with the first row of pins, a smaller pressure change occurs on the high-pressure side of the pin (non-dimensional channel width less than 0.5) where the majority of the flow is taking place, with a large pressure increase on the suction side where recirculation is taking place, as shown by the negative values of radial velocity in Fig. 4. The same trend is again evident in the pressure distribution around the third row of pins; however, the non-uniformity around the third row of
pins is much lower than around the second row of pins. Comparison of the average pressure drop across the three rows shows that the average static pressure change across the row steadily increases with radial distance from the centre of the disc; with a pressure drop across the first row of 63 Pa, a pressure increase of 137 Pa for the second row, and a further increase of 255 Pa across the third row. The extent of the variation along the rows is quite considerable for the first row compared with the second row as well as with the third row.
5 OPTIMIZATION OF ROW GEOMETRY
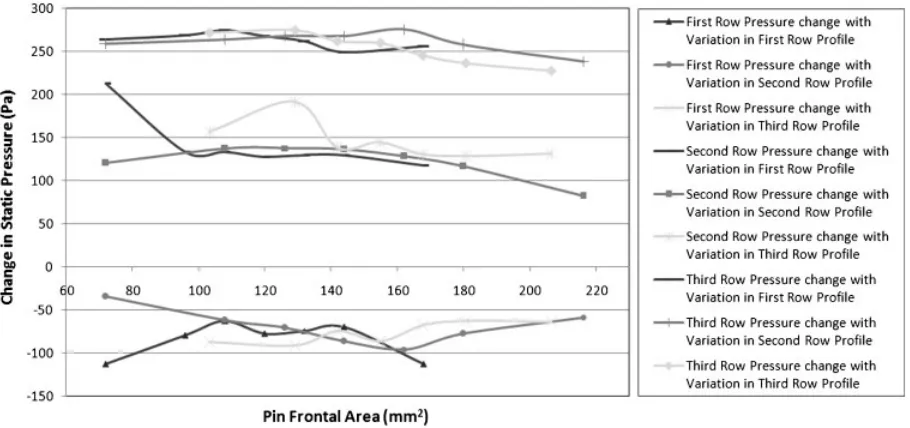
To understand the dependence of flow character-istics on the geometric parameters corresponding to different pins as described earlier, the change in static pressure across different rows has been shown in Fig. 8. The geometric parameter chosen in the present analysis is the frontal area of the pins in the row of interest. The value of the pressure drop shown is the difference in the mean static pressures experienced by the virtual inlet and outlet surfaces to each row labelled Area 1 to Area 4 in Fig. 6, e.g. the static pressure change across the first row is the mean pressure on Area 2 less the mean pressure experienced on Area 1.
Figure 8 indicates that variation in the geometry of the pins in each row affects the pressure drop across each row and hence the mass flow characteristics considerably. Examining the pressure drop across the first row shows that changes in the frontal area of the first row of pins causes a pronounced peak corresponding with a pressure drop value of about 275 Pa between frontal area values of 110 mm2 and 145 mm2. The effect of changes in the frontal areas of the second row of pins and third row of pins shows a mixed trend with the second row leading to a unique trough at 160 mm2with a maximum pressure drop of 95.6 Pa, whereas increasing the frontal area of the third row of pins tends to generate a larger pressure drop across the first row.
[image:6.595.39.281.514.733.2]non-uniform with no systematic effect. The pressure change across the third row of pins seems to be equally affected by the change in pin geometry of the first, second, and third rows of pins, with an increase in pin thickness leading to a decrease in the pressure change across the row of approximately 8 per cent.
[image:7.595.79.534.85.299.2]It is evident from the above discussion that a change in the geometry of each row has an effect on the flow characteristics through the disc. The mass flow through the disc is directly dependent on the pressure drop between the entry and the exit of the disc. The effect of pin geometry variation on this important parameter has been clearly depicted in Fig. 9.
It can be seen from Fig. 9 that with increase in pin frontal area the pressure drop decreases, indicating less airflow through the disc. The pressure drop is quite high for front-row pins followed by the sec-ond and third rows of pins. This substantiates the hypothesis set out in reference [6] that the frontal areas of the second and third rows of pins have comparatively less effect on the mass flowrate through the disc and hence the heat transfer than the first row of pins.
Figure 10 shows variation in the mass flowrate through the disc with changing profiles of the three rows of pins. An approximate 200 per cent increase in frontal area of the first row of pins decreases the mass flowrate through the disc by about 15 per cent whereas almost the same percentage change in the third-row pin changes the mass flowrate by about 6 per cent. The second row of pins shows a mixed trend, indicating an optimal frontal area correspond-Fig. 8 Effect of the pin geometry on the local static pressure change
Fig. 9 Effect of the pin geometry on the overall change in static pressure
[image:7.595.317.556.590.722.2]ing to the peak flowrate; however, the rate of change in mass flowrate with respect to frontal area is significantly lower than that of the first row of pins. From a comparison of Figs 9 and 10 the relationship between the static pressure across the disc and the mass flowrate through the vane passage can be seen. It is evident that increasing the pin frontal area reduces the pressure difference between the inlet and outlet of the vane passage and hence reduces the mass flowrate through the disc. The effect of increasing the width of the pins on the internal flow field has been discussed in detail in previous work [7, 9]. In these investigations it was found that increasing the width of the pins increased the size of the region of relatively high pressure on the leading edge of the pins. This effect, which is most evident for the first row of pins, increases the resistance to the flow and hence leads to reduced mass flow through the disc.
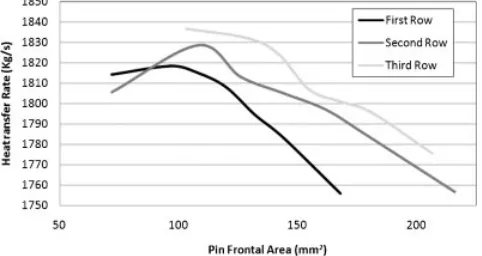
The effect of the pin frontal area on the heat transfer rate is shown in Fig. 11. The effect of the frontal area of the pins on the average heat transfer rate of the disc is similar to the effect of the pin
frontal area on the mass flowrate except that for each pin row the heat transfer rate peaks at a given frontal area. As with the mass flowrate it can be seen that the first row causes the largest change in heat trans-fer rate with respect to frontal area, followed by the second row, with the third row having a minimal effect on the overall performance of the disc.
[image:8.595.40.281.389.517.2] [image:8.595.86.490.559.734.2]The objective of this paper is to develop a greater understanding of the interrelation between the heat transfer characteristics and the geometric para-meters defining the pin shape. The pin frontal area directly affects the mass flowrate; hence the overall frontal area has been taken as a geometric parameter and its effect on mass flowrate and hence heat transfer rate has been investigated. Figure 12 depicts the heat transfer rate and mass flowrate from and through the section modelled in the CFD analysis. It can be seen from this figure that the heat trans-fer rate has a maximum value of 1825 W and a minimum value of 1755 W, giving a total range of 70 W over the range of disc geometries studied. Likewise the mass flowrate has a maximum value of 0.2 kg/s and a minimum of 0.177 75 kg/s, yielding a total range of 0.022 25 kg/s. A key result indicated by Fig. 12 is that the mass flowrate peaks at a total frontal area of 380 mm2 and the peak heat transfer rate is also observed at the same point. This suggests that the total blockage presented to the flow is an important parameter which affects the mass flowrate and hence the heat transfer rate from the disc. Further comparison of the relationships between the mass flowrate and heat transfer rate and the total pin frontal area shows that between the total pin frontal areas of 380 mm2 and 450 mm2the two parameters demonstrate almost identical trends, implying a linear relationship between the two. However, at values of the total pin frontal area above 450 mm2 Fig. 11 Effect of the individual pin frontal area on the
heat transfer rate
the mass flowrate continues to drop while the heat transfer rate remains relatively unchanged. The opposite relationship is seen for total pin frontal areas of less than 380 mm2, where increasing the mass flowrate has little effect on increasing the heat transfer rate.
The heat transfer mechanism from the ventilated disc depends on two important parameters: the wetted area presented to the flow for the transfer of energy from the disc to the air and the mass flowrate through the disc to convey this heat load to outside. It is the balancing of these two parameters that a brake disc designer has to carry out for an optimal design. The present investigation has clearly indi-cated that the frontal area of the pins has a strong influence on the mass flowrate; however, it gives no indication of the heat transfer properties of the disc. Hence, together with the wetted area, the frontal area is also an important parameter that needs to be considered while designing brake discs. Keeping this in view a new geometric parameter namely the ‘area ratio parameter’ has been developed which has been defined as the ratio of wetted area to the frontal area according to
Area ratio parameter~ Aw
Afront ð7Þ
and this parameter should be related to heat transfer rate uniquely. It is proposed that the optimization of this parameter is as important as the shape of the vanes.
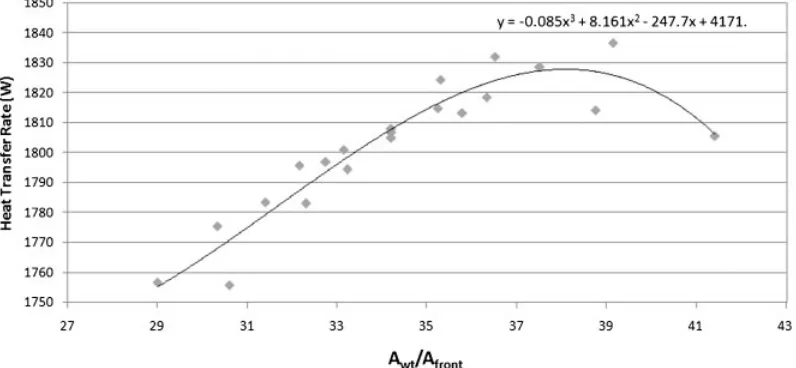
Figure 13 clearly displays the effect of the new parameter on the heat transfer rate from the rotor; the heat transfer rate is a maximum for a value of this parameter which can be computed from
_ Q
Q~{0:085x3z8:161x2{247:7xz4171 ð8Þ
which represents this inter-relation. In this equation, xis the new parameter andQQ_ is the heat transfer rate in watts. From equation (8) the optimal area ratio parameter, i.e.Aw/Afront, can be found for maximum
heat transfer. For this disc the maximum heat transfer is generated by a wetted-area-to-frontal-area ratio of 38.5. The above can be used as a design equation for distributing the mass of the disc for a given heat transfer coefficient for a given thermal capacity of the disc. For the disc used in the analysis it can be seen that the constants have particular values. These constants can be a function of a number of variables such as the speed of rotation, inner and outer diameters of the brake disc, and the nature of the pins. Further work would be required to establish dependences of these constants on the above-mentioned variables.
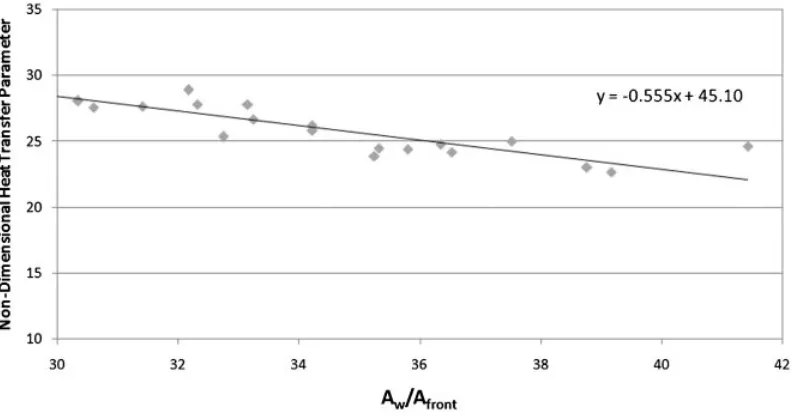
To eliminate the scale effect and hence to develop a unique non-dimensional correlation, the heat transfer rate was non-dimensionalized by dividing it by kinetic energy of the flow, where in the definition of kinetic energy the velocity is taken as the average total velocity at the outer radius of the disc. This parameter represents the ratio of the mass flowrate of air through the rotor to the heat transferred to the flow and is given by the equation
Non-dimensional heat transfer parameter
~ _ Q Q 0:5mmv_ 2
o
ð9Þ
[image:9.595.107.505.549.733.2]It can be seen in Fig. 14 that the relationship
between the non-dimensional heat transfer para-meter and non-dimensional geometric parapara-meter is almost linear. This indicates that, as the proportion of wetted area to frontal area increases, the non-dimensional heat transfer parameter decreases. This relationship substantiates that the ratio of the wetted area to frontal area represents a balance between the mass flowrate and the heat transfer rate and that the heat transfer coefficient and pumping efficiency are uniquely dependent on this ratio. This demonstrates that, in place of the wetted area, the ratio of the wetted area to the frontal area is a more appropriate geometric parameter which needs to be optimized for a given heat transfer requirement from the disc.
6 CONCLUSIONS
This work has very clearly demonstrated that the mass distribution of the disc affects heat transfer through the brake disc considerably. From the discussion it is clear that, as hypothesized in pre-vious work [6], the first row of pins has the most significant effect on the flow field through the disc (as shown by the change in static pressure through the rotor) and hence the mass flowrate and the heat transfer rate from the disc. The second row has the next-largest effect and the third row only a small effect on the thermoaerodynamic performance of the disc.
An area ratio Aw/Afront has been identified which
can be optimized to give maximum heat transfer, enabling designers to balance the pumping effi-ciency of the disc and the heat transfer. In the
present analysis it has been seen that this parameter gives a maximum heat transfer rate at a value of 38.5. It is proposed that optimization of this parameter is as important as the shape of the pins or vanes and that further work will identify the effects of the speed of rotation, inner and outer radii of the disc, and height of the vane gap on this ratio that will be applicable to any type of disc regardless of the vane configuration.
A second parameter, namely non-dimensional energy transfer, has also been identified for analys-ing the relative performance of the disc and repre-sents a measure of a disc’s heat transfer abilities relative to its pumping efficiency. This parameter has been shown to be linearly dependent on the area ratio and hence can be used by brake design-ers directly to calculate the mass distribution within the disc as a function of the heat transfer rate.
It is proposed to carry out additional work to identify the remaining constants within the design equations proposed on the basis of which a set of powerful design guidelines can be developed. These guidelines will aid the designer in the initial design of vented brake rotors for a given application and performance criteria.
REFERENCES
[image:10.595.94.490.85.293.2]1 Barigozzi, G., Cossali, G. E., Perdichizzi, A., Boden, A., and Pacchiana, P. Experimental in-vestigation of the mean and turbulent flow char-acteristics at the exit of automotive vented brake discs. SAE paper 2002-01-2590, 2002.
2 Carlos, H., Galindo, L., and Tirovic, M. Air flow and heat dissipation analysis of commercial vehicle brake discs. InAutomobile for the future, Proceed-ings of the EAEC 11th European Automotive Con-gress, Budapest, Hungary, 30 May–1 June 2007, paper CV06-3 (European Automobile Engineers Cooperation, Vienna).
3 Daudi, A.andNarain, M.72 curved fin rotor design reduces maximum rotor temperature. SAE paper 1999-01-3395, 1999.
4 Wallis, L., Leonardi, E.,andMilton, B.Air flow and heat transfer in ventilated disc brake rotors with diamond and tear-drop pillars. Numer. Heat Transfer, Part A, 2001,41, 643–655.
5 Qian, C. Aerodynamic shape optimization using CFD parametric model with brake cooling applica-tion. SAE paper 2002-01-0599, 2002.
6 Palmer, E., Mishra, R., and Fieldhouse, J. A computational fluid dynamic analysis on the effect of front row pin geometry on the aerothermo-dynamic properties of a pin-vented brake disc. Proc. IMechE, Part D: J. Automobile Engineering, 2008, 22(7), 1231–1245. DOI: 10.1243/09544070 JAUTO755.
7 Palmer, E., Mishra, R., and Fieldhouse, J. The manipulation of heat transfer characteristics of a pin vented brake rotor through the design of rotor geometry. In Automobile for the future, Proceed-ings of the EAEC 11th European Automotive Con-gress, Budapest, Hungary, 30 May–1 June 2007, paper AE14-3 (European Automobile Engineers Cooperation, Vienna).
8 Tirovic, M. andGalindo-Lopez, C. H. Analysis of air flow and heat dissipation from wheel mounted railway brake discs. In Braking 2006, Proceedings of the International Conference onVehicle braking technology, York, UK, 7–9 May 2006, pp. 125–134 (University of Leeds, Leeds).
9 Palmer, E., Mishra, R.,andFieldhouse, J. Optimi-sation of pin shape and its configuration for a ‘pin’ type vented brake disc using CFD. In Proceedings of the FISITA 2006 World Automotive Congress, Yokohama, Japan, 22–27 October 2006, paper F2006D115 (JSAE, Tokyo).
10 Jacobs, E., Ward, K., and Pinkerton, R. The characteristics of 78 related airfoil sections from tests in the variable-density wind tunnel. Technical report 460, National Advisory Committee for Aero-nautics, 1933.
11 Voller, G. P., Tirovic, M., Morris, R.,andGibbens, P. Analysis of automotive disc brake cooling characteristics.Proc. IMechE, Part D: J. Automobile
Engineering, 2003, 217(8), 657–666. DOI: 10.1243/ 69544070360692050.
12 Fluent user’s guide, 2003 (Fluent Incorporated, Lebanon, New Hampshire).
13 Limpert, R. Cooling analysis of disc brake rotors. SAE paper 751014, 1975.
14 Baskharone, E. Principle of turbomachinery in air breathing engines, 2006, p. 358 (Cambridge Uni-versity Press, Cambridge).
APPENDIX
Notation
Afront total frontal area presented to the
flow by the pins (m2)
Aw total wetted area within the disc (m2)
c chord length (m)
Cmax maximum camber (m)
Di inner diameter of the disc (m)
Do outer diameter of the disc (m)
F force vector (N)
m˙ mass flowrate through the disc (kg/s)
n speed of rotation (r/min)
p pressure (Pa)
_ Q
Q heat transfer rate (W)
Sm source term (kg)
r radial distance from the centre of the point of interest (m)
R radius of the rotor (m)
t time (s)
Th aerofoil profile thickness (m)
vo velocity at the outer diameter of the
disc (m/s)
v velocity vector (m/s)
vr relative velocity vector (m/s)
XCmax position along the chord of maximum camber (m)
a circumferential distance between
pins at the point of interest (m) a0 total circumferential distance
between pins (m)
m viscosity (Pa s)
r density (kg/m3)
t stress tensor (Pa)