8th World Conference on Experimental Heat Transfer, Fluid Mechanics, and Thermodynamics June 16-20, 2013, Lisbon, Portugal
WAKE EFFECTS FROM A RISING AIR BUBBLE IMPACTING A
HORIZONTAL HEATED SURFACE
David B Donoghue∗, Abdulaleem Albadawi∗∗, Yan MC Delauré∗∗, Anthony J Robinson∗and Darina B Murray∗∗
∗Dept. Mechanical & Manufacturing Engineering, Trinity College Dublin, Ireland
∗∗School of Mechanical & Manufacturing Engineering, Dublin City University, Ireland
E-mail : [email protected]
ABSTRACT
This study will deal with the effect on heat transfer of a single air bubble generated in a 0.5 mm orifice and rising vertically a set distance before impinging on a heated horizontal surface. The effect on heat transfer due to the direct impingement of the bubble was found to be limited when compared to the influence of the wake generated by the rising bubble. The wake of the bubble was found to give rise to separate regions of high vorticity and high heat transfer. It was found that the larger orifice to surface distance, the far greater the enhancement effect of the wake.
Keywords:Air Bubble, Wake, Impingement, Bouncing, Heat Transfer, IR Imaging
1. INTRODUCTION
Bubble agitation is known to enhance heat transfer from sur-faces but the convective heat transfer mechanisms are not well un-derstood. Developments in two phase technology have been exten-sive over the several decades, thus highlighting the need for further study in this field.
Bubble motion is not limited to heat exchangers, but includes a wide variety of industrial devices. This industrial context has furthered research into bubble growth, bubble free rise and inter-action effects with heated surfaces of different orientation. Bubble growth has been most recently investigated by Albadawi et al. [1] and Albadawi et al. [2], while Tomiyama et al. [3] has performed both a numerical and experimental study on air bubbles rising in water. Their study indicated that the mode in which a bubble is released from an orifice significantly affects the bubble’s motion. The results reported by Tomiyama et al. [3] were supported by the work of Ellingsen & Risso [4].
Rising bubbles are known to shed horse-shoe type vortices dur-ing their rise [5–8]. Brücker [5] used Particle Image Velocimetry (PIV) combined with high-speed photography to track ellipsoidal bubbles. His results indicated that at the bubble’s inversion point, during its zig-zag rise, a single vortex is shed is the direction away from the bubble. De Vries et al. [7] employed the schlieren opti-cal technique to visualize the wake behind high Reynolds number bubbles in highly purified water. It was noted that a double-thread wake followed the bubble during its rise. The double-thread was found to be present whenever the curvature of the bubble’s path was non-zero. The wake immediately behind the bubble consists of hairpin-type loops, which were formed and closed each time the bubble passes through the axis of symmetry of the zig-zag. In a later study by Sanada et al. [9], photochromatic dye was used to visualize the wake behind a rising bubble. Their results showed that vortices were formed not only twice but multiple times in one period, during zig-zag motion.
A number of studies have examined the motion of a single rising bubble as it impinges and rebounds from solid horizontal surfaces [10–12]. These studies have been focused on the motion of the bubble. The heat transfer enhancement resulting from bubble agi-tation is well known, as reported by numerous authors [13–20] but
these studies have not addressed heat transfer enhancement due to a bubble impacting and rebounding from a heated horizontal surface. To the authors’ knowledge limited research into the heat transfer enhancement effect of a single bubble bouncing against a horizontal surface is available.
The present study explores heat transfer associated with the wake ensuing from a single bubble impinging and rebounding from a heated horizontal surface. In this phase of the work, the focus is on the effect of the wake formed in the rise of a single ellipsoidal air bubble in water. The direct enhancement during bubble impact and rebound has been addressed by Donoghue et al. [21].
2. EXPERIMENTAL SET-UP
x y z
PC
Water DC Supply IR Camera
Cameras
Injection system
Foil Trigger
DAQ
Therm-ocouple
IR glass
[image:1.595.325.531.489.682.2]Orifice LED Air gap
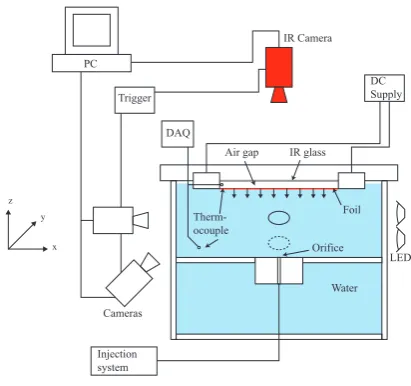
Figure 1: Experimental set-up.
The experimental apparatus illustrated in Fig. 1 consists of a
glass tank measuring 110 x 95 x 195 mm3 filled with ultra-pure
water. A horizontal test surface is mounted on top of the tank as
shown. The test surface consists of a 10µm Constantan foil
lower surface of the foil is submerged 3 mm below the surface of the fluid, with the upper surface of the foil being viewable with an infrared camera. The upper surface of the horizontal foil is coated with a thin layer of high emissivity matt black paint
mea-suring 10.3µm in thickness. The test surface is heated ohmically,
approximating constant heat generation within the foil. The up-per surface of the foil is insulated by means of a Calcium-Fluoride window, which reduces natural convection to the surroundings.
A single bubble is generated in an orifice below the heated sur-face, which has an adjustable orifice to surface distance. In order to view the path of the rising bubble, two high speed CCD cameras (NAC Hi-Dcam II) are mounted horizontally and perpendicular to each other. This alignment allows the motion of the bubble to be traced. Diffused LED back-lighting is utilized to illuminate the test section.
A high speed IR (FLIR SC6000) camera is mounted directly above the horizontally heated surface and is used to capture the temporal variation in surface temperature. The spatial resolution
for the thermal camera is 216µm/pixel. Both the thermal camera
and the high speed visual cameras are synchronized at a frame rate of 1000 Hz by means of a TTL signal.
2.1. EXPERIMENTAL PROCEDURE
The fluid within the tank is maintained at 22±0.5◦C. The test
surface is heated by means of a Lambda d.c. power supply, with a constant current of 30 A. Once stable a single air bubble was in-jected at a flow rate of 100 ml/hr using a kdScientific model 200 infusion pump in conjunction with a Hamilton GASTIGHT 1002 2.5 ml syringe. Once the infusion pump begins the three cameras are triggered to record the bubble motion and varying surface tem-perature.
2.2. ANALYSIS OF TEST SURFACE
As previously mentioned the thin foil surface, which has a
thick-ness ofδ = 10µm, approximates a uniform heat generation. In
order to evaluate the convective heat flux into the fluid an elemen-tary energy balance is performed in both the foil and paint. This energy balance (Eq. 1) accounts for the generated flux (q00gen) due to the foil electric heating, heat loss (q00rad) by radiation, lateral con-duction (κ δ∆T) within the foil and stored thermal flux (ρCPδ∂∂Tt).
The foil’s upper surface is insulated by means of a 1 mm thick IR transparent glass (CaF2) as shown in Fig. 1, with its heat loss being (q00cond) conduction into the stagnant air. A more detailed analysis is presented by Donoghue et al. [21].
q00conv=q00gen−q00rad−q00cond+κ δ∆T−ρCPδ∂T
∂t (1)
In order to fully evaluate the change in the surface temperature resulting from the wake of a single bubble, the following expres-sion (Eq. 2) is utilized:
T∗=Ti,j,τ=n−T∞ ¯
Tτ=0−T∞
(2)
In order to determine the bubble’s velocity, the magnitude of its velocity is calculated as follows:
U=
p
(xi+1−xi)2+ (yi+1−yi)2+ (zi+1−zi)2)
∆τ (3)
where(xi+1,yi+1,zi+1)and(xi,yi,zi)are the coordinates of
con-secutive positions of the bubble, and∆τis the frame rate between
consecutive frames of the recordings.
3. RESULTS AND DISCUSSION
Results are presented for an injection orifice diameter of 0.5 mm, with a variation in release height of 10 - 40 mm from the heated impact surface. This injection orifice produced a bubble with an equivalent diameter of approximately 2.6 mm. The
aver-age surface temperature is 51.5◦C which provides a
correspond-ing natural convection heat flux to the water of approximately 7.3
kW/m2. Results are presented first for the bubble dynamics; the
heat transfer resulting from the interaction of the bubbles wake with the surface is then considered.
3.1. BUBBLE DYNAMICS
Once the bubble has departed the orifice, it immediately com-mences its rise through the test section. The total time for the bubble to rise through the test section was dependent on the height
of release, which for the present study varied from 10 – 40mm
from the orifice to the heated surface.
−10 −8 −6 −4 −2 0 2 4 6 8 10
0 2 4 6 8 10 12 14 16 18 20 22 24 26 28 30 32 34 36 38 40
SX,Y [mm] SZ
[mm
]
[image:2.595.326.525.432.671.2]X Y
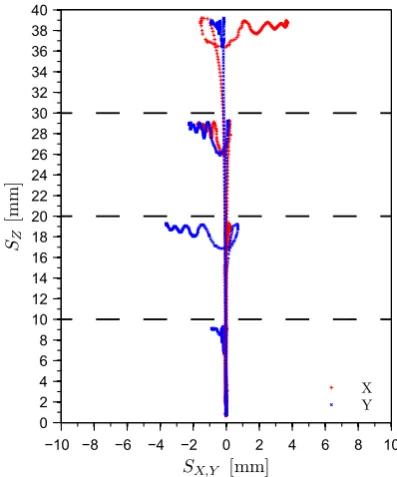
Figure 2: Centroid locations of a single bubble with ade= 2.6 mm,
released from four different release heights: 10, 20, 30 and 40 mm.
As the bubble rises, its major axis, initially parallel with both the release and impact surfaces, was found to tilt in a random direc-tion, even considering the small sample size. This tilting indicates that the bubble has changed direction and is no longer rising
rec-tilinearly. For the lowest release height, 10mm, the bubble rose
for larger release heights when the bubble was nearing the impact surface.
Figure 2 illustrates the centroidal location for four bubbles gen-erated in a orifice with an internal diameter of 0.5 mm. The four locations of the heated surface can be inferred from Fig. 2. In the cases shown in Fig. 2, the bubbles did not drift significantly from a straight rise path, although significant drift was observed in some experiments.
0 0.05 0.1 0.15 0.2 0.25 0.3 0
50 100 150 200 250 300 350 400
Time [s]
U
[mm/s]
[image:3.595.62.274.217.380.2]10 mm 20 mm 30 mm 40 mm
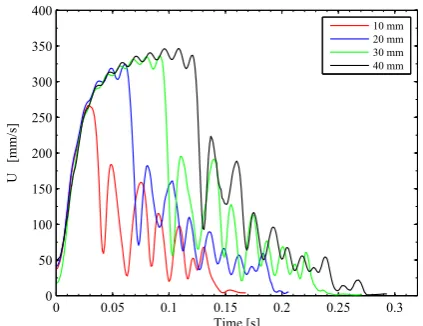
Figure 3: Velocity for bubbles released from four different release heights: 10, 20, 30 and 40 mm as shown in Fig. 2. The sharp drop in velocity indicates that the bubble has impacted the surface.
0 0.02 0.04 0.06 0.08 0.1 0.12 0.14
0.4 0.5 0.6 0.7 0.8 0.9 1
Time [s]
Aspect Ratio
χ
[−]
10 mm 20 mm 30 mm 40 mm
a b
[image:3.595.63.275.448.613.2]χ ab=
Figure 4: Variation in the bubble’s aspect ratio (χ=a/b) for the four bubbles shown in Figs. 2 and 3. The variation in the bubble’s aspect ratio is shown only for the time period from release from the orifice up until impact for clarity.
Following impact on the horizontal surface, the bubbles shape was found to fluctuate significantly. At impact, the bubble’s shape deforms to that of a disk, having a large surface area. As the bubble begins to rebound from the surface, it recovers its spherical shape. For the cases reported here, the bubble initially bounced 3 mm away from the horizontal surface before returning. Following the initial impact and rebound subsequent bounces occurred, although the rebound distance was reduced due to lower vertical velocity. In the cases shown in Fig.2 the bubble bounced approximately three
times on the surface before attachment occurred. After attachment the bubble would oscillate on the surface a number of times before fully settling. In some cases only a single bounce was observed, before attachment.
Figure 3 illustrates the variation in bubble centroidal velocity, from release up until the bubble has settled on the surface. The sharp drop in velocity is due to the bubble coming in contact with the surface, before reversing its direction. What is notable is the similarity between the results, excluding the variation in release height. During the bubble’s rise, oscillations in the bubbles veloc-ity can be observed, these oscillations are linked to variations in the bubble’s shape.
Figure 4 demonstrates the variation in the bubble’s aspect ra-tio as the bubble leaves the growth orifice, up until it impacts the horizontal surface. Once the bubble detaches from the orifice, the lower surface of the bubble retracts into the remainder of the bub-ble; it is this retraction that causes the bubble aspect ratio to fluctu-ate during its rise. As the bubble rises the bubble’s shape becomes flatter, indicated by lowering of its aspect ratio. Sanada et al. [9] noted that not only one but multiple horse-shoe type vortices were formed in the rear of a rising bubble during a zig-zag path when the bubble changed direction. More importantly, they noted that there exists a close relationship between the change in the bubbles shape and increased formation of horse-shoe type vortices. In the
present study the bubble has an equivalent diameter ofde= 2.6
mm; which would have a rise path initially being zig-zag but more inclined to change to a spiral path although this was not observed due the limited vertical height.
3.2. CONVECTIVE HEAT TRANSFER
As previously mentioned the small bubble is released at four dis-tanced below the heated surface; 10, 20, 30 and 40 mm. This sec-tion will investigate the effect of the bubble’s wake on heat transfer and will explore the wake formation process.
−8−7−6−5−4−3−2−1 0 1 2 3 4 5 6 7 8 910 11 12
−8 −7 −6 −5 −4 −3 −2 −1
0
1 2 3 4 5 6 7 8
9
10 11 12
[mm]
Convective Heat Flux [kW/m2]
0
10 20 30 40 50 60
[image:3.595.323.527.543.712.2]0 2 4 6 8 10 12 14 16 −50 0 50 100 150 200 250 w [mm]
Convected Flux [kW/m
[image:4.595.60.286.108.286.2]2 ] 0 ms 4 ms 8 ms 12 ms 16 ms 20 ms 24 ms 28 ms 32 ms 36 ms
Figure 6: Convective heat flux variation up to 40 ms after the ini-tial bubble impact, for a bubble released from 30 mm away from the heated surface.
Bubbles released from heights of 10 and 20 mm, have a vertical rise path as shown in Fig. 2. Liu & Zheng [8] noted that rising bub-bles push liquid ahead of them and entrain liquid into their wake. De Vries [22] observed a single threaded wake behind a rectilinear rising bubble; a similar finding was made by Sanada et al. [9] who observed bubble motion directly above the growth orifice. These observations suggest that the wake generated by a bubble rising vertically would have a limited cooling extent, which is further compounded by the rebound of the bubble; directly into the fol-lowing wake. This observation was found to be true for bubbles released at low heights, with the cooling extent of the wake being no greater than a bubble diameter in width and breadth. The en-hancement in convective heat transfer due to the bubble’s wake was found to have a duration of approximately one second for these low release heights.
0 2 4 6 8 10 12 14 16
−10 0 10 20 30 40 50 60 w [mm]
Convected Flux [kW/m
[image:4.595.325.516.138.722.2]2 ] 80 ms 84 ms 88 ms 92 ms 96 ms 100 ms 104 ms 108 ms 112 ms 116 ms Bubble location
Figure 7: Convective heat flux variation from 80 to 120 ms after the initial bubble impact, for a bubble released from 30 mm away from the heated surface.
A bubble released from a height of greater than 20 mm was found to have a significant effect on the convective heat transfer
to the water. As previously mentioned, the path of a bubble usu-ally deviates from a vertical path for release heights greater than 20 mm.
íííííííí 0 9
í í í í í í í í 0 9 [mm]
Heat Flux [kW/m]
íííííííí 0 9 í í í í í í í í 0 9 [mm]
Heat Flux [kW/m]
íííííííí 0 9 í í í í í í í í 0 9 [mm]
Heat Flux [kW/m]
íííííííí 0 9
í í í í í í í í 0 9 [mm]
Heat Flux [kW/m]
(a)
(b)
(c)
(d)
60 ms 180 ms 400 ms 580 ms [image:4.595.59.286.538.714.2]0 2 4 6 8 10 12 14 16 18 20 22 í
0 10 20 30 40 50 60 70
w [mm]
Convected Flux [kW/m
2 ]
40 ms 44 ms 48 ms 52 ms 56 ms 60 ms 64 ms 68 ms 72 ms 76 ms
0 2 4 6 8 10 12 14 16 18 20 22 4
6 8 10 12 14 16 18
w [mm]
Convected Flux [kW/m
2]
400 ms 404 ms 408 ms 412 ms 416 ms 420 ms 424 ms 428 ms 432 ms 436 ms
0 2 4 6 8 10 12 14 16 18 20 22 0
5 10 15 20 25
w [mm]
Convected Flux [kW/m
2]
160 ms 164 ms 168 ms 172 ms 176 ms 180 ms 184 ms 188 ms 192 ms 196 ms
0 2 4 6 8 10 12 14 16 18 20 22 4
6 8 10 12 14 16 18
w [mm]
Convected Flux [kW/m
2]
560 ms 564 ms 568 ms 572 ms 576 ms 580 ms 584 ms 588 ms 592 ms 596 ms
(a)
(c)
(b)
(d)
Bubble location
Bubble location
Bubble location
[image:5.595.61.542.105.494.2]Bubble location
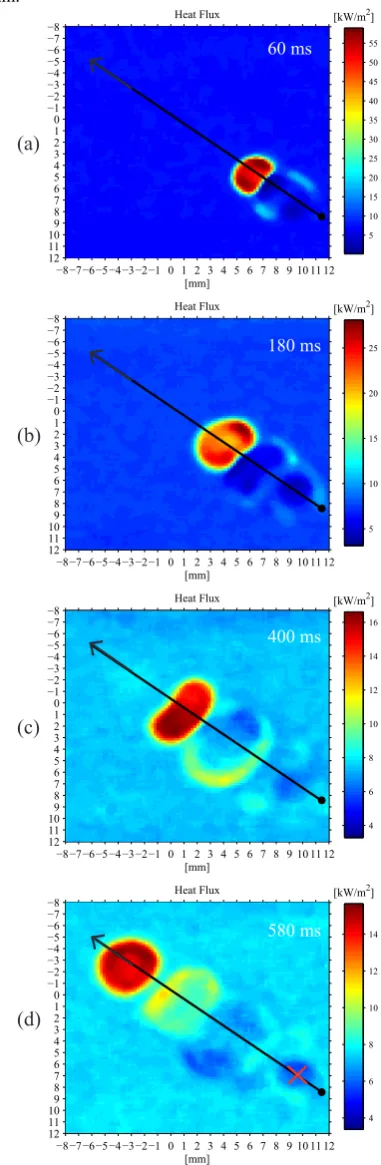
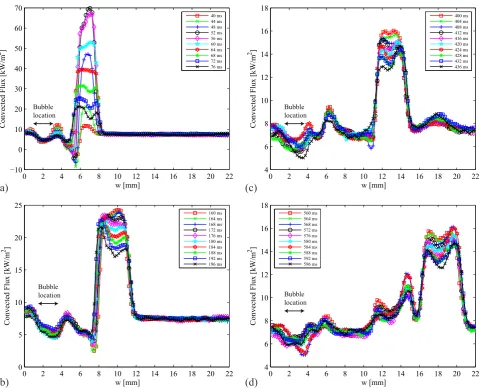
Figure 9: Convective heat flux variation from 40 to 80 ms (a), 160 to 200 ms (b), 400 to 440 ms (c) and 560 to 600 ms (d) after the initial bubble impact, for a bubble released from 40 mm.
Within the impact zone of the bubble, substantial variations in convective heat transfer occur, with levels greater than thirty times liquid natural convection being observed. Once the bubble has set-tled and attached to the surface, a continued temperature reduction occurred over a broad zone on the surface, although not at the point of attachment.
Figure 5 illustrates the convective heat flux up to 40 ms after the initial impact of the bubble. The centre (0, 0 mm) of the image in Fig 5 corresponds to the position of the growth orifice, with a
release distance of 30 mm in thezdirection. At this moment the
bubble is fully attached to the surface in a stable position located at the marked location in Fig. 5. In order to analysis the temporal variation in convective heat flux, a line is marked in Fig. 5. This line was chosen to be in the approximate direction of the wake as it spreads, commencing at the black circle.
Figures 6 and 7 illustrate the temporal variation in convective heat flux along the line previously described in Fig. 5, for times between 0 ms to 40 ms and 80 ms to 120 ms respectively. In Fig. 6
at anwlocation of 7 mm and a time of 4 ms, the spike in
convec-tive heat transfer is due to the bubble impacting the surface. The bubbles then bounces and attaches to a new location of 2 mm at an approximate time of 40 ms after the initial impact. At a location of 8 – 10 mm there is a noted increase in convective heat trans-fer beginning at a time of 20 ms, moving in the opposite direction of the bubble. Similarly in Fig. 7 an enhancement in convective heat transfer is centred around 11 mm, while being distinguishable from the previous enhancement region. After 120 ms this second enhancement region slowly spreads along the surface, to a distance of 15 mm in Fig. 7.
A third region of continued cooling was observed within the sec-ond region beginning at a time of 220 ms and extending up until 800 ms after the initial impact. After 800 ms, the third region con-tinues to spread slowly along the surface until finally dissipating.
Fig. 8 (d). From Fig. 8 (a) – (d) it can be seen that there are four distinct regions of high convective heat transfer. That appearing at 60 ms is closest to the bubble position and highest in magnitude, subsequent enhancement zones move away from the bubble and decrease in magnitude.
Figure 8 (a), shows the first enhanced cooling region, which ex-hibits a high level of symmetry. Thus, either side of the black line there are zones with 15% higher heat transfer when compared to the centre of the region. Similarly, this trend was observed for the later regions in Fig. 8 (b) to (d).
0 1 2 3 4 5
0 100 200 300 400 500 600 700
Vortex No.
Vortex land time [ms]
Test 1 Test 2 Test 3 Test 4 Test 5 Test 6
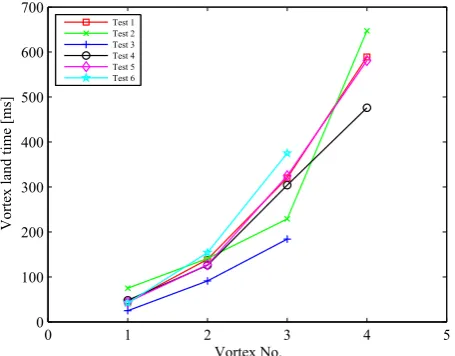
Figure 10: Vortex land time after the bubble’s initial impact for a bubble released from a height of 40 mm. In most cases four sep-arate vortices were observed, while for two cases only three were observed. Land time is defined as the time when the vortex reaches the surface, as inferred from the increased cooling.
Figure 9 illustrate the temporal variation in convective heat flux along the black line drawn in Fig. 8, beginning at the black circle. The four distinct cooling regions are centred at 7 mm, 10 mm, 13 mm and 19 mm along the line, with each extend to an approximate area of two bubble diameters, which can be inferred from Fig. 8.
Within each cooling region in Fig. 9 (a) – (d) there are substan-tial variations in the maximum convective heat transfer observed. Figure 9 (a) was found to have the highest increase in convective heat transfer while only affecting a small area when compared to the latter cooling regions. Figure 9 (d) was found to affect a larger area when compared to the other cooling regions, with its footprint being circular as depicted in Fig. 8 (d), while the other regions have an elliptical profile as shown in Fig. 8 (a) – (c).
It is hypothesized that these regions of enhanced cooling, after the bubble has attached itself to the surface, are areas of localised high vorticity corresponding to the arrival at the surface of vortices formed during the bubbles rise. It is observed that the vortices are separate from each other for large release heights, with a time de-lay between them. The time for the vortex to appear after the ini-tial bubble impact is illustrated in Fig. 10, with the third and fourth vortex taking substantially longer to impact the surface. The origin of these vortices is not fully known as fluid flow visualisation has not yet been performed.
Bubbles that have a zig-zag rise pattern have interesting vortex
shedding patterns. This flow pattern was initially investigated by Brücker [5], who determined that as the bubble turns during its rise, a chain of vortex loops with alternate circulation and orien-tation are shed. As the author noted, a vortex loop (tongue-like extension) was shed during every turn of the bubble. However, in the present study the short rise height prevents the bubble from turning before, impacting the surface, as depicted by Fig. 2. This indicates that another explanation is required for the regions of the high vorticity.
Sanada et al. [9] established that a horse-shoe type vortex is not only formed at every change in direction; instead the authors hypothesize that shape oscillations of a bubble result in periodic shedding of vortices. A similar observation was noted by Lunde & Perkins [6]. In Fig. 4, changes in the bubble’s aspect ratio were found to be present and linked to the bubble’s departure from the orifice. These shape oscillations, in turn, are conjectured to in-duce the release of vortices, although this hypothesis has yet to be confirmed by flow field measurements.
4. CONCLUSION
The results obtained in this study indicate that the wake ensuing from a single bubble, which bounces against a horizontal heated surface, has a greater enhancement effect than enhancement due to direct bubble impact on the surface. The area affected by the bubble’s wake is in the order of two bubble diameters in width and 5 – 7 diameters in length, with its effect lasting for between 4 – 6 seconds. It was found that the larger the orifice to surface distance, the greater the enhancement effect of the wake. It was noted that there were distinct localised zones of enhancement, which maybe linked to flow structures formed in the rising bubbles wake. The next phase of this work will involve PIV analysis of the flow field generated by the rising and bouncing bubble.
ACKNOWLEDGEMENT
The authors acknowledge the technical support staff of the Me-chanical and Manufacturing Engineering Department of Trinity College Dublin. The project is funded by Science Foundation Ire-land (SFI) grant number 09-RFP-ENM2151.
REFERENCES
1. A. Albadawi, D. Donoghue, A. Robinson, D. Murray, and
Y. Delauré, On the analysis of bubble growth and detach-ment at low capillary and Bond numbers using volume of
fluid and level set methods,Chemical Engineering Science,
vol. 90, pp. 77–91, 2013.
2. A. Albadawi, D. Donoghue, A. Robinson, D. Murray, and
Y. Delauré, Influence of surface tension implementation in volume of fluid and coupled volume of fluid with level set
methods for bubble growth and detachment,International
Journal of Multiphase Flow, vol. 53, pp. 11–28, 2013.
3. A. Tomiyama, G. P. Celata, S. Hosokawa, and S. Yoshida,
Terminal velocity of single bubbles in surface tension force
dominant regime,International Journal of Multiphase Flow,
vol. 28, pp. 1497–1519, 2002.
4. K. Ellingsen and F. Risso, On the rise of an ellipsoidal
[image:6.595.56.284.245.423.2]Journal of Fluid Mechanics, vol. 440, pp. 235–268, 2001.
5. C. Brücker, Structure and dynamics of the wake of bubbles
and its relevance for bubble interaction,Physics of Fluids,
vol. 11, pp. 1781–1796, 1999.
6. K. Lunde and R. J. Perkins, Shape oscillations of rising
bubbles,Applied Scientific Research, vol. 58, pp. 387–408,
1997.
7. A. W. G. De Vries, A. Biesheuvel, and L. Van Wijngaarden,
Notes on the path and wake of a gas bubble rising in pure
water,International Journal of Multiphase Flow, vol. 28,
pp. 1823–1835, 2002.
8. Z. Liu and Y. Zheng, PIV study of bubble rising behaviour,
Powder Technology, vol. 168, pp. 10–20, 2006.
9. T. Sanada, M. Shirota, and M. Watanabe, Bubble wake
visu-alization by using photochromic dye,Chemical Engineering
Science, vol. 62, pp. 7264–7273, 2007.
10. H. K. Tsao and D. L. Koch, Observations of high Reynolds
number bubbles interacting with a rigid wall,Physics of
Flu-ids, vol. 9, p. 44, 1997.
11. K. Malysa, M. Krasowska, and M. Krzan, Influence of
surface active substances on bubble motion and collision
with various interfaces,Advances in Colloid and Interface
Ccience, vol. 114, pp. 205–225, 2005.
12. R. Zenit and D. Legendre, The coefficient of restitution for
air bubbles colliding against solid walls in viscous liquids, Physics of Fluids, vol. 21, p. 083306, 2009.
13. M. A. Atmane and D. B. Murray, The effect of the liquid
motion induced by air and vapor bubbles on heat transfer
around a cylinder,International Journal of Heat and Mass
Transfer, vol. 48, pp. 1084–1095, 2005.
14. B. Donnelly, T. S. O’Donovan, and D. B. Murray, Surface
heat transfer due to sliding bubble motion,Applied Thermal
Engineering, vol. 29, pp. 1319–1326, 2009.
15. D. Donoghue, B. Donnelly, and D. Murray, The
enhance-ment effects of a plume of rising bubbles on natural
convec-tion from a heated vertical plate,Journal of Enhanced Heat
Transfer, vol. 19, 2012.
16. Y. M. C. Delauré, V. S. S. Chan, and D. B. Murray, A
simul-taneous PIV and heat transfer study of bubble interaction
with free convection flow,Experimental Thermal and Fluid
Science, vol. 27, pp. 911–926, 2003.
17. D. B. R. Kenning and O. E. Bustnes, Liquid crystal studies
of sliding vapour bubbles,Heat and mass transfer, vol. 45,
pp. 867–880, 2009.
18. Y. Y. Yan, D. B. R. Kenning, I. A. Grant, and K.
Corn-well, Heat transfer to sliding bubbles under plane and curved
surfaces, in Institution of Mechanical Engineers
Confer-ence Publications, vol. 2, pp. 295–295, Medical Engineer-ing Publications Ltd, 1995.
19. D. Qiu and V. K. Dhir, Experimental study of flow pattern
and heat transfer associated with a bubble sliding on
down-ward facing inclined surfaces,Experimental Thermal and
Fluid Science, vol. 26, pp. 605–616, 2002.
20. S. Manickam and V. Dhir, Holographic interferometric study
of heat transfer to a sliding vapor bubble,International Jour-nal of Heat and Mass Transfer, vol. 55, pp. 925–940, 2012.
21. D. B. Donoghue, Y. M. Delauré, A. Albadawi, A. J.
Robin-son, and D. B. Murray, Bouncing bubble dynamics and
as-sociated enhancement of heat transfer,Journal of Physics:
Conference Series, vol. 395, p. 012167, 2012.
22. A. W. G. De Vries, Path and Wake of a Rising Bubble.