Photo electrochemical Studies Of Li
2
Sr(MoO
4
)
2
A.B. Kalambe, M.Y. Salunkhe* and R.B. Kharat
Institute of Science, R.T. Road, Nagpur, Maharashtra, India
Abstract: Photo electrochemical electrodes of lithium based mixed molybdate of Sr (II) was prepared from solution phase. Its chemical composition was determined by estimating the metal contents in it. The material was characterized by X-ray diffraction (XRD), electrical conductivity and diffuses reflectance spectroscopy. Lithium based mixed molybdate of Sr (II) seems to be a good choice as photoanode in a PEC cell because of its 2.36 eV band gap. The flat-band potential is located at - 0.16 V vs saturated calomel electrode. The power conversion efficiency was found to be 0.19 %.
Index Terms: Semiconductor; Electrolyte; Molybdate; Solar cell; PEC Study
I. INTRODUCTION
he photo electrochemical cells (PEC) are attracting a good deal of attention for conversion of solar energy [1-4]. However, the
developments of these cells have been hindered by the relatively low conversion efficiency and poor solubility offered by semiconductor electrodes. Efforts are being made [5-8] in the direction of developing an efficient PEC cell with stable semiconductor
electrode. The important problem is to select suitable photosensitive electrodes. For effective solar energy conversion, one of the desirable properties of the semiconducting electrode is an appropriate energy band gap. In search of a photoanode material, n type semiconducting materials have been investigated. Lithium based mixed molybdate of Sr (II) is an attractive material because of its
2.36 eV band gap.
II. EXPERIMENTAL Synthesis of Li2Sr(MoO4)2
Lithium based mixed molybdate of Sr(II) was prepared by ceramic technique. appropriate molar ratio mixture of fine powder
of Li2CO3, SrCO3 and MoO3 of A.R. grade was mixed and ground in an agate mortar using 5% solution of polyvinyl acetate in A.R.
grade acetone.[9] for homogeneity with appropriate particles size. About 2 gm of powder found to be fairly satisfactory. Pellets of 1.2 cm diameter with flat parallel faces were prepared from the powder using a hydraulic press at 2 tones/inch2 pressure. The pellets were
fired at 650oC for 30 hours [10]. After the firing was over, the furnace was allowed to cool slowly to room temperature at the rate of 1oC/minute.
Characterization
The chemical composition of lithium based mixed molybdate of Sr(II) was determined by estimating its metal content [11].
Its formation was further confirmed by an X-ray diffraction (XRD) study using Philips model – PW 1700 diffractometer with CuK radiation. To characterize the material, its electrical resistivity in the range of 298K to 555K was measured with BPL-India Million Mega-ohmmeter Model RM 160 MK III. A thin layer of colloidal graphite was applied on the clean face of the pellet for providing
good electrical contact. Diffuse reflectance spectra were scanned on Shimadzu UV 260 spectrophotometer from 200 to 860 nm.
Pellets of Lithium based mixed molybdate of Sr (II) showed a high resistivity (4.8 108 ohm.cm). These pellets were sintered in hydrogen atmosphere at 773 K for two hours to enhance electrical conductivity. The resistance of pellets was brought down to nearer about 900 ohm.cm. the surface of the pellets were polished. The silver paste was applied on the surface of the pellet and fired
at 300oC for one hour. Good ohmic contact between copper wire and silver coated surface was made and this surface was covered with epoxy. This electrode acted as a photoanode.
Quartz plate. In all PEC measurements, 0.1 M Fe3+/Fe2+ was used as redox couple. Ammonium ferrous sulphate and Ammonium ferric
sulphate were used for the redox couple. The capacitance-voltage and current – voltage characteristics of the cell have been studied, measurement procedure s are described elsewhere [12].
III. RESULTS AND DISCUSSION Chemical Analysis and XRD studies:
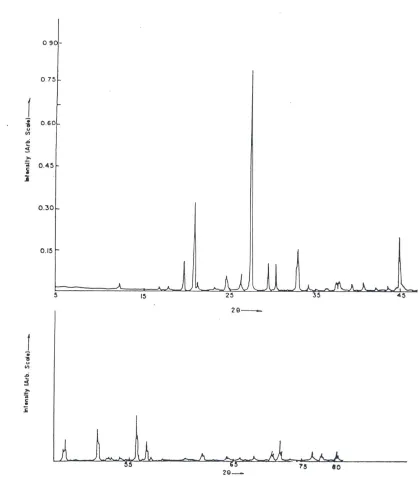
The percentage of Sr (II) present in Li2Sr(MoO4)2 was measured to be 20.79 % against a calculated value of 20.68 %. The
XRD pattern is presented in Fig. 1. The d values, the corresponding intensities of the diffracted lines and calculated hkl values of Li2Sr(MoO4)2 data shown in table 1 confirmed the formation of crystalline Li2Sr(MoO4)2. Lithium based mixed molybdates of Sr (II)
crystallizes into tetragonal system and exists in a single phase.
Electrical conductivity
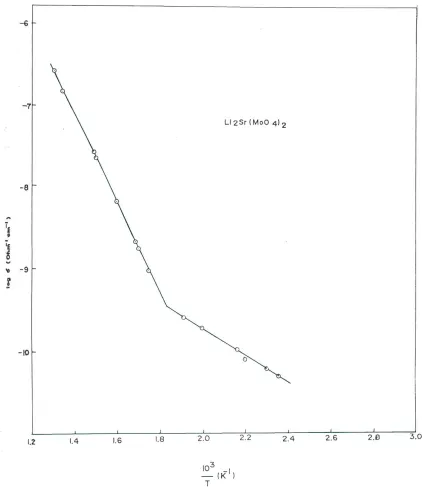
Temperature dependence of the electrical conductivity is shown in figure 2. The variation of log against 1/T showing that well known exponential law = o exp(E/KT) is obeyed in the temperature range covered. The activation energy E (eV) as
calculated from the graph has been found to be 2.09 eV. The graph also indicates that lithium based mixed molybdate of Sr (II) is
semiconducting nature.
Reflectance Spectra:
Reflectance spectra is an important tool for the determination of band gap of semiconductor [13]. The diffused reflectance
spectra was scanned from 200 to 260 nm (Figure 3). The band gap has been calculated to be 2.36 eV by this technique. The difference in the values of band gap and activation energy determined from reflectance spectra and electrical conductivity measurement respectively is attributed to different experimental conditions and the source of electron excitation.
Differential capacitance:
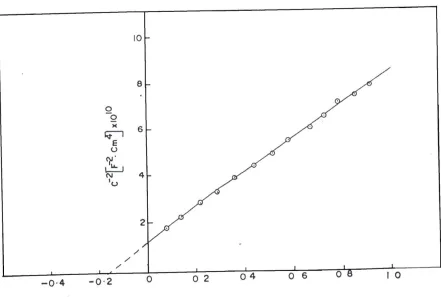
The semiconductor-electrolyte interface capacitance was measured as a function of applied voltage at a frequency of 1 KHz. Assuming that the major contribution of the capacitance arises from space charge layer; the data is plotted on the Mott-Schottky
relations.
1 2
= [(V-VFb) – (KT/9)]
C2 qoNe
Where q is charge, T is energy, Ne is the charge carrier density, is the dielectric constant of the material, o is the permittivity of the vacuum, VFb is the flat-band potential and V is the applied electrode potential. A linear curve between (1/C2) and
applied potential (Figure 4) gave on extrapolation the value of flat-band potential to be -0.16 V vs SCE.
Conversion Efficiency and Fill Factor:
The maximum conversion efficiency and the fill factor were calculated from the I – V characteristics of the PEC cell (Fig.5).
The photocurrent and photovoltage of the semiconductor electrode were measured at different bias potentials. The fill factor and conversion efficiency were calculated to be 0.42 and 0.19 % respectively. The low power efficiency is attributed to comparatively
high band gap of semiconductor [2 ] and surface recombination of photogenerated minority carriers presumably mediated by electronic state in the semiconducting material [14].
IV. CONCLUSION
It is concluded from above studies that solar to electrical conversion efficiency is quite low. However, attempts are being made to increase the conversion efficiency of lithium based molybdate of Sr (II) by using it in the form of thin film or single crystal
References
[1] F.R.F. Fan, H. White, R.H. Wheeler and A.J. Bard, J. Am. Chem. Soc. 102 (1980) 5142. [2] M. Sharon, S. Kumar, M.P. Sathe and S.R. Jawalekar, Solar Cell 12 (1984) 353.
[3] A.B. Kalambe and R.B. Kharat, Trans. SAEST 30/2 (1995) 53.
[4] M. Kumar, K. Sharan and M.J. Sharan, Sol. Energ. Mater. Sol. Cell (1998) 5135. [5] A. Hellel and B. Miller, Electrochim Acta 25 (1980) 29.
[6] A. Fujishima and K. Honda, Nature 238 (1972) 37.
[7] S. Chandra and P.K. Pandey, Physica Stat. Solidi (A) 72 (1982) 415.
[8] A.B. Kalambe and R.B. Kaharat, Progr. in Crystal Growth and Char. Mater. (2002) 141. [9] M.Y. Salunkhe and D.K. Kulkarni, J.Magn, Magn. Mater., 279 (2004) 64.
[10] G. Economous, J. Amer. Chem. Soc. 38 (1985) 241.
[11] A.I. Vogel, A text book of Quantitative Inorganic Analysis (London Eng. Lang. Book Soci.) 1978 P. 325. [12] C.D. Lokhande and S.H. Pawar, Mater. Chem. Phys. 11 (1984) 201.
Figure 5: I-V Characteristics of Photoanode.
Table 1
X ray diffraction results of Li2Sr(MoO4)2
Symmetry : Tetragonal