BIROn - Birkbeck Institutional Research Online
Carey, D. and Caprini, F. and Allen, M. and Lutti, A. and Weiskopf, N.
and Rees, G. and Callaghan, M.F. and Dick, Frederic (2018) Quantitative
MRI provides markers of intra-, inter-regional, and age-related differences in
young adult cortical microstructure. NeuroImage 182 , pp. 429-440. ISSN
1053-8119.
Downloaded from:
Usage Guidelines:
Please refer to usage guidelines at
or alternatively
Quantitative MRI provides markers of intra-, inter-regional, and age-related
differences in young adult cortical microstructure
Daniel Carey
a,b,*,1, Francesco Caprini
b,1, Micah Allen
c,d, Antoine Lutti
c,e, Nikolaus Weiskopf
c,f,
Geraint Rees
c,d, Martina F. Callaghan
c,2, Frederic Dick
b,g,2aThe Irish Longitudinal Study on Aging (TILDA), Trinity College Dublin, Dublin 2, Ireland bCentre for Brain and Cognitive Development (CBCD), Birkbeck College, University of London, UK cInstitute of Cognitive Neuroscience, University College London, Queen Square, London, UK dWellcome Trust Centre for Neuroimaging, University College London, Queen Square, London, UK
eLaboratoire de Recherche en Neuroimagerie–LREN, Departement des Neurosciences Cliniques, Centre Hospitalier Universitaire Vaudois (CHUV), Lausanne, Switzerland fDepartment of Neurophysics, Max Planck Institute for Human Cognitive and Brain Sciences, Leipzig, Germany
g
Birkbeck/UCL Centre for Neuroimaging (BUCNI), 26 Bedford Way, London, UK
A R T I C L E I N F O
Keywords:
Quantitative MRI
Multi-parameter maps (MPM) Myelination
Aging Microstructure
A B S T R A C T
Measuring the structural composition of the cortex is critical to understanding typical development, yet few in-vestigations in humans have charted markersin vivothat are sensitive to tissue microstructural attributes. Here, we used a well-validated quantitative MR protocol to measure four parameters (R1, MT, R2*, PD*) that differ in
their sensitivity to facets of the tissue microstructural environment (R1, MT: myelin, macromolecular content; R2*:
myelin, paramagnetic ions, i.e., iron; PD*: free water content). Mapping these parameters across cortical regions in a young adult cohort (18–39 years, N¼93) revealed expected patterns of increased macromolecular content as well as reduced tissue water content in primary and primary adjacent cortical regions. Mapping across cortical depth within regions showed decreased expression of myelin and related processes–but increased tissue water content–when progressing from the grey/white to the grey/pial boundary, in all regions. Charting develop-mental change in cortical microstructure cross-sectionally, we found that parameters with sensitivity to tissue myelin (R1&MT) showed linear increases with age across frontal and parietal cortex (change 0.5–1.0% per year).
Overlap of robust age effects for both parameters emerged in left inferior frontal, right parietal and bilateral pre-central regions. Ourfindings afford an improved understanding of ontogeny in early adulthood and offer normative quantitative MR data for inter- and intra-cortical composition, which may be used as benchmarks in further studies.
A core challenge for human neuroscience is the design of robust anatomical imaging methods that are sensitive to inter-regional differ-ences in tissue properties, and to profiles of intra-cortical tissue change from the grey-white border to the pial surface in any one region. The parcellation of human cortex based on cyto- and myeloarchitectonic boundaries has been a major pursuit since the work of Brodmann and Flechsig in the early 20th century (Sereno et al., 2013; Glasser et al., 2016; Turner, 2015; Nieuwenhuys, 2013; Nieuwenhuys et al., 2014; Zilles et al., 2015). However, it is only recently that such questions have been addressedin-vivoin humans. This is made possible by the use of magnetic resonance imaging (MRI), which can provide data for
morphometry (Ashburner and Friston, 2000; Dale et al., 1999; Fischl et al., 1999a, 1999b) or microstructure (Weiskopf et al., 2015).
The MR signal is sensitive to many important tissue properties, such as iron content, myelin, cell density and water content; however, the contrast-weighted images (T1w, T2w) typically used in MRI reflect a
complex mix of these properties that can vary non-linearly across the imaged volume. By comparison,Quantitative MRI (Bock et al., 2013; Barazany and Assaf, 2012; Dinse et al., 2013, 2015; Stüber et al., 2014; Marques et al., 2010; for review, seeTurner, 2015, 2016; Bazin et al., 2014; Cohen-Adad, 2014; Sereno et al., 2013; Dick et al., 2012) can be used to map specific MRI properties of tissue in order to provide indices
* Corresponding author. The Irish Longitudinal Study on Aging (TILDA), Trinity College Dublin, Dublin 2, Ireland.
E-mail address:[email protected](D. Carey). 1Sharedfirst authorship.
2Shared senior authorship.
Contents lists available atScienceDirect
NeuroImage
j ourna l home page:www.el se vier.com/loca te/ ne uroi ma ge
https://doi.org/10.1016/j.neuroimage.2017.11.066
Received 17 May 2017; Received in revised form 19 October 2017; Accepted 29 November 2017 Available online xxxx
1053-8119/©2017 The Author(s). Published by Elsevier Inc. This is an open access article under the CC BY license (http://creativecommons.org/licenses/by/4.0/).
of microstructure, myelination and related cellular processes (Helms et al., 2008a, 2009; Weiskopf et al., 2013; Lutti et al., 2014) in a time-efficient manner with high spatial specificity. It thus provides the op-portunity to acquire a multi-modal, whole-brain view of developmental changes in underlying tissue properties.
In the multi-parameter mapping (MPM) quantitative imaging proto-col (Weiskopf et al., 2013; Callaghan et al., 2014b; Helms et al., 2008a, 2008b; Lutti et al., 2014), multiple maps are constructed to probe different tissue attributes. These are 1) the longitudinal relaxation rate, R1¼1/T1(sensitive to myelin, macromolecular content, iron and water);
2) the effective transverse relaxation rate, R2*¼ 1/T2* (sensitive to
susceptibility effects due to paramagnetic ions, most notably iron, myelin distribution andfibre orientation); 3) Magnetization Transfer (MT; sen-sitive to macromolecular content and bound water fraction); and 4) effective Proton Density (PD*; sensitive to free water content and resid-ual R2* related effects) (Weiskopf et al., 2011; Callaghan et al., 2014a,
2014b; Lutti et al., 2014; Stüber et al., 2014; Fukunaga et al., 2010; Cohen-Adad et al., 2012; Mangeat et al., 2015; Lee et al., 2010, 2011; Bender and Klose, 2010; Denk et al., 2011). These methods allow quantitative measurement of inter- and intra-regional differences in tis-sue properties (e.g.,Cohen-Adad et al., 2012, 2014; Govindarajan et al., 2015; Dinse et al., 2015; Marques et al., 2017) including age-related changes in subcortical fibre tract myelination (Yeatman et al., 2014), pathological changes in neurotrauma (Freund et al., 2013), maturation effects (Whitaker et al., 2016), and age-related tissue de-myelination (Callaghan et al., 2014a), whilst affording the means to do so in rela-tion to funcrela-tional ability (e.g., Gomez et al., 2017). Such mapping methods have also been used to identify the heavily-myelinated bound-aries of visual (Sereno et al., 2013; but seeAbdollahi et al., 2014), pri-mary auditory (Dick et al., 2012; de Martino et al., 2015; Sigalovsky et al., 2006), and somatomotor areas (Carey et al., 2017), when relating these regions to function.
Charting the normal development and aging of human cortical tissue is a fundamental goal of neurobiology, and is also critical for accurately characterizing atypical development, individual differences, and short-and long-term plasticity. Development is reported to follow a posterior-to-anterior gradient with primary areas maturing earliest in life and as-sociation areas, which mediate higher-order functions, developing later (Gogtay et al., 2004; for review of processes, seeMarsh et al., 2008). At earlier points in development through adolescence, there is evidence to suggest that deviation from typical trajectories may increase vulnera-bility to psychiatric disorders (Thompson et al., 2001; Greenstein et al., 2006; Sowell et al., 2003; Shaw et al., 2007) whereas in later life, such deviation may be indicative of neurodegenerative decline, for which age is often the greatest predictor (Barkhof et al., 2009; Bartzokis, 2004, 2011; Frisoni et al., 2010). A cornerstone in the development of mature cortex is the emergence of myelinated fibres within the cortical sheet (Flechsig, 1920; Yakovlev and Lecours, 1967; Deoni et al., 2015). Though the exact trajectories are unclear, the rate at which change occurs–and the age at which development stabilizes – are thought to be region-specific (e.g.Yeatman et al., 2014; Whitaker et al., 2016) and to interact with functional organization (e.g.Yeatman et al., 2012; Gomez et al., 2017).
To date, few quantitative imaging studies have explored develop-mental changes in tissue composition across cortex from late adolescence to the mid-thirties. This is a crucial age range to characterize, not least because it is the 'sample of choice' for the vast majority of structural and functional MRI studies. Here, we used the multi-parameter mapping (MPM) protocol (Weiskopf et al., 2013; Callaghan et al., 2014a, 2014b; Helms et al., 2008a, 2008b) to explore potential parameter-specific (R1,
MT, PD*, R2*) variation in tissue over the depth of the cortical sheet, and
across a range of cortical regions. Further, we charted age-related dif-ferences in cortical microarchitecture across early adulthood. We map-ped a set of normative, cortical-depth-specific regional MPM values for young adults that can be used as reference values for future studies.
Moreover, we found considerable, region-specific age-related changes in parameters related to the degree of tissue myelin content and myelin-related processes.
Materials and methods
Participants
Participants were 93 right-handed healthy adults (mean age±SD: 23.6 ± 4.3; range: 18–39; 57 female, 36 male). The study received approval from the local ethics committee. All scanning took place at the Wellcome Trust Centre for Neuroimaging (WTCN), London.
Participants were sampled over approximately 24 months. Thirty-four participants were recruited as part of a study of musicianship and consisted of expert violinists (n¼18; mean age±SD: 22.8±2.8; 13 female, 5 male) and closely matched non-musicians (n ¼ 16; mean age±SD: 23.3±3.1; 12 female, 4 male). All had completed or were enrolled in a university degree, and were recruited from the University of London, music conservatories in London, and local participant pools. We analyzed data for effects of violin expertise and will report thesefindings in a subsequent report. In brief, effects of violin expertise in cortex were modest and emerged only in ROI analyses of primary auditory cortex, where we found limited evidence of significant age-related effects in the present study.
The remaining participants (n¼59; mean age±SD: 23.9±4.9; 32 female, 27 male) were sampled from the general population through local participant pools. These subjects took part in three experiments: one exploring the potential association between auditory perceptual abilities, musicianship, tonotopic organization and structural properties of the auditory cortex (data not reported here), one investigating the relation-ship of trait empathy and brain microstructure (Allen, Frank, et al., 2017), and a third investigating metacognition and MPM assays (Allen et al., 2017).
There was no significant difference in age between genders across the full cohort (z¼0.85,p>0.4), nor any significant effects of gender on MPMs in any models (allp>0.3).
Data acquisition
The multi-parameter mapping protocol data (Weiskopf et al., 2013; Lutti et al., 2010, 2012) were acquired at the WTCN using a 3T whole-body Tim Trio system (Siemens Healthcare) with radiofrequency whole-body coil for transmission and a 32-channel head coil for signal reception. The MPM protocol consisted of three differently weighted 3D multi-echo FLASH acquisitions acquired with 800 μm isotropic resolution. Volumes were acquired with magnetization transfer (MTw), T1-(T1w),
and proton density (PDw) weighting. The MT weighting was achieved
through application of a Gaussian RF pulse (4 ms duration, 220 nom-inal flip angle) applied 2 kHz off-resonance prior to non-selective excitation.
Two further scans were collected to estimate participant-specific in-homogeneities in the RF transmitfield (B1þ) using a 3D EPI acquisition of
spin-echo (SE) and stimulated echo (STE) images as described inLutti et al. (2010) (slice thickness: 4 mm; matrix size: 64 48 x 48; field-of-view: 256192192 mm3; bandwidth: 2298 Hz/pixel; SE/STE acquisition time post-excitation: 39.38 ms/72.62 ms; TR: 500 ms). In addition, a map of the B0field was acquired and used to correct the B1þ
map for off-resonance effects (Lutti et al., 2010; see alsoWeiskopf et al., 2006) (voxel size: 332 mm3; slice thickness: 4 mm;field-of-view: 192192 mm2; 64 slices, 1 mm gap; bandwidth: 260 Hz/pixel; TE1 10 ms, TE2 12.46 ms; TR: 1020 ms;flip angle: 90).
Cohort 1
Afield of view of 256224166 mm3was used with a matrix size of 320280 x 224. The PDwand T1wvolumes were acquired with a TR
of 25.25 ms and aflip angle of 5and 29respectively. The MTwvolume
was acquired with a TR of 29.25 ms and excitationflip angle of 9. The excitation employed a hard pulse; RF spoiling was used with an incre-ment of 50, and gradient spoiling producing 6*pi dephasing across a voxel. The acquisition was accelerated by using GRAPPA (with a parallel imaging factor of 2 with 18 integrated reference lines) in the phase-encoded direction (AP) and by a partial Fourier acquisition in the partition direction (RL, with factor 6/8). To improve image quality (maximize SNR and minimize geometric distortion at the same time), eight gradient echoes with alternating readout polarity were acquired with high readout bandwidth (460 Hz/pixel) with echo times ranging from 2.39 ms to 18.91 ms in steps of 2.36 ms.
A fixed modification of MPM image slab orientations (30) was applied for some subjects to counter image artifact due to eye move-ment and blinking; this change in the acquisition did not yield any significant differences (testing binary main effect of slab rotation pre-sent/absent;p<0.01, whole-brain uncorrected) for any map (R1, PD,
MT, R2*) between subjects with and without slab rotation (seefootnote
3). Image slabs for field maps were all non-rotated along the axial orientation.
The B1 mapping acquisition consisted of 15 measurements with
nominalflip angle ranging from 135to 65in 5decrements. The total scanning time of the MPM protocol was approximately 37 min.
Cohort 2
For the second cohort, the MPM protocol was modified to improve accuracy by accounting for non-linearities in the transmit chain (Lutti and Weiskopf, 2013). To achieve this, differentflip angles for the PD-, MT- (both 6) and the T1- (21) weighted acquisitions were achieved by
scaling the duration of the pulse while maintaining a constant B1þ amplitude (i.e. a consistent operating point for the RF amplifier) that additionally matched that used for the B1þmapping sequence. Gradient
echoes were again acquired with alternating readout gradient polarity using a readout bandwidth of 488 Hz/pixel. Eight equidistant echo times ranging from 2.34 to 18.44 ms in steps of 2.3 ms were acquired for the PDwand T1wacquisitions. Only thefirst six echoes were acquired
for the MT-weighted acquisition in order to maintain a 25 ms TR for all of the FLASH volumes. To further accelerate the data acquisition, the partial Fourier acquisition scheme in the partition direction was replaced by parallel imaging with an acceleration factor of 2 again using the GRAPPA algorithm, now with 40 integrated reference lines in each phase-encoded direction. A 30 slab rotation was used for all acquisi-tions in this cohort.
The B1 mapping acquisition consisted of 11 measurements with
nominalflip angle ranging from 115to 65in 5decrements. The total
scanning time of the MPM protocol was approximately 26 min.
Procedure
Participants provided written informed consent and were screened for contraindications for MRI. B1þand B0field maps were collected at the
beginning of each session, followed by the MT, PDw, and T1w scans.
Participants’eye and head movements were monitored using an eye tracker (Eyelink 1000 Core System) during scanning runs. Rest breaks of several minutes were provided between scans as required.
Data pre-processing
Images were pre-processed using the Voxel Based Quantification (VBQ) toolbox in SPM 8. In brief, regression of the log signal from the echoes of all weighted volumes were used to calculate a map of R2* using
the ordinary least squares ESTATICS approach (Weiskopf et al., 2014). The set of echoes for each acquired weighting were then averaged to increase the signal-to-noise ratio (Helms and Dechent, 2009). This was done using only thefirst six echoes for Cohort 2. The 3 resulting volumes were used to calculate MT, R1, and PD* maps as described inHelms et al.
(2008a, 2008b)andWeiskopf et al. (2013). Quantitative R1values at
each voxel were estimated based on the rational approximation of the Ernst equation described byHelms et al. (2008a). To maximize the ac-curacy of the R1map, these maps were corrected for transmitfield
in-homogeneities by constructing a map from the calibration data according to the procedure detailed inLutti et al. (2012). The R1maps were also
corrected for imperfect spoiling characteristics using the approach described byPreibisch and Deichmann (2009). The MT map was con-structed using the procedure described inHelms et al. (2008b). This is a semi-quantitative metric depicting the percentage loss of magnetization resulting from the MT pre-pulse used and differs from the commonly used MT ratio (percentage reduction in steady state signal) by explicitly ac-counting for spatially varying T1relaxation times andflip angles (
Weis-kopf et al., 2013). Finally, PD* maps were estimated from the signal amplitude maps by adjusting for receive sensitivity differences using a post-processing method similar to UNICORT (Weiskopf et al., 2011). To make the PD*maps comparable across participants, they were scaled to ensure that the mean white matter PD* for each subject agreed with the published level of 69% (Tofts, 2003). This quantity is referred to as effective PD (PD*) because it was calculated based on the average FLASH volumes and there was no correction for R2* signal decay.
Following reconstruction of multi-parameter images, all images were manually inspected for any evidence of alignment difficulties, head movement or other image artifacts (e.g., aliasing) by a rater who was blind to subject identity.
Cortical surface reconstruction
Participants’cortical surfaces were reconstructed using FreeSurfer (v. 5.3;Dale et al., 1999). Use of multi-parameter maps as input to Free-Surfer can lead to localized tissue segmentation failures due to bound-aries between the pial surface, dura matter and CSF showing different contrast compared to that assumed within FreeSurfer algorithms (Lutti et al., 2014). Therefore, an in-house FreeSurfer surface reconstruction procedure was developed to overcome these issues. Full details of the processing pipeline are provided in supplemental methods.
Data analyses
Following cortical surface reconstruction, R1, MT, R2* and PD* data
were mapped onto participants’cortical surfaces in FreeSurfer. Whole-brain vertex-wise analyses were subsequently performed. Description follows below (2.4.1&2.4.2).
MPM data extraction
First, all subjects were rotated to the same (canonical) orientation, using the AFNI 3dwarp routine (-deobliqueflag). MPM data were then 3For thefirst MPM cohort (n¼34), T1w, PDwand MT images were acquired with
mapped onto each subject's surface (using the FreeSurfer mri_vol2surf routine). For each reconstructed hemisphere, quantitative data were sampled along the normal to each surface vertex, for cortical depth fractions from 0.1 (i.e., above white matter surface boundary) to 0.9 (i.e., beneath pial surface boundary) in increments of 0.1 (see Dick et al., 2012).
Analyses
For each relaxation parameter (R1, MT, R2*, PD*), wefirst created
cross-subject hemisphere-wise average maps for each cortical depth sampling fraction (0.1–0.9) using cortical-surface-based methods with curvature-based alignment (Fischl et al., 1999a,b; Hagler and Sereno, 2006; Dick et al., 2012; Sereno et al., 2013). In each of a series of cortical regions-of-interest, selected to sample from a range of primary, second-ary, and tertiary areas across the brain, we extracted hemisphere-wise mean estimates of each relaxation parameter across depth fractions. Cortical regions were defined from a standard FreeSurfer atlas (aparc.2009), and sampled onto each subject's cortical surface during reconstruction. Regions were: superior pre-central sulcus; subcentral gyrus/sulcus; inferior pre-central sulcus; inferior frontal sulcus; middle frontal sulcus; superior parietal gyrus; angular gyrus; Heschl's gyrus; inferior occipital gyrus/sulcus; superior temporal gyrus/planum tempo-rale; probabilistic area MT; probabilistic V1; posterior collateral sulcus; superior occipital gyrus; parieto-occipital sulcus; subparietal sulcus; middle cingulate gyrus/sulcus. ROI mean estimates for each relaxation parameter were averaged across hemispheres at each cortical depth fraction sampled (0.1–0.9). Previous histological and MR literature has demonstrated non-linear change in tissue properties related to myelin processes, progressing from the grey-white to grey-CSF boundary ( Ann-ese et al., 2004; Walters et al., 2003; Whitaker et al., 2016; Stüber et al., 2014; Waehnert et al., 2016; Dinse et al., 2015). Here, multi-level models werefitted to ROI mean estimates for each MPM to model linearity versus non-linearity of parameter change across depth fractions, whilst ac-counting for variance across subjects and ROIs. For each parameter, we specifiedfixed effects of MPM cohort, ROI, gender, as well as interaction terms for depth that specified quadratic or cubicfits. Each model also included random effects of subject and ROI (i.e., three-level hierarchy: depth fractions nested within ROIs, and ROIs nested within subjects). We initially tested models with and without linear random (i.e., person-specific) slopes across depth fractions (i.e., nested within ROIs), and found thatfits were always significantly improved with the addition of linear random slopes (allp<0.0001, likelihood ratio test); thus linear random slopes were specified in all models. Models werefirst specified for each MPM with linearfixed effect terms for depth, and latterly with quadratic and cubic interactionfixed effect terms for depth. Likelihood ratio tests were used to compare model log-likelihoods, testing whether addition of each non-linear term yielded any robust change in modelfit, relative to the simpler alternative model (i.e., linear vs. quadratic, quadratic vs. cubic). All multi-level models werefitted in STATA 14 (STATA Corp).
For age-based analyses, we used participants' age in whole years as a continuous linear regressor at each vertex per hemisphere, with initial analyses carried out in Qdec (FreeSurfer v. 5.3). For age analyses, each subject's data were smoothed with a surface (2D) kernel of 10 steps (approximating a Gaussian 2D kernel of 3 mm FWHM; Hagler et al., 2006). Vertex-wise age analyses are reported sampling at 0.5 cortical depth. To avoid inflation of type-1 error that would have resulted from running vertex-wise analyses for all cortical depth fractions, this depth fraction was selected as the most representative of mid-cortical depth profiles (Dick et al., 2012; Sereno et al., 2013; Lutti et al., 2014; cf.
Waehnert et al., 2014). However, we also explored potential interactions of age effects across depth fractions and ROIs (further toWhitaker et al., 2016) using multi-level models. Specifically, the following interaction terms were added to the models described above asfixed effects: age x depth; age x ROI; age x depth x ROI.
Previous studies have found that R1 values are associated with
variation in the local curvature and thickness of the cortex; thus, R1
measurements tend to be increased in thicker, more highly convex re-gions (e.g., gyral crowns) (Sereno et al., 2013; Dick et al., 2012; Waehnert et al., 2014). In addition, changes in the MPM acquisition protocol between the cohorts we scanned here (see 2.2.1&2.2.2) were associated with differences in MPM map values. The second cohort, scanned with the protocol that better addressed non-linearities in the transmit chain, showed consistently greater (up to ~15%) R1 values
with a gently spatially varying pattern that could be reproduced by comparing results in a single individual subject scanned across both protocols. Therefore, to control for these effects, we regressed out local curvature, cortical thickness and MPM cohort (see alsoGrydeland et al., 2013); we then performed Pearson correlations at each vertex between age and MPM values that were residualized by curvature, thickness and MPM-cohort. In general, curvature-, thickness-, and cohort-residualized age regressions were similar to age regressions using raw param-eter values.
To produce unbiased estimates of age effects on each parameter we used a‘leave-one-out’ jackknife procedure. Here, wefirst performed vertex-wise age-MPM Pearson correlations for the full cohort, and then repeated the procedure iteratively omitting one subject in each instance. Pearson r-values for the full cohort and each leave-one-out partial estimate were Fisher z-transformed, and a mean of partial esti-mates calculated. Jackknife estiesti-mates at each vertex were calculated as: (N)(T) - (N-1)(Tm), where N¼ 93; T ¼full cohort z-transformed r -value; Tm ¼ mean of partial estimates (z-transformed before aver-aging). Finally, vertex-wise Jackknife estimates were re-transformed to r-values and correspondingpvalues were calculated. The jackknifing procedure was performed in regression models with age as a vertex-wise predictor of raw MPM values, and also in regression models with age as a vertex-wise predictor of cohort-, thickness- and curvature-residualized maps.
Jackknifed statistical maps were thresholded using peak-level False-Discovery Rate (FDR) correction (Benjamini and Hochberg, 1995); FDR-correctedq<0.05, per hemisphere. For illustrative purposes, we also identified regions where significant jackknifed effects of age over-lapped for both the R1and MT multi-parameter maps. Note that these
maps show greatest sensitivity to cortical myelin, and thus were of central interest here (see Lutti et al., 2014; Sereno et al., 2013). Per hemisphere, we determined the vertices that survived FDR-correction (q <0.05) for jackknifed age analyses of the cohort-, thickness- and curvature-residualized MPMs (i.e., R1 &MT). Using Matlab, we then
created a binary mask per hemisphere corresponding with vertices where the jackknifed model results for both MPMs showed FDR-significant effects of age. Clusters of vertices reflecting the un-smoothed overlap of the age effects for the two MPMs (R1&MT) were
extracted and defined as ROIs on a standard cortical surface; ROIs were sampled onto each subject's cortical surface. Across each of these ROIs, we plotted the linear relationship between age and subject-wise ROI means for R1and MT.
Cortical-surface-averaged group data for each parameter as well as all individual subject data and analysis scripts are available at:https://doi. org/10.18743/DATA.00011.
Results
Group average MPM results
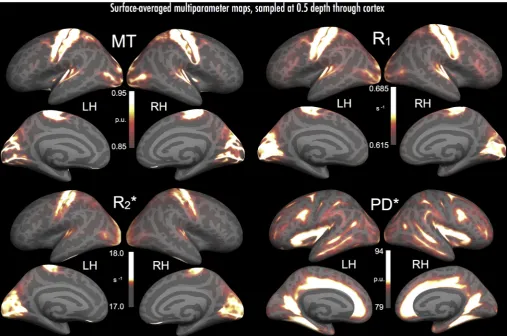
Average MPMs (Fig. 1) revealed the expected inter-regional differ-ences in cortical myelin and myelin-related processes, in line with previous literature. Parameters that show greatest sensitivity to myelin and related processes (R1, MT, and R2*), had highest values within
motor and sensory regions, including somatomotor, auditory, and vi-sual cortex. Further to previous studies (Glasser and Van Essen, 2011; Glasser et al., 2016; Sereno et al., 2013; Waehnert et al., 2016; Bock et al., 2013; Mangeat et al., 2015), R1, MT and R2* revealed strips of
dense myelination over pre-central and post-central regions, presum-ably in areas 4 and 3b/1, respectively, with an intervening lower-myelin septum (likely area 3a; Geyer, 2013; Dinse et al., 2015; Stüber et al., 2014; see alsoGlasser and Van Essen, 2011). R1, MT and
R2* also revealed the heavily myelinated auditory core at the most
medial aspect of Heschl's gyrus (Dick et al., 2012; Sigalovsky et al., 2006; de Martino et al., 2015); planum temporale and parts of lateral superior temporal gyrus (STG) additionally showed elevated R1and MT
values (see Glasser and Van Essen, 2011; Glasser et al., 2016; Siga-lovsky et al., 2006). In visual areas, R1and R2* exposed the heavily
myelinated V1 extending across the calcarine sulcus (Sereno et al., 2013; Fracasso et al., 2016; Cohen-Adad et al., 2012); however, parameter MT showed high values that were restricted to gyral banks flanking the calcarine sulcus (Fig. 1, parameter MT medial surface panels). A possible source of this difference is the local contribution of myelin differences to macromolecular effects at gyri, versus the more anatomically diffuse effects of iron associated with oligodendrocyte cell bodies–contributing in part to the R1signal, via R2*–found across
sulci (e.g., Stüber et al., 2014; see 3.3, and discussion, 4.1).
Alternatively, local patterns of cortical folding and curvature may have influenced the detection of macromolecular content by MT in highly concave cortical regions; cortical thickness in sulcal depths (and indeed much of V1) is roughly twice the voxel dimensions, and therefore the contribution of the thin myelinated layers to the overall contrast will be attenuated.
R1, MT and R2* additionally revealed higher visual areas including V6
(medial surface, dorsal to V1), V3/V3a (lateral surface, dorsal to V2), and area MT (proximal to postero-lateral bounds of inferior temporal sulcus). R1and MT also revealed several heavily myelinated cortical regions
posterior to post-central gyrus, likely including multi-modal VIP and LIP (Sereno et al., 2013; Glasser and Van Essen, 2011; Waehnert et al., 2016; Huang et al., 2012). Foci of high R1and MT potentially co-located with
the frontal eyefields also emerged, lying proximal to the dorsal-most aspect of the middle frontal gyrus and the boundary with pre-central gyrus (Glasser et al., 2016; Glasser and Van Essen, 2011; Sereno et al., 2013). PD* revealed a more distinct patterning of regions than the other MPMs, reflecting its high affinity for unbound protons (i.e., tissue water;
[image:6.595.44.552.54.390.2]Baudrexel et al., 2016). Regions typically low in myelination (see Nieu-wenhuys, 2013; Nieuwenhuys et al., 2014; Geyer, 2013; Zilles et al., 2015) tended to show highest PD* values, including: the circular sulcus and adjoining insular cortex; cingulate gyrus and sulcus; medial pre-frontal cortex; collateral sulcus; parieto-occipital sulcus and regions anterior to V1; superior temporal sulcus; middle temporal gyrus; inferior frontal sulcus; and presumptive Area 3a. PD* also tended to show highest values in sulci and locally concave cortex, a rough mirror image of the distribution for the other three parameters, and likely due to the lower overall myelination that has been noted in sulci.
Intra-regional MPM results
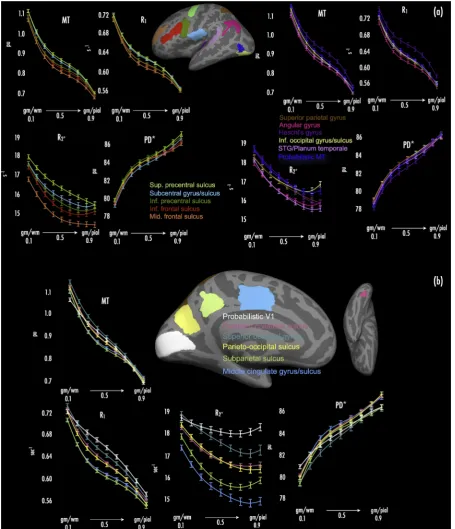
Across depth fractions, we observed the expected pattern of decrease in R1and MT values over all cortical ROIs (Fig. 2a and b). Reduction in R1
and MT values broadly followed a decaying pattern, with sharpest de-creases at depth fractions close to the white matter and pial surfaces (0.1 and 0.9, respectively; see Fig. 2a and b). In line with previous work (Annese et al., 2004; Dinse et al., 2015), this likely reflects the reduction in myelinatedfibre density with progression away from the white matter
surface toward the pial surface. In modeling the reduction in R1and MT
values over the cortical sheet in each ROI, we found that cubic trends provided the bestfit in every region, versus linear and quadratic trends (p<0.0001, likelihood ratio test vs. quadratic model).
R2* values also decreased across all ROIs progressing from the white
matter to the pial surface. Modeling the reduction in R2* values,
[image:7.595.71.527.55.585.2]quadratic trends provided the bestfit to data across depth fractions in all ROIs (versus linear and cubic trends–bothp<0.0001). In many ROIs, R2* values showed an upward trend after the initial decrease, particularly
at cortical depths close to the pial surface (i.e., 0.8 and 0.9 cortical depth). This pattern was noted in regions including probabilistic MT/V5, inferior occipital gyrus/sulcus, inferior frontal and inferior pre-central sulci, and angular gyrus (seeFig. 2a), as well as probabilistic V1, supe-rior occipital gyrus, and subparietal sulcus (seeFig. 2b). A likely cause of this is the presence of blood vessels close to the pial surface, where high levels of iron within hemoglobin would elevate observed R2* values (see
footnote 4).
PD* values showed increases toward the pial surface from the white matter surface, across all ROIs. Similar to R1and MT values, change in
PD* values was greatest at depth fractions proximal to the white matter and pial surfaces (0.1 and 0.9, respectively), with PD* values showing high growth there (cf. the declines noted in R1and MT values). In all
ROIs, cubic trends provided the best fit to PD* increases over depth fractions (fits specified as above for R1and MT).
Inter-regional MPM results
Across cortical ROIs, we found clear differences in the mean values of R1, MT, R2* and PD* parameters, marked by substantial changes in those
parameters when sampling across primary and non-primary cortical ROIs.
As expected given previous literature (Glasser et al., 2014; Glasser and Van Essen, 2011; Sereno et al., 2013; Dick et al., 2012; Sigalovsky et al., 2006; Bock et al., 2013; de Martino et al., 2015; Waehnert et al., 2016; Turner, 2015; Nieuwenhuys, 2013), MPMs with highest sensitivity to cortical myelin (R1, MT) showed elevated values in ROIs subsuming or
proximal to primary cortical areas. These regions included Heschl's gyrus (Fig. 2a, mauve trace), superior and inferior pre-central sulcus (Fig. 2a, light and dark green traces, respectively), subcentral gyrus/sulcus (Fig. 2a, light blue trace), and probabilistic V1 (Fig. 2b, white trace). R1
values in probabilistic V1 were elevated compared to other regions, but note that MT values in probabilistic V1 were not elevated to the same extent seen for R1(see alsoFig. 1, MT panels). Other non-primary regions
partly characterized by heavier cortical myelin (probabilistic area MT/ V5;Walters et al., 2003; Sereno et al., 2013) also had increased R1and
MT values (Fig. 2a, dark blue trace).
R2*, which typically shows high affinity for tissue iron (a related
property of myelinating oligodendrocyte processes; Fukunaga et al., 2010; Todorich et al., 2009), myelin distribution (seeCohen-Adad, 2014; Mangeat et al., 2015; Maneiro et al., 2015), andfibre orientation (Lee et al., 2010, 2011; Denk et al., 2011; Bender and Klose, 2010; Cohen-Adad et al., 2012), was elevated in most of the regions noted above that were proximal to (or inclusive of) primary cortex and that showed elevated R1and MT values (i.e., Heschl's gyrus, superior and inferior
pre-central sulcus, subpre-central gyrus/sulcus and probabilistic V1). As ex-pected, probabilistic area MT also showed elevated R2* values.
Impor-tantly, surface averaged MPM data (Fig. 1) further suggested that foci of high R2* were displaced towards sulcal regions adjacent to foci of high R1
and MT, with R1and MT foci manifesting largely at gyri (e.g., compare
R2* foci at Heschl's sulcus bilaterally, versus R1and MT foci at medial
Hesch's gyrus,Supplemental Fig. 2). Regions of association cortex (e.g., subparietal sulcus, middle cingulate gyrus/sulcus) generally associated with light myelination (Glasser and Van Essen, 2011; Cohen-Adad et al., 2012), showed low R2* and correspondingly low R1 and MT values
(Fig. 2b, light green and light blue traces).
PD* tended to be reduced in heavily-myelinated areas (e.g., Heschl's gyrus;Fig. 2a, mauve trace). However, we note that inter-regional PD* curves did not reflect a strict‘mirror-image’of areas with elevated R1and
MT values. For instance, while superior pre-central sulcus (Fig. 2a, light green traces) showed elevated R1and MT curve values, PD* curve values
in this region were also increased compared to adjacent cortical areas (seeFig. 2a, PD* panel).
Age effects on R1/MT/R2*
Exploring development of myelin and related tissue processes cross-sectionally, we correlated age in years with vertex-wise R1, MT and
R2* values that had been residualized by cortical thickness, curvature and
MPM cohort (see 2.4.2). To limit bias in modelfits, we calculated ‘leave-one-out’estimates of models per MPM using a jackknifing procedure (see 2.4.2).
We found evidence of significant (FDRq <0.05 per hemisphere) correlations between age and R1, and age and MT, across the lateral
cortical surface. However, we did notfind any regions where age and R2*
correlations survived with FDR-correction (q>0.05) (but see below). Positive age-R1correlations (i.e., increasing R1with age;Fig. 3a) were
widespread, extending across much of pre-frontal, frontal and parietal cortex bilaterally. These positive age-R1 correlations were observed
bilaterally at pars opercularis, middle frontal gyrus (MFG), pre-central gyrus and central sulcus, superior frontal gyrus, and superior and infe-rior parietal lobules (including angular and supramarginal gyri). Addi-tional positive correlations were found in right occipito-temporal regions, including a peak proximal to visual area MT/V5. A further peak emerged at right superior temporal sulcus.
Significant positive age-MT correlations were less extensive than those observed for age-R1(seeFig. 3b). The largest age-MT peaks
man-ifested at left pre-central gyrus and central sulcus, along with a series of peaks across right pre-central gyrus. Other smaller peaks emerged at right supramarginal gyrus, left pars opercularis, right MFG, and right superior parietal lobule.
Exploring age effects within ROIs, wefitted multi-level models testing fixed main effects of MPM cohort, gender, age, ROI and depth fraction (depthfitted with linear and non-linear terms), along with age x ROI and age x ROI x depth fraction interactions. MT, R1and R2* each showed
robust main effects of the age and depth fraction terms, with significant differences found amongst ROIs (seeSupplemental Tables 1–3). Notably, although age effects on R2* were not robust in the vertex-wise analysis
(see above), age was a significant predictor of R2* in the multi-level
analysis (slope: 0.053 [~0.3%/year]). Importantly, age depth in-teractions for each parameter were also significant (allp<0.01); in line with previous studies (Whitaker et al., 2016), this suggests that effects of age were attenuated moving closer to the pial surface. Age x ROIdepth interactions also reached significance for each parameter; however, the coefficients associated with these three-way interactions were small, suggesting the change in age effects across depth fractions and between ROIs were subtle.Supplemental Tables 1–3summarize these effects for MT, R1 and R2*; effects are plotted across age quintiles in
Supple-mental Fig. 1.
Finally,Supplemental Fig. 3shows a map of age-related changes in cortical thickness (all decreases) with cohort and slab rotation as nuisance factors; along the inferior, middle, and superior frontal gyri as well as the supramarginal gyrus, these changes were concordant in part with those reported byWhitaker et al. (2016)andHogstrom et al. (2012)
for younger and older cohorts with large age ranges, but unlike these studies did not show any age-related thickness decreases posteriorly. 4To our knowledge, ours are thefirstin vivodata to demonstrate elevation of R2* values
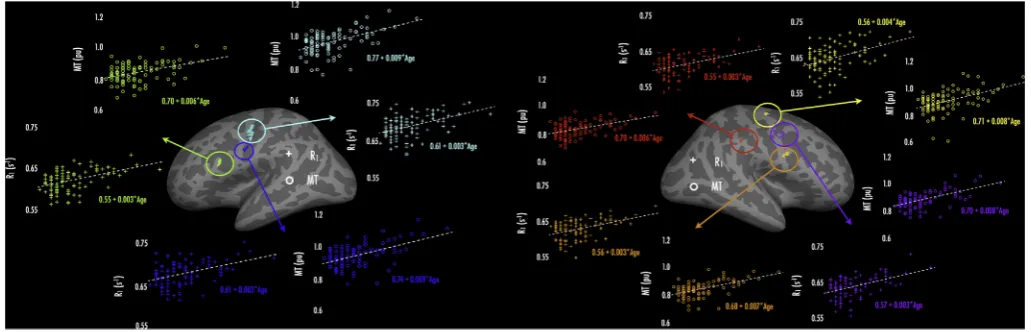
Overlap of age effects - R1and MT
As a way to explore the extent to which age effects were common to both R1and MT, we compared age effects for overlapping significant
vertices in both analyses. We isolated vertices over each hemisphere where both R1 and MT (corrected for covariates) had shown
FDR-significant jackknifed age correlations (i.e., vertex-wiseq<0.05), and then defined these regions as ROIs, which we sampled onto each subject's surface (see 2.4.2).Fig. 4presents age (range: 18–39 years) regressed against the ROI mean R1or MT value per subject, over each hemisphere.
(Note that the definition of overlap here is quite conservative in that no smoothing was applied to the FDR-corrected cross-subject correlation maps; therefore there will be greater apparent overlap in the surface-smoothed maps (10 steps) shown inFig. 3).
Across the left hemisphere (Fig. 4a), we found three regions of overlap for age-R1 and age-MT effects; these encompassed pars oper-cularis (green), lateral pre-central gyrus/central sulcus (cyan), and ventral central sulcus (blue). Linear regressionfits for R1showed that
across these ROIs, R1values increased at a rate of 0.003 s1per year.
Similarly, over these ROIs, MT values increased at rates ranging from 0.006 to 0.009 pu per year. Across the right hemisphere (Fig. 4b), we identified four regions where age-R1 and age-MT effects tightly over-lapped. These included: dorsal (yellow), lateral (purple), and ventral (orange) pre-central gyrus, and supramarginal gyrus (red). Similar to the left hemisphere, R1values in the right hemisphere ROIs increased at rates
of 0.003–0.004 s1per year; MT values increased at rates ranging from 0.006 to 0.008 pu per year.
Discussion
[image:9.595.46.554.53.251.2]A fundamental challenge in human neuroscience is the development of efficient and robust anatomical imaging techniques that can enable specific tissue properties within the cortex to be quantifiedin vivo. Such approaches are critical to charting healthy human brain structure across development, together with informing understanding of tissue deterio-ration in aging and disease (Yeatman et al., 2014; Deoni et al., 2015,
Fig. 3.Results of age-MPM correlations. Maps present vertices where positive age-parameter correlations (jackknifed) were significant, after adjusting for effects of local cortical curvature and thickness, and MPM cohort (see Materials and Methods). (a) Significant age-R1correlations emerged across much of the lateral surface, including frontal, parietal and temporal regions. (b) Significant age-MT correlations were less extensive, emerging at pre-central, dorso-lateral pre-frontal, and parietal regions. Heat scale overlays indicate range of jackknifed Pearson r coefficients, thresholded by FDR-corrected significance of age-parameter correlations (all effects hemisphere-wise FDR-corrected,q<0.05). Pearson r maps are displayed with surface smoothing of 10 steps (approximating a 2D Gaussian kernel of 3 mm FWHM).
[image:9.595.40.556.527.693.2]2011; Callaghan et al., 2014a; Laule et al., 2004). Here, we used a pre-viously well-validated quantitative multi-parameter mapping (MPM) protocol (Helms et al., 2008a, 2008b; Weiskopf et al., 2011, 2013; Lutti et al., 2010; Callaghan et al., 2014b) to characterize tissue profilesin-vivo across a range of cortical regions. Moreover, we explored effects of aging across late adolescence and early adulthood on myelination, using MPM indices that offer tissue-specific proxies for cortical myelin processes. We found that across a series of cortical ROIs, MPMs sensitive to myelin (R1,
MT) showed enhanced values in line with expected differences in mye-lination between primary and primary adjacent regions, as compared to many non-primary cortical regions. Further, we found that depth profiles of MPMs reflective of myelin and myelin-related processes (R1, MT, R2*)
showed a monotonic decline in parameter values across the cortex, when progressing from the white matter surface towards the pial surface. In contrast, the MPM reflective of tissue water (PD*) increased as a function of distance from the white matter surface. Cross-sectional effects of age on myelination were most robust for R1, with linearfit against age from
vertex-wise analyses showing R1 increases of ~0.5% per year across
much of pre-frontal, frontal and parietal cortex. Linearfits of MT against age from vertex-wise analyses estimated an increase of ~1.0% per year, but with correlations that were somewhat less extensive spatially than those found for R1.
Inter-regional MPM normative data and intra-regional depth profiles
A central aim of our study was to use MPMs to explore myelin and myelin-related variation in cortex using MPMs in order to provide normative mapping data from a healthy sample. In line with previous histological (Annese et al., 2004) and combined histological/MR in-vestigations (Walters et al., 2003; Stüber et al., 2014; Fracasso et al., 2016), we found that MPMs allowed us to distinguish between cortical regions (e.g., primary vs. association cortex), and also to chart intra-regional tissue properties, based on profiles of tissue-sensitive pa-rameters through the cortical sheet.
Previous investigations have explored inter-regional and cortical depth profiles for R1 (¼1/T1) alone, which has typically shown high
sensitivity to heavily-myelinated cortical tissue. In particular,Sigalovsky et al. (2006)charted cortical R1values across anatomical subdivisions of
Heschl's gyrus, whileDick et al. (2012)characterized the cortical depth profile of R1values within sub-parcellations of Heschl's gyrus (Te 1.0, 1.1
&1.2); both studies found the expected pattern of elevated R1values at
the postero-medial aspect of Heschl's gyrus, reflecting putative auditory core. In visual cortical regions,Sereno et al. (2013)charted the increased R1values found within primary (e.g., V1) and non-primary (e.g., MT,
V3a, V6) higher-visual areas, with respect to retinotopic functional bor-ders (see alsoAbdollahi et al., 2014). Moreover, Sereno et al. showed overall higher R1in these visual regions compared to association cortex
(angular gyrus), across intra-regional depths.
Here, we re-capitulate many of thefindings above, and extend these results to further tissue-sensitive MPMs. Both R1and MT metrics in our
present results manifested higher values within primary, primary adja-cent, and higher visual cortical regions (e.g., Heschl's gyrus, probabilistic V1, probabilistic MT/V5, subcentral gyrus) compared to association areas (e.g., middle cingulate sulcus and gyrus, subparietal sulcus). In particular, that our inter- and intra-regional magnetization transfer (MT) results closely mirror our R1data lends strong support to the feasibility of
mapping MT as a myelin proxy in the cortex. A potential benefit here is that MT is less affected by other properties of the tissue microstructure than R1- i.e., R1is partially influenced by R2* signal properties, which
vary as a function of susceptibility effects due to paramagnetic molecule concentrations, myelin distribution and fibre orientation –points we return to below (Callaghan et al., 2014b; Fukunaga et al., 2010; Stüber et al., 2014). MT therefore largely reflects the macromolecular content of the tissue microstructural environment, and can provide a proxy for the bound water fraction (Callaghan et al., 2014b). Moreover, previous post-mortem comparisons of MT ratio and T1-based MR metrics have
shown high correlation between the two (r¼ 0.79;Schmierer et al., 2004), suggesting that both converge well toward indexing myelin tissue. However, a difference in R1and MT in the current study was the reduced
sensitivity of MT to myelin content within sulcal regions where cortex is thinnest, particularly across the calcarinefissure. As discussed in Results and above, the partial R2* influence on R1 may have increased the
contrast-to-noise for myelin and related processes within this sulcal re-gion, where cortical thickness can fall to ~1.5 mm, reducing the number of voxels that contribute to measured signal. The multiple signal con-tributions to R1therefore may enhance its sensitivity where
measure-ments of tissue microstructure are required at a particularlyfine-grained level, as in very thin and concave cortical regions.
A further consideration in the present results was the convergence between regions that showed high myelin content (i.e., elevated R1and
MT values) and also high R2* values. The correspondence between R1,
MT and R2* has been charted previously. In particular, tissue molecules
such as iron influence R2* (Langkammer et al., 2010; Fukunaga et al.,
2010) by causing local inhomogeneities in the B0field, in turn infl
u-encing the longitudinal relaxation rate (Callaghan et al., 2014b). More-over, tissue regions high in iron often overlap areas of high myelin content, since oligodendrocyte cell bodies (whose cytoplasmic mem-branes extend around axons to form the myelin sheath) are known to express high concentrations of iron (Stüber et al., 2014; Bartzokis, 2004; Todorich et al., 2009). T2* (i.e., 1/R2*) has been shown to reflect patterns
of myelin distribution, correlating highly with other myelin proxies in cortex (i.e., magnetization transfer ratio;Mangeat et al., 2015). T2* is
also modulated as a function offibre orientation, in line with measured fractional anisotropy (Cohen-Adad et al., 2012; see alsoDenk et al., 2011). Similarly, regions that show reduced MT in aging (reflecting
presumptive demyelination) also tend to manifest reductions in R2*
(Callaghan et al., 2014a), and demyelination in multiple sclerosis has been associated with focal increases in T2* as disease severity increases
(Maneiro et al., 2015). In line with the inter- and intra-regional variation we observed in R1 and MT, R2* tended to follow similar profiles of
elevation or reduction within regions of respectively high or low R1and
MT, mirroring its close relationship with R1and MT. Nevertheless, an
important difference emerged in the location of high R2* foci, such that
these were displaced into sulci adjacent to some of the regions of high R1 and MT (e.g., at Heschl's sulcus and gyrus, and at infero-temporal sulcus, adjacent to area MT;Supplemental Fig. 2). Further to the account of R1
and MT differences (see 3.1, Group average MPM results), the displace-ment of R2* foci may reflect detection of iron-rich oligodendrocyte cell
bodies within sulcal depths (e.g.,Stüber et al., 2014). The exact mech-anisms underlying this difference are unclear; however, a possible ac-count is an interaction between the thinness of cortex over sulcal depths (as compared to thicker and more convex gyri), and the relative expression of macromolecular (i.e., myelin lipid) versus glial content as a result. The limited layer IV/V thickness within deep sulci constrains the expression of high macromolecular content, and in tandem, it is possible that oligodendrocytes may be more heavily expressed in sulcal regions proximal to heavily-myelinated gyri (seeStüber et al., 2014). In combi-nation, these differences may lead to apparently elevated R2* in sulci
adjacent to foci of high R1and MT.
Finally, we observed that intra-regional PD* parameters followed an expected pattern opposite that of R1, MT, and R2*, with highest values at
cortical depths close to the pial surface. Agreeing with previous evidence of reduced myelin in superficial cortical layers (Annese et al., 2004; Walters et al., 2003; Leuze et al., 2014), the high PD* values likely reflect
increased tissue water and lower myelination levels nearer the pial sur-face. The observed changes are in line with those that use [1 minus the ratio of PD and cerebrospinal fluid] as a marker for macromolecular tissue volume (Mezer et al., 2013).
would be expected to be constant over all MPMs, since the same surfaces are used per subject when mapping each parameter. Indeed, we found that cubic trends best explained the pattern of change in R1and MT over
depth fractions, but a quadratic trend best explained the change in R2*
over the same depths. Moreover, the apparent trends in the data are evident visually inFig. 2, when restricting the range of depth fractions to 0.2–0.8–a range we should expect to correspond with voxels inside the cortical sheet. If partial voluming effects drove the observed change over depth fractions, then cubic trends should be expected for each of the parameters, but this was not the case.
Development and cortical myelination
Here, we found evidence of a protracted course of myelin and myelin-related process development within the cortex, across late adolescence and early adulthood. Our MPMs varied in the extent to which they revealed developmental effects (i.e., to hemisphere-wise FDR correction, q<0.05): R1showed widespread increases with age across pre-frontal,
frontal and parietal cortex; MT revealed a slightly lesser extent of age effects that were statistically significant with multiple comparison correction, largely concentrated in pre-central regions bilaterally. Age effects on R2* were not robust in vertex-wise analyses, but did emerge in
multi-level models that included data from each depth fraction per ROI. Previous MR studies have shown that myelination in humans begins in the subcortex (Partridge et al., 2004; Deoni et al., 2011; Barkovich et al., 1988; Nakagawa et al., 1998; for review, seePaus et al., 2001; Baumann and Pham-Dinh, 2001). Further, MR studies have found mye-lination of primary and association cortex progresses during childhood (Deoni et al., 2015; Dean et al., 2016) and adolescence (Grydeland et al., 2013), before age-related de-myelination begins during middle adult-hood (Vidal-Pi~neiro et al., 2016; Grydeland et al., 2013; Salat et al., 2009; see alsoRowley et al., 2017). DTI investigations have also found that white matter structure within association cortex develops over extended periods, typically to beyond late adolescence (Klinberg et al., 1999; Barnea-Goraly, 2005). Quantitative assays of subcorticalfibre myelina-tion with R1have similarly shown an inverted-U profile, indicative of
protracted myelin development during childhood, adolescence and early adulthood, followed by de-myelination from middle to older age ( Yeat-man et al., 2014).
Of particular relevance to our present results, recent studies using T1w/T2w image contrast ratios have identified extended periods of
change within association cortex.Shafee et al. (2015)and Grydeland et al. (2013)found significant increases in T1w/T2wratio with age over
much of the frontal and parietal lobes, in young adults (18–35 years) and across the lifespan (8–83 years), respectively. Notably, the linear trend identified in the present study (and byShafee et al., 2015) was also found byGrydeland et al. (2013)when considering the younger (8–20 year old) tail of their age distribution (cf. quadratic trends in T1w/T2wratio across
their full age range). This appears to reflect phases of increasing myeli-nation up to early adulthood, followed by periods of relative stability and eventual decline of cortical myelin after 50–60 years of age (Grydeland et al., 2013; see alsoMiller et al., 2012).
As outlined above, an important advance made by our agefindings is our use of MPMs that index a range of myelin-related tissue processes. MPMs enabled us to measure tissue-based parameters reflecting water mobility, macromolecule concentration, and paramagnetic ions (R1),
together with either predominantly macromolecular (MT), or para-magnetic ion (i.e., iron) (R2*) concentration (Callaghan et al., 2014b).
Existing studies that have used T1w/T2wratio methods cannot resolve for
tissue-sensitive parameters, since both T1wand T2wcontrast are
deter-mined by a variety of microstructural (seeGlasser et al., 2014; Vidal--Pi~neiro et al., 2016), and vasodilatory properties (i.e., O2/CO2
concentration;Tardif et al., 2017). Ourfinding of regions that manifested overlapping age effects for R1and MT suggests that myelination follows a
protracted developmental course. Interestingly, we did not observe robust vertex-wise age effects on R2*, a parameter sensitive to tissue iron
concentration, myelination and fibre orientation. Whereas previous studies have shown focal R2* decreases along fibre bundles (cf.
sub-cortex) in line with aging in older samples (Callaghan et al., 2014a), here, our younger cohort showed most robust increases in parameters largely reflective of cortical myelin content (although we note multi-level analyses of ROI data did reveal age effects for iron andfibre-orientation sensitive R2*). One speculative account is that the developmental effects
we observed involved changes to myelin sheath thickness (i.e., g-ratio;
Dean et al., 2016) rather than large-scale changes in the numbers or density of iron-rich oligodendrocyte cell bodies. However, optogenetic evidence in mice has supported effects of behaviorally-relevant neural activity in promoting increases in both myelin sheath thickness (i.e., g-ratio decreases) and oligodendrogenesis (Gibson et al., 2014). Taken together, it is likely that our current effects of age reflect some combi-nation of these processes, although the precise mechanisms remain un-clear. Future studies in which in-vivo measurements of g-ratio (e.g.,
Mohammadi et al., 2015) are probed across our age range in addition to each multi-parameter map may enable us to shed further light on the mechanisms at play in myelin sheath development.
A strength of the present approach is the use of a well-validated MPM protocol incorporating B0and B1RF transmitfield mapping. Here,field
maps form an integral part of the MPM protocol, such that localflip angles can be resolved and used in the estimation of MPMs, based on a variableflip angle procedure (seeLutti et al., 2010, 2012; Helms et al., 2008b; Weiskopf et al., 2011). T1w/T2wratio methods are subject to B1
RF transmitfield inhomogeneities during acquisition, which can bias localflip angles and the resulting signal intensity and contrast, increasing measurement error (Lutti et al., 2010, 2014; Helms et al., 2008b; Weis-kopf et al., 2011; but see alsoGlasser et al., 2014). The precision and reproducibility of the MPM and field mapping protocols have been documented previously (Weiskopf et al., 2013; Lutti et al., 2010, 2012). Importantly, although we observed differences in MPM parameter values between the protocols that differed across cohorts in our present study, those differences reflected a constant offset, the source of which was isolated and which we controlled for in statistical models. A potential limitation of our present R2* measurements arises from the fact that we
did not correct subject-wise R2* maps for localfibre orientation relative
to the B0field. Previous investigations have shown that the difference in
angle between vertex-wise surface normal projections and the B0field
can account for some of the measured T2*/R2* in heavily myelinated
regions (Cohen-Adad et al., 2012; seeDenk et al., 2011). Nevertheless, the extent of variation captured by B0dependence as previously reported
would correspond with<5% of R2* based on the midpoint presented in
ourFig. 1. Thus, we suggest that in large part, our present reported values are representative of much of cortex, with the caveat that R2* values from
some heavily myelinated regions (e.g., BA4) may be subtly lower than the values reported here if corrected forfibre orientation. The use of sufficiently high-resolution diffusion data (not acquired as part of this study) may help to validate any B0 dependence with respect to
intra-corticalfibre orientation.
Nevertheless, in light of the methodological advances in MPM methods, our present findings agree well with accounts of cortical development and myelination based on T1w/T2wratio methods.
More-over, that we were able to identify robust linear developmental effects on cortical myelination/myelin processes and with a much smaller cohort than many studies (Shafee et al., 2015; Grydeland et al., 2013) suggests that reliable quantitative mapping protocols can play a highly informa-tive role in charting cortical development.
Conclusions
mapping of tissue water sensitive parameters (PD*). Moreover, exploring effects of development cross-sectionally, we found that cortical myelin and myelin processes increased at a rate of 0.5 %–1.0% (R1and MT) per
year over frontal and parietal regions, across late adolescence and early adulthood. These results shed further light on ontogenetic factors that may shape large-scale cortical organization and inform broader accounts of lifespan cortical development, as well as helping to characterize the healthy aging of the human brain, which may provide a useful clinical benchmark for studying de-myelination in aging and disease.
Funding
The research leading to these results received funding from the Eu-ropean Research Council under the EuEu-ropean Union's Seventh Frame-work Programme (FP7/2007–2013)/ERC grant agreement n 616905, and via EC FP7 grant n MC-ITN-264301 (TRACKDEV) to DC. The Wellcome Trust Centre for Neuroimaging is supported by core funding from the Wellcome Trust 0915/Z/10/Z. The work was also supported by a Wellcome Trust grant 100227 (M.A., G.R.).
Conflicts of interest
The authors declare no competingfinancial interests.
Acknowledgements
We thank Martin Sereno for many custom changes to csurf that facilitated this work.
Appendix A. Supplementary data
Supplementary data related to this article can be found athttps://doi. org/10.1016/j.neuroimage.2017.11.066.
References
Abdollahi, R.O., et al., 2014. Correspondences between retinotopic areas and myelin maps in human visual cortex. NeuroImage 99, 509–524.
Allen, M., Frank, D., Glen, J.C., Fardo, F., Callaghan, M.F., Rees, G., 2017a. Insula and somatosensory cortical myelination and iron markers underlie individual differences in empathy. Sci. Rep. 7, 43316.
Allen, M., et al., 2017b. Metacognitive ability correlates with hippocampal and prefrontal microstructure. NeuroImage 149, 415–423.
Annese, J., Pitiot, A., Dinov, I.D., Toga, A.W., 2004. A myelo-architectonic method for the structural classification of cortical areas. NeuroImage 21 (1), 15–26.
Ashburner, J., Friston, K.J., 2000. Voxel-based morphometry—the methods. NeuroImage 11 (6), 805–821.
Barazany, D., Assaf, Y., 2012. Visualization of cortical lamination patterns with magnetic resonance imaging. Cereb. Cortex 22, 2016–2023.
Barkhof, F., Calabresi, P.A., Miller, D.H., Reingold, S.C., 2009. Imaging outcomes for neuroprotection and repair in multiple sclerosis trials. Nat. Rev. Neurol. 5 (5), 256–266.
Barkovich, A.J., Kjos, B.O., Jackson, D.E., Norman, D., 1988. Normal maturation of the neonatal and infant brain: MR imaging at 1.5T. Radiology 166, 173–180. Barnea-Goraly, N., et al., 2005. White matter development during childhood and
adolescence: a cross-sectional diffusion tensor imaging study. Cereb. Cortex 15 (12), 1848–1854.
Bartzokis, G., 2004. Age-related myelin breakdown: a developmental model of cognitive decline and Alzheimer's disease. Neurobiol. Aging 25 (1), 5–18.
Bartzokis, G., 2011. Alzheimer's disease as homeostatic responses to age-related myelin breakdown. Neurobiol. Aging 32 (8), 1341–1371.
Baudrexel, S., et al., 2016. Quantitative T1 and proton density mapping with direct calculation of radiofrequency coil transmit and receive profiles from two-point variableflip angle data. NMR Biomed. 29 (3), 349–360.
Baumann, N., Pham-Dinh, D., 2001. Biology of oligodendrocyte and myelin in the mammalian central nervous system. Physiol. Rev. 81 (2), 871–927. Bazin, P.L., Weiss, M., Dinse, J., Sch€afer, A., Trampel, R., Turner, R., 2014.
A computational framework for ultra-high resolution cortical segmentation at 7Tesla. NeuroImage 93, 201–209.
Bender, B., Klose, U., 2010. The in vivo influence of white matterfiber orientation towards B0 on T2* in the human brain. NMR Biomed. 23 (9), 1071–1076. Benjamini, Y., Hochberg, Y., 1995. Controlling the false discovery rate: a practical and
powerful approach to multiple testing. J. R. Stat. Soc. B (Meth) 289–300. Bock, N.A., et al., 2013. Optimizing T1-weighted imaging of cortical myelin content at 3.0
T. NeuroImage 65, 1–12.
Callaghan, M.F., et al., 2014a. Widespread age-related differences in the human brain microstructure revealed by quantitative magnetic resonance imaging. Neurobiol. Aging 35 (8), 1862–1872.
Callaghan, M.F., Helms, G., Lutti, A., Mohammadi, S., Weiskopf, N., 2014b. A general linear relaxometry model of R1 using imaging data. Magn. Res. Med. 73 (3), 1309–1314.
Carey, D., Krishnan, S., Callaghan, M.F., Sereno, M.I., Dick, F., 2017. Functional and quantitative MRI mapping of somatomotor representations of human supralaryngeal vocal tract. Cerebr. Cortex.https://doi.org/10.1093/cercor/bhw393.
Cohen-Adad, J., et al., 2012. T2* mapping and B0orientation-dependence at 7T reveal cyto-and myeloarchitecture organization of the human cortex. NeuroImage 60 (2), 1006–1014.
Cohen-Adad, J., 2014. What can we learn from T2* maps of the cortex? NeuroImage 93, 189–200.
Dale, A.M., Fischl, B., Sereno, M.I., 1999. Cortical surface-based analysis: I. Segmentation and surface reconstruction. NeuroImage 9 (2), 179–194.
Dean, D.C., O'Muircheartaigh, J., Dirks, H., Travers, B.G., Adluru, N., Alexander, A.L., Deoni, S.C., 2016. Mapping an index of the myelin g-ratio in infants using magnetic resonance imaging. NeuroImage 132, 225–237.
Denk, C., Torres, E.H., MacKay, A., Rauscher, A., 2011. The influence of white matter fibre orientation on MR signal phase and decay. NMR Biomed. 24 (3), 246–252. Deoni, S.C., Dean, D.C., Remer, J., Dirks, H., O'Muircheartaigh, J., 2015. Cortical
maturation and myelination in healthy toddlers and young children. NeuroImage 115, 147–161.
Deoni, S.C., et al., 2011. Mapping infant brain myelination with magnetic resonance imaging. J. Neurosci. 31 (2), 784–791.
Dick, F., Taylor-Tierney, A., Lutti, A., Josephs, O., Sereno, M.I., Weiskopf, N., 2012. In vivo functional and myeloarchitectonic mapping of human primary auditory areas. J. Neurosci. 32 (46), 16095–16105.
Dinse, J., Waehnert, M., Tardif, C.L., Sch€afer, A., Geyer, S., Turner, R., Bazin, P.L., 2013. A Histology-based Model of Quantitative T1 Contrast for In-vivo Cortical Parcellation of High-resolution 7 Tesla Brain MR Images. International Conference on Medical Image Computing and Computer-assisted Intervention. Springer, Berlin Heidelberg, pp. 51–58.
Dinse, J., et al., 2015. A cytoarchitecture-driven myelin model reveals area-specific signatures in human primary and secondary areas using ultra-high resolution in-vivo brain MRI. NeuroImage 114, 71–87.
Fischl, B., Sereno, M.I., Dale, A.M., 1999a. Cortical surface-based analysis. II. Inflation, flattening and a surface-based coordinate system. NeuroImage 9, 195–207. Fischl, B., Sereno, M.I., Tootell, R.B.H., Dale, A.M., 1999b. High-resolution intersubject
averaging and a coordinate system for the cortical surface. Hum. Brain Mapp. 8, 272–284.
Freund, P., et al., 2013. MRI investigation of the sensorimotor cortex and the corticospinal tract after acute spinal cord injury: a prospective longitudinal study. Lancet Neurol. 12 (9), 873–881.
Flechsig, P., 1920. Antomie des menschlichen Gehirns und Rücken- marks auf myelogenetischer Grundlage. Georg Thieme, Leipzig.
Fracasso, A., et al., 2016. Lines of Baillarger in vivo and ex vivo: myelin contrast across lamina at 7T MRI and histology. NeuroImage 133, 163–175.
Frisoni, G.B., Fox, N.C., Jack, C.R., Scheltens, P., Thompson, P.M., 2010. The clinical use of structural MRI in Alzheimer disease. Nat. Rev. Neurol. 6 (2), 67–77.
Fukunaga, M., et al., 2010. Layer-specific variation of iron content in cerebral cortex as a source of MRI contrast. Proc. Natl. Acad. Sci. U. S. A. 107 (8), 3834–3839. Geyer, S., 2013. High-field magnetic resonance mapping of the border between primary
motor (area 4) and somatosensory (area 3a) cortex in ex-vivo and in-vivo human brains. In: Geyer, S., Turner, R. (Eds.), Microstructural Parcellation of the Human Cerebral Cortex. Springer, Heidelberg, Germany, pp. 239–254.
Gibson, E.M., et al., 2014. Neuronal activity promotes oligodendrogenesis and adaptive myelination in the mammalian brain. Science 344 (6183), 1252304–1252304. Glasser, M.F., Van Essen, D.C., 2011. Mapping human cortical areas in vivo based on
myelin content as revealed by T1- and T2-weighted MRI. J. Neurosci. 31 (32), 11597–11616.
Glasser, M.F., Goyal, M.S., Preuss, T.M., Raichle, M.E., Van Essen, D.C., 2014. Trends and properties of human cerebral cortex: correlations with cortical myelin content. NeuroImage 93, 165–175.
Glasser, M.F., et al., 2016. A multi-modal parcellation of human cerebral cortex. Nature 536, 171–178.
Gogtay, N., et al., 2004. Dynamic mapping of human cortical development during childhood through early adulthood. Proc. Natl. Acad. Sci. U. S. A. 101 (21), 8174–8179.
Govindarajan, S.T., Cohen-Adad, J., Sormani, M.P., Fan, A.P., Louapre, C., Mainero, C., 2015. Reproducibility of T2* mapping in the human cerebral cortex in vivo at 7 Tesla MRI. J. Magn. Res. Imag. 42 (2), 290–296.
Gomez, J., et al., 2017. Microstructural proliferation in human cortex is coupled with the development of face processing. Science 355 (6320), 68–71.
Greenstein, D., et al., 2006. Childhood onset schizophrenia: cortical brain abnormalities as young adults. J. Child. Psychol. Psychi 47 (10), 1003–1012.
Grydeland, H., Walhovd, K.B., Tamnes, C.K., Westlye, L.T., Fjell, A.M., 2013. Intracortical myelin links with performance variability across the human lifespan: results from T1 -and T2-weighted MRI myelin mapping and diffusion tensor imaging. J. Neurosci. 33 (47), 18618–18630.
Hagler, D.J., Sereno, M.I., 2006. Spatial maps in frontal and prefrontal cortex. NeuroImage 29 (2), 567–577.