Wireless Node Localization for V-shaped and
Rectangular-shaped Node Deployment Schemes
Udaykumar Naik
Dept. of Electronics and Communication Engineering
K.L.E.Society’s College of Engineering and Technology, Belgaum, INDIA
Vishram N.Bapat
Ganga Institute of Technology and Management Jhajjar, Haryana, INDIA
ABSTRACT
The positioning of wireless nodes in indoor Wireless Local Area Network (WLAN) using Received Signal Strength Indication (RSSI) has become an attractive low cost localization solution. The location accuracy of RSSI based algorithms is dependent on node placement topology. The localization performance analysis reported for nodes arranged in V-shaped linear configuration. The uniqueness of this work ensures comparative study of localization performance in V-boundary array and its counterpart regular rectangular boundary node layout. The localization performance is computed in terms of Cramer - Rao Lower Bound (CRLB) of range estimate under dynamic indoor environments. The test bed experiment and simulation results demonstrate that the localization improves for lower included angle of the V-shaped array geometry and for higher aspect ratio of rectangular geometry. Interesting result of our analysis is that for V-shaped linear array with included angle of 22.5o has better localization performance compared to its corresponding rectangular shaped node configuration.
General Terms
Applications of Computer Science in Modeling, Wireless Networks
Keywords
Localization, CRLB, RSSI, V-boundary array
1.
INTRODUCTION
Location estimation for mobile terminals in indoor Wireless Local Area Network (WLAN) has drawn lot of attention in recent years. Low cost, robust indoor localization is useful for context aware applications and WLAN security applications [1]. In addition location estimation is useful in commercial, military, public safety and wireless sensor network applications [2-4]. A variety of location estimation techniques have been proposed for wireless networks, including Time-Of-Arrival (TOA), Angle-Time-Of-Arrival (AOA), Received Signal Strength Indication (RSSI), neural networks, and Bayesian filters [5-10]. TOA-based systems require high-precision timing with synchronization components and signal-processing technique to combat multi path effects, which further increases the system complexity. AOA-based systems require antenna array, which also significantly increases the hardware requirement. Neural networks and Bayesian filtering methods require very high computational capacity. In contrast, RSSI-based techniques have the lowest complexity and cost among the alternatives [2].
The propagation of signal in an indoor environment is extremely complex and the intensity of a radio signal at a given location varies with time for number of reasons [11]. The relationship between the RSSI values and the mobile
wireless node position depends on a large number of unpredictable factors. Small changes in position or direction of wireless node may result in remarkable differences in RSSI values. Other factors that affect RSSI values are multi path or fast fading and the shadowing or slow fading [12]. Hence the placement of wireless node and node topology significantly affects RSSI based localization. The methodical study on this feature is currently lacking. Furthermore, some of the recent efforts only consider the localization performance for few specific target points.
Chen, Y. et al. [13] developed an algorithm and demonstrated that the square layout of four land mark placement minimizes the maximum localization error. Junyi, Z. et al. [14] presented multiple performance metrics for most common rectangular shaped industrial facilities. These researches however do not tackle the localization error when there are large numbers of wireless nodes which may run from few to many. The V-shaped boundary node configuration is useful when there is a constraint on area availability for node placement in an indoor environment. To bridge the research gap, this paper investigates localization performance for regular rectangular boundary and V-shaped boundary linear array node configurations. A linear array may be defined as collection of number of nodes along the line. The Cramer - Rao Lower Bound (CRLB) has been extensively used in evaluating the performance limit of wireless localization [15]. The CRLB based ranging errors using RSSI in V-shaped linear array and rectangular boundary node configurations is presented in this paper. The CRLBs are computed using real time radio signal strength measurements performed by user’s mobile terminal. The distance error lower bound provides the reference for the accuracy of node localization.
The paper is organized as follows: Section 2 illustrates theory behind CRLB computations. The geometrical considerations of the node layouts are presented in Section 3. Section 4 describes measurement system and procedure of obtaining real time RSSI data. Section 5 presents results obtained by simulations and real time measurements. Finally, conclusions are summarized in Section 6.
2.
CRLB COMPUTATIONS
Multipath and Shadowing factors that affect RSSI values can be modeled with Rayleigh or Rician and log normal distributions. RSSI values (PR), therefore can be modeled by means of the following expression [16]:
n t r t R
d g P G G
P
. . . 4
. 2
(1)
where Pt, is the transmitted power, Gt and Gr are transmitter
the path loss exponent, g and γ are the parameters that conform the Rayleigh/Rician and log normal distributions, respectively.
Taking, the logarithmic units in (1) and following the derivation steps as shown in [16] for range dependent models, RSSI values are given by the following expression:
X d n
PR10. .log10( )
(2)
where α is the power measured at a reference distance, d is the distance between mobile node and the access point, n is the path loss exponent, X denotes a Gaussian random variable with zero mean caused by shadowing.
The power measured at a reference distance depends on several factors: fast and slow fading, antenna gain, and transmitted power [17].
CRLB gives minimum possible variance for estimation. Placing a lower bound on the estimator proves to be extremely useful in practice. CRLB provides a benchmark against which one can compare the performance of any estimator [18]. The performance limits for the localization accuracy in terms of CRLB is obtained through knowing the position of the mobile terminal and the standard deviation of each RSSI measurement error [19].
CRLB for range estimation is given by following expression [20]:
) ( log . . 10 ) ˆ (
10e
n d d
Var i
(3)
where dˆ is the maximum likelihood estimator of distance between the access point and the ith position is the standard deviation of PRi measurements at the ith location. Given the
measurements PRi at the i th
location, the maximum likelihood distance from access point is estimated as:
n
PRi
dˆ10( )10. (4)
3.
NODE LAYOUTS
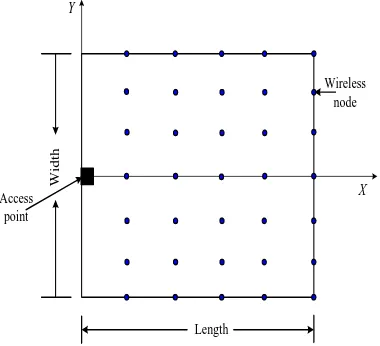
We present geometrical considerations of the V-boundary and rectangular boundary node configurations. In an indoor WLAN environment, when there are large numbers of wireless nodes in general, the nodes are placed with rectangular boundary. This is illustrated in Figure 1. Here the wireless nodes are equispaced.
X Y
Access point
Length
W
id
th
Wireless node
[image:2.595.328.527.218.407.2]Fig 1: Rectangular boundary node configuration
We assume that the rectangular boundary has a unit area and its aspect ratio (length-to-width ratio) is r. As the breadth along the Y-axis decreases, keeping the length constant, the aspect ratio r becomes greater than one.
Placement of nodes within a particular building requires stretching/shrinking the deployment shape so that it fits within the confines of the building [13]. V-boundary linear array node configuration is one such popular design. This configuration is analogous to log periodic dipole array [21] used as an antenna.
l1
l2
l3
l4 Access
point Near end
linear array Central region linear array
Far end linear array
Wireless node
s θ
[image:2.595.316.546.461.615.2]Fig 2: V-shaped linear array node configuration
θ
2 1 n n l l
2 1
n l
2
n l
S θ
Fig 3: Section of V-shaped linear array geometry for determining the relation of parameters
The V-shape is a uniquely defined region in terms of included angle, θ. Referring to Figure 2, nodes on the linear array increases along the V-pattern so that the included angle, θ is a constant. From the geometry of Figure 3, for a section of the V-boundary node configuration, we have
S l ln n /2
tan 1
(5)
where θ is the apex angle, ln, ln+1 are the lengths of linear
[image:2.595.69.259.574.747.2]In our location estimation evaluation, we assume V-shapes with θ variation from 10 - 22.5o and the spacing between lengths of linear array is of length 2.5 meters.
O
A
B C
D Aʹ
Bʹ
Cʹ
Dʹ
X Y
θ1
θ2
[image:3.595.65.275.115.273.2]Fig 4: V-shaped geometry with comparable rectangular pattern
As the included angle θ of the V-shaped geometry decreases, the corresponding rectangular pattern aspect ratio, r increases. This is illustrated in Figure 4.
4.
EXPERIMENTAL SETUP
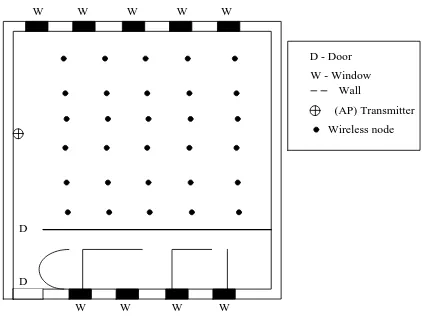
To evaluate the positioning performance of the proposed method, RSSI data in the Computer Science department at the K. L. E. S. College of Engineering and Technology, India were collected. The layout of the location where the experiments were conducted is shown in Figure 5. The dimension of the test bed is 11.15×9.75 meters.
D
D
W W W W W
W W W W
D - Door W - Window
Wall
[image:3.595.319.541.243.385.2]Wireless node (AP) Transmitter
Fig 5: Floor layout for positioning performance evaluation
A wireless router (Rukus-zoneflex2925) is used as an Access Point (AP). The router supports IEEE 802.11b/g WLAN standards. We adopt laptop as the mobile node, with a wireless client adapter. The signal strength measurements are done using NetStumbler open software [22, 23] which is a tool for Windows that allows one to measure the signal level of WLAN. The Netstumbler was set to take two samples per second. The access point is placed 9 meters above the floor. The RSSI distribution follows a Gaussian distribution at each reference location. Taking into account of this unsteady indoor behavior, final RSSI value for each reference location an average of 50 observations was taken.
RESULTS
In this section, the accuracy of wireless node location estimate in V-shaped array configuration and rectangular configurations are compared. To calculate position accuracy, CRLB, range estimate is determined as described in Section 2.
4.1
Relationship between distance and
RSSI
In order to obtain value for α that is useful in the subsequent location estimation process, we carried out measurements in a specific indoor environment. In Figure 6, we find the relation between distance and these measured RSSI values. The measured RSSI match the log normal shadowing model in (1) with α = -28 dBm using the reference distance = 1 m.
-50 -45 -40 -35 -30 -25
0 0.2 0.4 0.6 0.8 1 1.2
Log distance
R
ec
ei
v
ed
s
ig
n
al
s
tr
en
g
th
(
d
Bm
)
Fig 6: Relation between distance and measured RSSI
4.2
Evaluation of Estimation Error
In this section, we describe the impact of path loss exponent and geometrical parameters on localization performance. The path loss factor or path loss exponent, n characterizes the rate at which the received signal strength varies with distance between mobile terminal and an access point. The path loss exponent is a function of indoor environment.
Localization performance in the proposed configurations is evaluated using location estimation error. This error is defined as the difference between the estimated range and actual range. The included angle, θ of V-shaped geometry and the aspect ratio, r of rectangular geometry affect the localization performance.
[image:3.595.61.272.457.615.2]0.1 0.2 0.3 0.4 0.5 0.6 0.7 0.8 0.9 1
1 2 3 4 5 6 7 8 9 10 11
Error in position estimates (m)
C
D
F
Apex angle = 10 degrees Apex angle = 15 degree Apex angle = 22.5 degree
(a)
0.1 0.2 0.3 0.4 0.5 0.6 0.7 0.8 0.9 1
1 2 3 4 5 6 7 8 9 10 11
Error in position estimates (m)
C
D
F
Apex angle = 10 degrees Apex angle = 15 degree Apex angle = 22.5 degree
[image:4.595.54.280.67.440.2](b)
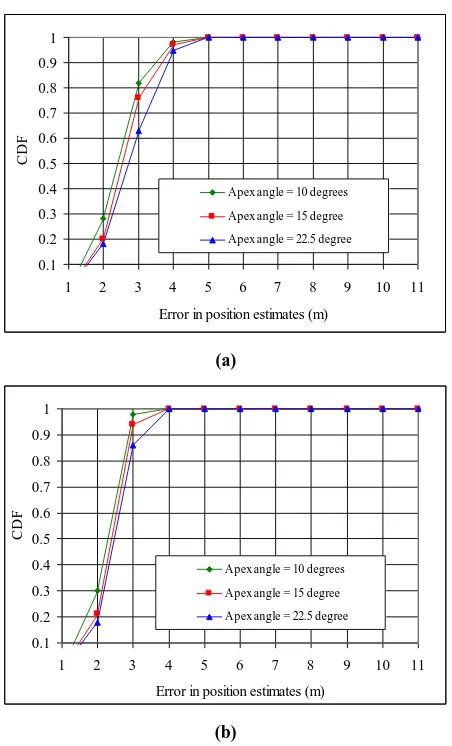
Fig 7: CDFs of ranging errors depending on the path loss exponent, n: (a) n = 3 (b) n = 4
Furthermore, Figure 8 shows the impact of path loss exponent in a typical V-shaped configuration with included angle, θ = 15o. Here we can appreciate better range accuracy for higher
order path loss exponent. To make this observation more reliable, we measured range errors for middle value path loss exponents. Table 1 provides summary of range error results for middle value path loss exponents. We find, mean of the error decreases for higher values of path loss exponent, or the location accuracy performance increases significantly.
0.1 0.2 0.3 0.4 0.5 0.6 0.7 0.8 0.9 1
1 2 3 4 5 6 7 8 9 10 11
Error in position estimates (m)
C
D
F
n = 4 n = 3 n = 2
Fig 8: CDFs of ranging errors for V-shaped array with apex angle, θ =15o
[image:4.595.56.277.577.736.2]Table 1. Ranging error in V-shaped array configuration using middle value path loss exponents
Path loss exponent
(n)
Apex angle θ = 22.5o Apex angle θ = 15o Apex angle θ = 10o
Mean (meters)
Standard Deviation
(meters)
Mean (meters)
Standard Deviation
(meters)
Mean (meters)
Standard Deviation
(meters)
2.5 1.95 1.07 1.77 1.00 1.58 0.99
3.5 1.55 0.54 1.43 0.52 1.33 0.51
[image:5.595.132.540.233.621.2]3.75 1.48 0.48 1.39 0.46 1.29 0.45
Table 2. Ranging error in Rectangular shaped node configuration
Path loss exponent
(n)
Aspect ratio r = 1.10 Aspect ratio r = 1.80 Aspect ratio r = 2.80
Mean (meters)
Standard Deviation
(meters)
Mean (meters)
Standard Deviation
(meters)
Mean (meters)
Standard Deviation
(meters)
2 2.75 1.73 1.97 1.48 1.76 1.38
2.5 2.17 1.03 1.69 0.89 1.56 0.84
3 1.85 0.72 1.52 0.61 1.42 0.58
3.5 1.65 0.54 1.40 0.47 1.32 0.44
4 1.56 0.47 1.31 0.38 1.25 0.35
4.3
Performance Comparison
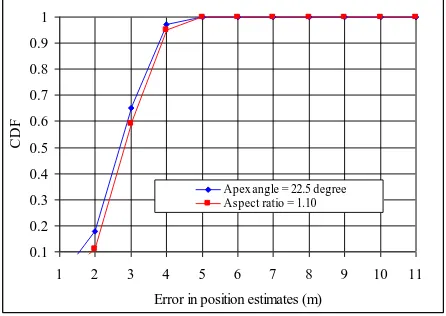
To ensure fair comparison between location estimation in V-shaped pattern and rectangular-V-shaped pattern, we present CDF plots using simulation results. Figure 9(a) and 9(b) shows V-shaped pattern with included angle of 22.5o has better localization performance compared to its rectangular equivalent with aspect ratio 1.10.
Figure 10(a) and 10(b) present the accuracy CDF under apex angle 15o (aspect ratio of 1.80) and apex angle 10o (aspect ratio of 2.80) respectively. We observe that as the aspect ratio increases, rectangular configuration has marginally better localization performance compared to its corresponding V-shaped pattern.
0.1 0.2 0.3 0.4 0.5 0.6 0.7 0.8 0.9 1
1 2 3 4 5 6 7 8 9 10 11
Error in position estimates (m)
C
D
F
Apex angle = 22.5 degree Aspect ratio = 1.10
(a)
0.1 0.2 0.3 0.4 0.5 0.6 0.7 0.8 0.9 1
1 2 3 4 5 6 7 8 9 10 11
Error in position estimates (m)
C
D
F
Apex angle = 22.5 degree Aspect ratio = 1.10
(b)
Fig 9: Performance comparison between V-shaped pattern (θ = 22.5o) and rectangular node pattern (r = 1.10): a)
[image:5.595.55.278.556.714.2]0.1 0.2 0.3 0.4 0.5 0.6 0.7 0.8 0.9 1
1 2 3 4 5 6 7 8 9 10 11
Error in position estimates (m)
C
D
F
Aspect ratio = 1.80 Apex angle = 15 degree
(a)
0.1 0.2 0.3 0.4 0.5 0.6 0.7 0.8 0.9 1
1 2 3 4 5 6 7 8 9 10 11
Error in position estimates (m)
C
D
F
Aspect ratio = 2.80 Apex angle = 10 degree
[image:6.595.319.536.70.280.2](b)
Fig 10: Performance comparison (a) θ = 15o, r = 1.80, n = 3 (b) θ = 10o, r = 2.80, n = 3
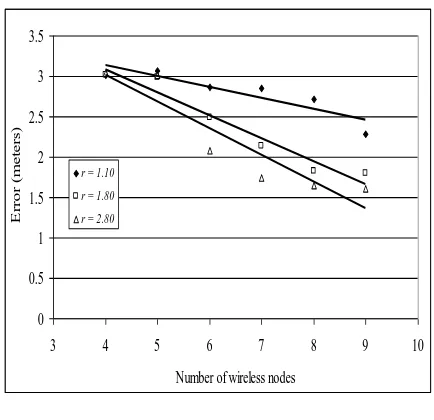
4.4
Impact of number of nodes
We also studied the effects of number of measurement positions in the proposed geometrical configurations. The decreasing error trend with an increase in number of wireless nodes using path loss exponent, n = 3 is observed as shown in Figure 11(a) and 11(b).
0 0.5 1 1.5 2 2.5 3 3.5
3 4 5 6 7 8 9 10
Number of wireless nodes
E
rr
or
(
m
e
te
rs
)
22.5o 15o 10
= 22.5o
= 15o
= 10o
(a)
0 0.5 1 1.5 2 2.5 3 3.5
3 4 5 6 7 8 9 10
Number of wireless nodes
E
rr
or
(
m
e
te
rs
)
r = 1.10
r = 1.80
r = 2.80
(b)
Fig 11: Location estimation error versus number of wireless nodes a) for V-shaped array pattern with n = 3 (b)
for rectangular node pattern with n = 3
5.
CONCLUSIONS
We have presented location estimation in V-shaped array and rectangular shaped node configurations. Localization in these configurations is useful when there are large number of wireless nodes from few to hundreds and when there are practical constraints on area availability for node placement. The proposed configurations can be approximated visually, can be constructed physically and has a low computational complexity. We have used CRLB based localization error to evaluate the localization performance. The CRLB computation relies on realistic measurement of received signal strength indication. The localization technique adopted is simple and does not need any calibration. The performance comparison is made using CDF plots. The simulations show that localization performance significantly depends on the geometrical parameters. The performance increases for lower included angle and for higher aspect ratio. The results also show that, positioning accuracy in both configurations, improves for higher order path loss exponent of the indoor channel.
6.
REFERENCES
[1] Deasy, T.P. and Scanlon, W.G. (2007). Simulation or measurement: the effect radio map creation on indoor WLAN –based localization accuracy. Wireless Personal Communications, 42: 563 –573.
[2] Li, X. (2006). RSS-based location estimation with unknown path loss mode. IEEE Transactions on Wireless Communications, 5(12), 1136 - 1146.
[3] Pahlvan, K., Li, X., and Makela, J. (2002). Indoor geolocation science and technology. IEEE Communications Magazine, 112-118.
[4] Pottie, G.J. and Kaiser, W.J. (2000). Wireless integrated networks sensors. Communications of the ACM, 43(5), 51-58.
[6] Li.X, and Pahlvan, K. (2004). Super-resolution TOA estimation with diversity for indoor geolocation. IEEE Transactions on Wireless Communications, 3(1), 224-234.
[7] Catovic, A., and Sahinoglu, Z. (2004). The Cramer-Rao Bounds of hybrid TOA/RSS location estimation schemes. IEEE Communication Letters, 8(10), 626-628.
[8] Patwari, N., Hero, A.O., Perkins. Correal, N.S., and O’Dea, R.J. (2003). Relative location estimation in wireless sensor networks. IEEE Transactions on Signal Processing, 51(8), 2137-2148.
[9] Fang, S., and Lin, T. (2008).Indoor location system based on discriminator-adaptive neural network in IEEE 802.11environments. IEEE Transactions on Neural networks, 19(11), 1973-1978.
[10]Miloš, N.B. and Aleksandar, M.N. (2009).Positioning in WLAN environment by use of artificial neural networks and space partitioning. Ann. Telecommun. 64: 665–676.
[11]Chen, Y. and Kobayashi, H. (2002). Signal strength based indoor geolocation.In Proceedings of the IEEE international conference on communications, vol. 1, (436-439). 2002.
[12]Krishnan, P., Krishnakumar, A.S., Ju, W., Mallows, C., and Ganu, S. (2004). A system for LEASE: location estimation assisted by stationary emitters for indoor RF wireless networks. In Proceedings of the 23rd annual joint IEEE conference computer communication society, vol. 2, (1001-1011). Hong Kong, March 2004.
[13]Chen, Y., Francisco J., Wade, T., and Martin, R.P. (2006). A practical approach to landmark deployment for indoor localization. In Proceedings of the conference of the 3rd annual IEEE communication society on Sensor and Ad-hoc communications and networks SECON, (365-373). Reston, VA, September 2006.
[14]Junyi, Z., Jing, S., and Qu, X. (2010). Landmark placement for wireless localization in rectangular shaped industrial facilities. IEEE Transactions on Vehicular Technology, 59(6), 3081-3090.
[15]Gustafson, F., and Gunnarson, F. (2005). Mobile positioning using wireless networks. IEEE Signal Processing Magazine, 41-53.
[16]Qi, Y. (2003). Wireless geolocation in a non-line-of environment. Ph.D. dissertation Princeton University, Princeton, NJ, 2003.
[17]Heikki, L., Suvi, J., Timo, L., Risto, K., and Jakko. L. (2007). Experimental evaluation of location methods based on signal strength measurements. IEEE Transactions on Vehicular Technology, 56(1), 287-296.
[18]Kay, S.M. (1993). Fundamentals of statistical signal processing: Estimation theory. Prentice Hall PTR.
[19]Wu,S.,Li, J., and Liu, S.(2011).Improved localization algorithms based on reference selection of linear least squares in LOS and NLOS environments. Wireless Personal Communication online, DOI10.1007/s11277-011-0446-9.
[20]Mazuelas,S.,Alfonso,B.,Ruben,M.L.,Patricia,F.,Francisc o,A.L.,Edurado,G.,etal.(2009). Robust indoor positioning provided by real time RSSI values in unmodified WLAN networks. IEEE Journal of Selected Topics in Signal Processing, 3(5), 821-831.
[21]Kraus, J.D., Marhetka, R.J., and Khan, A.S.(2006). Antennas for all applications, TMH.
[22]Milner,M.(2004).Networkstumbler 0.4.0 notes, www.stumbler.net/readme/readme_0_4_0.html.pdf.