http://dx.doi.org/10.4236/jamp.2015.37098
How to cite this paper: Wang, C.J., Fang, H., Kim, S., Moormann, A. and Wang, H.G. (2015)A New Integrated Fuzzifier Evaluation and Selection (NIFEs) Algorithm for Fuzzy Clustering. Journal of Applied Mathematics and Physics, 3, 802-807. http://dx.doi.org/10.4236/jamp.2015.37098
A New Integrated Fuzzifier Evaluation and
Selection (NIFEs) Algorithm for Fuzzy
Clustering
Chanpaul Jin Wang1,2, Hua Fang1*, Sun Kim3, Ann Moormann4, Honggang Wang2
1Division of Biostatistics and Health Services Research, Department of Quantitative Health Science, UMass Medical School, Worcester, MA, USA
2Department of Electrical & Computer Engineering, University of Massachusetts Dartmouth, Dartmouth, MA,
USA
3Department of Nursing, College of Nursing and Health Sciences, University of Massachusetts, Boston, MA,
USA
4Program of Molecular Medicine, UMass Medical School, Worcester, MA, USA
Email: chanpaul.wang@umassmed.edu, *[email protected], *[email protected]
Received 1 April 2015; accepted 23 June 2015; published 30 June 2015
Abstract
Fuzzy C-means (FCM) is simple and widely used for complex data pattern recognition and image analyses. However, selecting an appropriate fuzzifier (m) is crucial in identifying an optimal number of patterns and achieving higher clustering accuracy, which few studies have investigated. Built upon two existing methods on selecting fuzzifier, we developed an integrated fuzzifier eval-uation and selection algorithm and tested it using real datasets. Our findings indicate that the con-sistent optimal number of clusters can be learnt from testing different fuzzifiers for each dataset and the fuzzifier with the lowest value for this consistency should be selected for clustering. Our evaluation also shows that the fuzzifier impacts the clustering accuracy. For longitudinal data with missing values, m = 2 could be an empirical rule to start fuzzy clustering, and the best clustering accuracy was achieved for tested data, especially using our multiple-imputation based fuzzy clus-tering.
Keywords
Fuzzifier, Fuzzy C-Means, Multiple Imputation-Based Fuzzy Clustering (MIFuzzy), Missing Data, Longitudinal Data
1. Introduction
Fuzzy C-means (FCM) is an efficient clustering method in analyzing complex data patterns. FCM introduces the concept of membership into data partition, and uses the levels of membership to indicate the degree to which an
object belongs to different clusters. In various applications and for complex data, FCM demonstrates its robust-ness and better data partition than crisp clustering such as in MRI image studies [1]-[4]. Recently, one major FCM variant, Multiple Imputation-based Fuzzy clustering (MIFuzzy) has been developed to detect patterns and help causal inference in health and biomedical studies [5] [6].
The fuzzifier, m, also called weighting exponent, ranges from 1 to +∞. When m is close to one, the FCM ap-proaches the hard c-means algorithm; while m apap-proaches infinity, FCM searches the mass center of the data. Proper selection of fuzzifiers can suppress noises and improve the smoothness of FCM membership function. A smaller fuzzifier usually achieves better computational performance. The existing FCM algorithms typically set the fuzzifier to 2, which is an empirical rule but without much evidence. There are also some FCM-centric me-thods [7]-[11] for selecting fuzzifiers based on FCM optimization, e.g., m>nn−2 where n is the sample size [7].
Recently, two data-centric methods [12] [13] were proposed to establish the relationship between the fuzzifier and the characteristics of datasets. Specifically, these studies examined the influence of dominant data features (e.g., dimension and sample size) on selecting fuzzifiers.
To select appropriate fuzzifiers and achieve better clustering accuracy, this paper proposes a new integrated framework for fuzzifier-selection. Our computational results show that the consistent optimal number of clusters can be learnt from testing different fuzzifiers for each dataset; and the fuzzifier with the lowest value for this consistency should be selected for clustering. Furthermore, we evaluated the impact of fuzzifier on cluster accu-racy. Specifically, we tested FCM on 3 real datasets with different fuzzifier values (MIFuzzy was used for data-sets with missing values), and used 2 typical validation indices (i.e., VSC, XB) for fuzzy clustering to evaluate the consistency of the optimum number of clusters with different m.
The remainder of this paper is organized as follows. Section 2 introduces two existing fuzzifier computing methods. Section 3 demonstrates our integrated fuzzifier evaluation and selection algorithm. Section 4 concludes our work.
2. Two Fuzzifier Computing Methods
References [12] [13] used different methods to obtain fuzzifier directly from datasets. Reference [12] theoreti-cally proved and computed the fuzzifier in the process of FCM clustering by searching a global optimal solution. Assuming the fuzzifier m, the number of data point n, and the dimension s, they designed two different rules to compute fuzzifier as follows:
* *
max max
min( , 1)
: , if min(n-1,s) 3
min( , 1) 2
1
: , if ( ) 0.5
1 2 ( ) U
U s n
Rule m
s n
Rule m F
F α β λ λ − ≤ ≥ − − ≤ < −
where * ( *)
U kr n n U
F = f × , and
*
1( k ) ( r ) r k
x x x x
U T
kr n x x x x
f − −
− −
= , where k and r denote the index of different data.
*
max(FU )
λ denotes the maximum eigenvalue of FU*. Rule α is an approximation of Rule β, indicating the
fuzzifier is related to the data dimension. According to Reference [12], if λmax(FU*)<0.5, the fuzzifier can be
directly computed with Rule β, otherwise Rule α and Rule β are invalid.
Similarly, Reference [13] agrees that the fuzzifier m is related to the dataset dimension and size. Differently, they first used the probability theory to analyze the probability of a well-defined cluster. They found that the probability of a well-defined cluster exponentially decreases with respect to the dimension of dataset, and slightly slower with the increasing sample size. They argued that the fuzzifier m should at least qualitatively follow this tendency. They learnt a general functional relation between the fuzzifier and the dataset properties (data dimension and sample size) as shown in Equation (1) by studying the correlation among m, s, and n based on a comprehensive simulation.
2
0.0406 ln( ) 0.1134
1418
( , ) 1 ( 22.05) 12.33
+( +0.243)s n
f s n s
where s also denotes the dimension of dataset, and n describes the sample size.
3. A New Integrated Fuzzifier Evaluation and Selection (NIFEs) Algorithm
This section describes and demonstrates our new integrated fuzzifier evaluation and selection (NIFEs) algo-rithm.
3.1. Conceptual Framework for NIFEs Algorithm
Our conceptual framework for NIFEs algorithm is shown in Figure 1. Specifically, we use typical fuzzy clus-tering validation indices to evaluate the consistency in choosing the optimal number of clusters for a range of fuzzifiers; and then analyze the impact of fuzzifiers on clustering accuracy. We used two major validation in-dexes for fuzzy clustering: widely-used XB [14], and recently-developed VSC [15] for datasets with overlapped clusters. XB is directly related to the fuzzifier while VSC is unrelated to the fuzzifier.
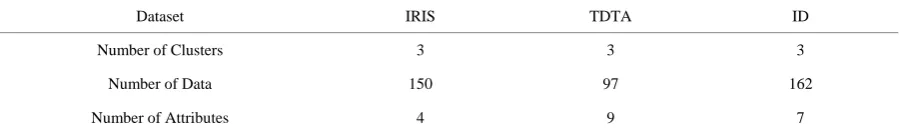
Moreover, we used 3 real datasets to evaluate our algorithm as shown in Table 1: IRIS [16], Infectious Dis-ease (ID) and TDTA [17]. Briefly, IRIS consists 150 samples from three species: Setosa, Virginica and Versi-color. Length and width of the sepals and petals (i.e., four attributes) were measured for each species. ID in-cludes a pediatric cohort of 162 infants with 7 anti-measles antibody measures each from 2 to 8 months before vaccination. TDTA data were collected from a culturally-adapted smoking cessation intervention for Asian Americans with 9 intervention attributes. In particular, we used the classical FCM for IRIS; as ID and TDTA are longitudinal data with missing values, we used MIFuzzy [5] as mentioned in Section 1.
3.2. Demonstrating New Integrated Fuzzifier Evaluation and Selection (NIFEs) Algorithm
The main idea of our new integrated fuzzifier selection (NIFEs) algorithm is to select a proper fuzzifier to en-sure the optimal cluster identification and accuracy. Specifically, given the initial fuzzifier range as M:
[mlow,mupper], and the validation index set V =
{
v v1, ,...,2 vk}
, we implement fuzzy clustering algorithms (e.g.,FCM, MIFuzzy) with given M, and obtain the validation index set V to evaluate the clustering results. For each validation index vi∈V , we use M v( )i to denote the set of available fuzzifiers that can identify the optimum
number of clusters. By default, we set M v( )i ={2}. Then, we select m=min(M v( )1 ∩M v( )...2 ∩M v( ))k as
the final fuzzifier. The NIFEs pseudo codes are displayed in Figure 2. Here, we set v1= XB and v2 = VSC as
examples to demonstrate our NIFEs algorithm. Define the XB peak as xbj that satisfies xbj>xbj−1 and 1
j j
xb >xb+ , where j denotes the cluster number. Then, the optimal number of clusters is arg min(xb xb1, 2,...,xbj).
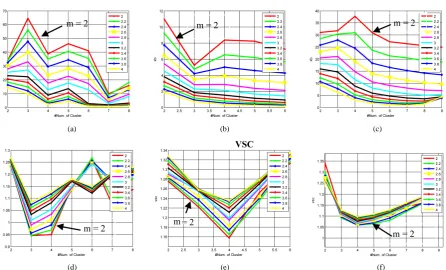
FCM was performed on IRIS while MIFuzzy on ID and TDTA with a range of m (mlow = 2; mmax = 4). The
[image:3.595.171.461.504.606.2]variation of validation indices (v1 = XB and v2 = VSC) was obtained as shown in Figure 3. Then we examined if
Figure 1. Fuzzifier evaluation for fuzzy clustering.
Table 1. Dataset description.
Dataset IRIS TDTA ID
Number of Clusters 3 3 3
Number of Data 150 97 162
Number of Attributes 4 9 7
Validity index
Clustering accuracy
Data Sets
{
Method{
{
Longitudinal (e.g., infectious disease (ID) data and TDTA) Cross-sectional (e.g.,iris and waveform)
{
Fuzzifier related (e.g., xb [11]) Non-Fuzzifier related (e.g., vsc [12]) [image:3.595.89.539.653.720.2]Figure 2. Pseudo code of NIFEs.
(a) (b) (c)
(d) (e) (f)
Figure 3. Variation of validation index with different m. (a) Iris; (b) TDTA; (c) Infectious Disease (ID); (d) Iris; (e) TDTA; (f) Infectious Disease (ID).
these validation indices can consistently point to an optimal number of clusters with the range of fuzzifiers. The optimal cluster number is corresponding to the smallest values of v1= XB or v2 = VSC. As mentioned
above, XB is fuzzifier-related, incorporating the compactness and separation measures of clusters. As demon-strated in the three datasets, shown in Figure 3(a) IRIS, Figure 3(b) TDTA, and Figure 3(c) ID, the overall trends of XB are consistent across different fuzzifiers m, which implies that as long as XB can point to an op-timal number of clusters, the smallest m could be identified. XB has consistent local minimum at 2 clusters with
Furthermore, we examined the variation of VSC, a non-fuzzifier-related index, over the same datasets, shown in Figures 3(d)-(f). The VSC curve of m = 2 is corresponding to the lower red curve. VSC incorporates the compactness and overlap measures to evaluate the quality of FCM. For all three datasets, VSC identifies the op-timal number of clusters with a consistent minimum value across different fuzzifers.
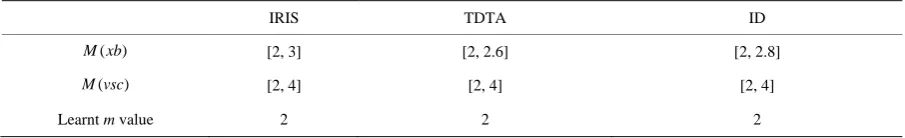
Since we can obtain the consistency of an optimal number of clusters by testing different fuzzifiers, the fuzz-fier with the lowest value for this consistency is regarded as the most appropriate for fuzzy clustering because of computational efficiency. Note that our idea is to detect this important consistency to establish a generalized fuzzifier evaluation algorithm; determining a final number of optimal clusters is not the scope of this study but a natural next step. Table 2 shows the fuzzifier obtained with NIFEs over these 3 datasets.
[image:5.595.96.532.402.526.2]Using the two methods from References [12] and [13], we compute the optimal fuzzifiers for all these data-sets as our baseline. Table 3 displays the m values for each dataset from these two methods. Particularly, inf in
Table 3 means that the Reference [12] method failed. Compared to Table 3, NIFES agrees with the majority of fuzzifier identified by Reference [12] or [13]. In general, NIFEs seems to be more reliable, for example, m = 2 is appropriate for IRIS according to literature but Reference [13] suggested m = 4; for TDTA, both Reference [13] and our NIFES agree m = 2, which is appropriate according to our previous investigation while Reference [12] suggested 3.993.
Furthermore, given the real cluster number for each data set shown in Table 1, we examined the clustering accuracy of different m displayed in Figure 4. Given a sample size N, denote G as the correct number of cases identified in known clusters, the clustering accuracy is defined as G/N.
As shown in Figure 4, fuzzifier m = 2 could lead to better or comparable clustering accuracy given the identi-fied optimal cluster number across the three datasets. Especially for longitudinal data with missing values (TDTA and ID), m = 2 shows the correct accuracy according to our known results.
4. Conclusions
This paper investigates selection of fuzzifier, an important element for FCM, using three real datasets: one well-
[image:5.595.87.540.569.638.2](a) (b) (c) Figure 4. Clustering accuracy with different fuzzifier m across 3 datasets. (a) IRIS; (b) TDTA; (c) ID.
Table 2. m value leant from new integrated fuzzifier evaluation (NIFES) algorithm.
IRIS TDTA ID
( )
M xb [2, 3] [2, 2.6] [2, 2.8]
( )
M vsc [2, 4] [2, 4] [2, 4]
[image:5.595.92.541.664.718.2]Learnt m value 2 2 2
Table 3. m value computed using methods from reference [12] and [13].
IRIS TDTA ID
Reference [12] inf 3.993 inf
Reference [13] 4 2 2
2 2.2 2.4 2.6 2.8 3 3.2 3.4 3.6 3.8 4 0.885 0.89 0.895 0.9 0.905 0.91 0.915 Fuzzifier value c lus ter ing ac c ur ac y
2 2.2 2.4 2.6 2.8 3 3.2 3.4 3.6 3.8 4 0.9 0.91 0.92 0.93 0.94 0.95 0.96 0.97 0.98 0.99 Fuzzifier value c lus ter ing ac c ur ac y
known biological data, IRIS; and two longitudinal data with missing values, TDTA and ID. We design a new integrated fuzzifier evaluation and selection (NIFEs) algorithm to assess and select the proper fuzzifer. The conceptual NIFEs framework is comprehensive, involving testing (non-)fuzzier related indices and clustering accuracy across a range of fuzzifiers. Our results indicate that our NIFEs algorithm is more reliable than two ex-isting methods and could be a complementary reference for the fuzzy clustering field. Our findings indicate that the consistent optimal number of clusters can be learnt from testing different fuzzifiers for each dataset and the fuzzifier with the lowest value for this consistency should be selected for clustering for computational efficiency. Our evaluation also shows that the fuzzifier impacts the clustering accuracy. For longitudinal data with missing values, m = 2 could be an empirical rule to start fuzzy clustering, and the best clustering accuracy was achieved for tested data, especially using our multiple-imputation based fuzzy clustering.
Acknowledgements
This research was supported by NIH grant R01 DA033323-01A1, 1UL1RR031982-01 Pilot Project to Dr. Fang.
References
[1] Clark, M.C., Hall, L.O., Goldgof, D.B., et al. (2002) MRI Segmentation Using Fuzzy Clustering Techniques. IEEE Engineering in Medicine and Biology Magazine, 13, 730-742. http://dx.doi.org/10.1109/51.334636
[2] Wang, C.J., Fang, H. and Wang, H. (2014) DAG-Searched and Density-Based Initial Centroid Location Method for Fuzzy Clustering of Big Biomedical Data. BICT2014. http://dx.doi.org/10.4108/icst.bict.2014.257932
[3] Tsai, D.-M. and Lin, C.-C. (2011) Fuzzy C-Means Based Clustering for Linearly and Nonlinearly Separable Data. Pat-tern Recognition, 44, 1750-1760. http://dx.doi.org/10.1016/j.patcog.2011.02.009
[4] Mei, J.-P. and Chen, L.H. (2013) LinkFCM: Relation Integrated Fuzzy c-Means. Pattern Recognition, 46, 272-283.
http://dx.doi.org/10.1016/j.patcog.2012.06.012
[5] Fang, H., Johnson, C., et al. (2011) A New Look at Quantifying Tobacco Exposure during Pregnancy Using Fuzzy Clustering. Neurotoxicology and Teratology, 33, 155-165. http://dx.doi.org/10.1016/j.ntt.2010.08.003
[6] Fang, H., Dukic, V., et al. (2012) Detecting Graded Exposure Effects: A Report on an East Boston Pregnancy Cohort. Nicotine & Tobacco Research, 14, 1115-1120. http://dx.doi.org/10.1093/ntr/ntr272
[7] Bezdek, J.C. and Hathaway, R.J. (1987) Convergence and Theory for Fuzzy c-Means Clustering: Counterexamples and Repairs. IEEE Trans. Pattern Anal., 17, 873-877.
[8] Chan, K.P. and Cheung, Y.S. (1992) Clustering of Clusters. Pattern Recognition Letters, 25, 211-217.
http://dx.doi.org/10.1016/0031-3203(92)90102-O
[9] Pal, N.R. and Bezdek, J.C. (1995) On Cluster Validity for the Fuzzy c-Means Model. IEEE Transactions on Fuzzy Systems, 3, 370-379. http://dx.doi.org/10.1109/91.413225
[10] Ozkan, I. and Turksen, I.B. (2007) Upper and Lower Values for the Level of Fuzziness in FCM. Information Sciences, 177, 5143-5152. http://dx.doi.org/10.1016/j.ins.2007.06.028
[11] Huang, M., Xia, Z.X., Wang, H.B., et al. (2012) The Range of the Value for the Fuzzifier of the Fuzzy c-Means Algo-rithm. Pattern Recognition Letters, 33, 2280-2284. http://dx.doi.org/10.1016/j.patrec.2012.08.014
[12] Yu, J., Cheng, Q.S. and Huang, H.K. (2004) Analysis of the Weighting Exponent in the FCM. IEEE Transactions on Systems, Man, and Cybernetics, Part B: Cybernetics, 34, 634-639. http://dx.doi.org/10.1109/TSMCB.2003.810951
[13] Schwämmle, V. and Jensen, O.N. (2010) A Simple and Fast Method to Determine the Parameters for Fuzzy c-Means Cluster Analysis. Bioinformatics, 26, 2841-2848. http://dx.doi.org/10.1093/bioinformatics/btq534
[14] Xie, X.L. and Beni, G. (1991) A Validity Measure for Fuzzy Clustering. IEEE Transactions on Pattern Analysis and Machine Intelligence, 13, 841-847. http://dx.doi.org/10.1109/34.85677
[15] Rezaee, B. (2010) A Cluster Validity Index for Fuzzy Clustering. Fuzzy Sets and Systems, 161, 3014-3025.
http://dx.doi.org/10.1016/j.fss.2010.07.005
[16] https://archive.ics.uci.edu/ml/datasets/Iris