16
Enhancing Network Output Load in IEEE 802.15.4
with Different Modulations for Wireless Sensor
Networks
Sukhvinder S Bamber
Department of Computer Science & Engg.
National Institute of Technology
Jalandhar, Punjab, India
Ajay K Sharma
Department of Computer Science & Engg.
National Institute of Technology
Jalandhar, Punjab, India
ABSTRACT
This paper presents the network output load at the Fully Functional Device (FFD) and Reduced Functional Devices (RFD‟s) of IEEE 802.15.4 for different modulation schemes. From the simulations it is revealed that Minimum Shift Keying (MSK) is best suited for all types of devices in 802.15.4 for wireless sensor networks (WSNs) if the network output load is to be maximized as more is the output load, more will be the net throughput. Simulations also reveal that Binary Phase Shift keying (BPSK) at all type of devices and Quadrature Amplitude Modulation of 64 bits (QAM_64) at the PAN (Personal Area Network) coordinator are unsuitable.
Keywords
Network output load, RFD, FFD, BPSK, MSK, QAM_64.
1. INTRODUCTION
In the past decade several short range wireless technologies have been developed as an answer to the increasing demand for portable and flexible connectivity. In addition to the upsurge in the deployment of IEEE 802.11 based Wireless Local Area Networks (WLANs), few complementary power and low-cost technologies, among which IEEE 802.15.4, are establishing their place on the market as enablers of the emerging Wireless Sensor Networks (WSNs). The IEEE 802.15.4 standard was specifically developed to address a demand for power, low-bit rate connectivity towards small and embedded devices. Furthermore the standard is trying to solve some problems that were inadequately taken into account by Bluetooth technology.
The choice of the digital modulation scheme in IEEE 802.15.4 significantly affects the output load at the different types of devices in wireless sensor communication system. There is no universal „best‟ choice of the modulation scheme, but depending on the physical characteristics of the channel, parametric optimizations and required level of performance some will prove better fit than the others. The 802.15.4 is an IEEE standard, targeting a set of applications that require simple wireless connectivity, high throughput, very low power consumption and lower module cost.
Despite the intense research and standardization tasks performed over the last years on maximizing the network output load, still many open issues are to be dealt with before wireless sensor networks can be utilized on large scale. Researchers have carried out the research in various areas [1-12]. Some have investigated various performance issues like: Delay, Throughput evaluation
of GTS mechanism [1]. Few have studied load balancing in wireless mesh networks [4]. Some researchers have tried to distribute the load in wireless sensor networks [6]. Few others have forecasted peak load in the neural networks [10]. Some others have coupled the network load for different applications [12].
But none of the researchers have so far compared the modulation schemes for maximizing the network output load at different types of devices in IEEE 802.15.4 for wireless sensor networks. This paper proposes the comparison of three different modulation schemes (MSK, BPSK, QAM_64) to determine the suitability of the scheme according to the device type (FFD/RFD) to maximize the network output load.
The paper is outlined as: Section [1] consists of the Introduction. Section [2] constitutes the system description which contains node model, process model, and parametric tables of the model. Section [3] shows the results and discussions derived from the experiments carried out on 802.15.4 for different modulation schemes. Finally Section [4] concludes the paper.
2. SYSTEM DESCRIPTION
The simulation model implements physical and medium access layers defined in IEEE 802.15.4 standard. The OPNET® Modeler 14.5 is used for developing 802.15.4 wireless sensor network.
17
(b)
[image:2.612.339.524.72.490.2](c)
Figure 1. Network Scenarios (a) BPSK (b) MSK (c) Quadrature (QAM_64)
Figure 1 shows three different Scenarios: BPSK, MSK and QAM_64. BPSK Scenario as shown in Figure 1(a) contains one PAN Coordinator, one analyzer and thirty two end devices out of which sixteen are Guaranteed Time Slots (GTS) enabled and rest are non GTS devices. PAN Coordinator is a fully functional device which manages whole functioning of the network. Analyzer is a routing device which routes the data between PAN coordinator and the End Devices. End Devices are the fixed stations that communicate with the PAN Coordinator in Peer to Peer mode, support GTS and non GTS traffic respectively. Similar Scenarios have been created for MSK and QAM_64 as shown in figure 1 (b & c).
Figure 2 shows the node models for three types of Wireless Personal Area Network (WPAN) devices used for modeling 802.15.4 scenarios. PAN Coordinator, GTS and Non GTS end device have the same node model as shown in Figure 2 (a) while the node model for analyzer is depicted in Figure 2 (b).
(a)
[image:2.612.66.275.80.490.2](b)
Figure 2. Node Model (a) PAN Coordinator, GTS and Non GTS end device (b) Analyzer
18 during CAP. GTS traffic source can produce acknowledged and
unacknowledged time-critical data frames using GTS mechanism. The traffic sink module receives frames forwarded from lower layers. Figure 2 (b) shows the node model for the analyzer which consists of sink and a radio receiver.
Corresponding process models for PAN Coordinator, GTS end device, Non GTS end device and analyzer that deals with each and every operation on the data are depicted in Figure 3:
(a)
[image:3.612.57.283.174.552.2](b)
Figure 3. Process model (a) PAN Coordinator, GTS and Non GTS end device (b) Analyzer
Figure 3 (a) shows the process model for the PAN Coordinator, GTS and Non GTS end device. It consists of the various states: Init whose function is to initialize MAC and GTS scheduling; Wait_beacon which is responsible for synchronizing the traffic of the node with rest of the WPAN in order to minimize the collisions; Idle which is responsible for introducing delays in order to make the maximum use of the resources; gts_slot which is responsible for generation, reception and management of GTS traffic; Backoff_timer used for sensing the medium and transfer of data, CCA - for interrupt processing. Similarly figure 3 (b) shows the process model for analyzer which consists of init and idle states. Basically the process model explains how the data is
sent from the generating node to the PAN Coordinator, taking into consideration the availability of PAN Coordinator as it has to communicate with the other similar nodes.
Here three different Scenarios have been created with three different modulation formats: BPSK, MSK and QAM_64. Following parameters have been set for these scenarios as shown in the table 1 like: destination MAC address (Acknowledged Traffic Source) of the PAN coordinator is broadcast while for GTS enabled end device and Non GTS end device the value is common i.e. PAN coordinator. Similarly the value of Superframe order in WPAN Settings is 6 (common for PAN coordinator, GTS end device and Non GTS end device).
Table 1
Parametric values for PAN Coordinator, GTS and Non GTS End Device in BPSK, MSK and QAM_64 Scenarios
Parameter \ Scenario
PAN Coordinator
GTS Enabled
End Device
Non GTS End Device
Modulation BPSK, MSK, QAM_64
Acknowledged Traffic Source
Destination MAC Address
Broadcast PAN Coordinator MSDU
Interarrival Time (sec)
Exponential(1.0) Constant (1.0)
Exponential(1.0)
MSDU Size (bits) Exponential(912) Constant (0.0)
Exponential(912) Start Time (sec) 0.0 Infinity 1.0 Stop Time (sec) Infinity
Unacknowledged Traffic Source
MSDU Interarrival Time
(sec)
Exponential(1.0) Constant (1.0)
Exponential(1.0)
MSDU Size (bits) Exponential(912) Constant (0.0)
Exponential(912) Start Time (sec) 0.1 Infinity 1.1 Stop Time (sec) Infinity
CSMA/CA Parameters
Maximum Back-off Number
4 Minimum
Back-off Exponent
3
IEEE 802.15.4
Device Mode PAN coordinator End Device MAC Address Auto Assigned
WPAN Settings
Beacon Order 14 7 Superframe Order 6
PAN ID 0
Logging
Enable Logging Enabled
GTS Settings
[image:3.612.329.554.269.712.2]19
Start Time 0.0 0.1 Infinity Stop Time Infinity
Length (slots) 1 0 Direction Receive Transmit Buffer Capacity
(bits)
10,000 1000
GTS Traffic Parameters
MSDU Interarrival Time
(sec)
Exponential(1.0) Constant (1.0)
MSDU Size (bits) Exponential(912) Constant (0.0) Acknowledgement Enabled Disabled
3. RESULTS AND DISCUSSIONS
Simulative study has been carried out for the three different scenarios of 802.15.4: Quadrature (QAM_64), MSK and BPSK. In this section simulative results for the network output load have been presented and discussed for different types of devices in 802.15.4 for wireless sensor networks like: Fully functional Devices (FFD) – those devices that communicate with each and every device in the network in point to point mode and manage the routing tables, Reduced Functional Devices (RFD) – those devices which can communicate only to the FFD but not to the other RFD‟s.
3.1 Network Output Load at FFD – PAN
Coordinator
Figure 4 below indicates that the network output load at the PAN coordinator is: 41936.9 bits/sec for MSK and almost comparable for BPSK and QAM_64 which is: 33623.3 bits/sec. It is observed that network output load is maximum in case of MSK as it is spectrally efficient due to it constant envelope, good BER and self synchronizing capability. Also MSK suffers less from the adjacent signal interferences as it has smooth phase shifts at the symbol boundaries which results in the lower side lobes as compared to other modulation schemes [7, 11]. Also it is observed that load is minimum in case of BPSK & QAM_64 (almost comparable) as BPSK is able to modulate only 1 bit/sec and QAM_64 is more susceptible to noise as the decision points are more close to each other [9].
0 5000 10000 15000 20000 25000 30000 35000 40000 45000
0 132 264 396 528 660 792 924 1056 1188
Time (sec) N e t w o r k O u t p u t L o a d ( b it s /s e c )
[image:4.612.60.284.71.210.2]BPSK MSK QAM_64
Figure 4. Network Output Load at the PAN Coordinator
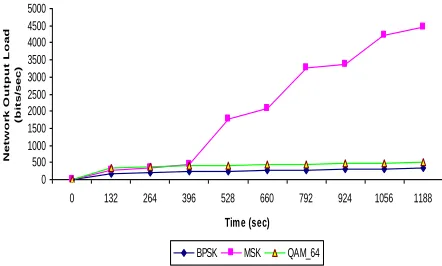
[image:4.612.331.552.182.315.2]3.2 Network Output Load at RFD – GTS End
Device
Figure 5 below depicts that the network output load at the GTS end device is: 4456.6, 502.3 and 334.3 bits/sec for MSK, QAM_64 and BPSK respectively. It is observed that network output load is maximum in case of MSK [7, 11].Also it has been observed that load is minimum in case of BPSK [9].
0 500 1000 1500 2000 2500 3000 3500 4000 4500 5000
0 132 264 396 528 660 792 924 1056 1188
Time (sec) N e t w o r k O u t p u t L o a d ( b it s /s e c )
BPSK MSK QAM_64
Figure 5. Network Output Load at the GTS End Device
3.3 Network Output Load at RFD – GTS End
Device
Figure 6 below shows that the network output load at the Non GTS end device is: 40518.7, 33469.3 and 29240.8 bits/sec for MSK, QAM_64 and BPSK respectively. It is observed network load is maximum in case of MSK [7, 11]. Also it has been observed that network output load is minimum in case of BPSK [9]. 0 5000 10000 15000 20000 25000 30000 35000 40000 45000
0 132 264 396 528 660 792 924 1056 1188
Time (sec) N e t w o r k O u t p u t L o a d ( b it s /s e c )
[image:4.612.330.551.474.603.2]BPSK MSK QAM_64
Figure 6. Network Output Load at the Non GTS End Device
4. CONCLUSIONS
[image:4.612.61.280.561.686.2]20 for MSK, BPSK and QAM_64 respectively. Also results reveal
that output load at the GTS end device and Non GTS end device is: [4456.6, 502.3, 334.3] and [40518.7, 33469.3, 29240.8] bits/sec for MSK, QAM_64 and BPSK respectively. It is concluded that if the output load in a network is to be maximized then MSK should be implemented in IEEE 802.15.4 for WSNs. Also it is concluded that BPSK at all types of devices in IEEE 802.15.4 is unsuitable for WSNs. Furthermore it is concluded that QAM_64 is also unsuitable at the PAN coordinator if IEEE 802.15.4 is to be converted into WSN.
5. REFERENCES
1. Jurcik, P.; Koubaa, A.; Alves, M.; Tovar, E.; Hanzalek, Z.; “A Simulation Model for the IEEE 802.15.4 protocol: Delay/Throughput Evaluation of the GTS Mechanism”, Modeling, Analysis, and Simulation of Computer and Telecommunication Systems, 2007. MASCOTS '07. 15th International Symposium, 24-26 Oct. 2007.
2. IEEE 802.15.4 OPNET Simulation Model,
http://www.open-zb.net/
3. Jan Magne Tjensvold, “Comparision of the IEEE 802.11, 802.15.1, 802.15.4 and 802.15.6 wireless standards”; September 18, 2007.
4. Yigal Bejerano, Seung-Jae Han, Amit Kumar, “Efficient Load-Balancing routing for wireless mesh networks”, Elsevier, COMNET, 2007.
5. Jason Lowe, “Advanced Upstream Modulation”; Clearcable Technical Summit, July 27, 2007.
6. Adel Ali Ahmed, Norsheila Fisal, “A real-time routing protocol with load distribution in wireless sensor networks”, Elsevier, Computer Communications, 2008.
7. Subhash Nanjunde Gowda; “Minimum shift Keying”; Spread Spectrum Systems – 24 May 2004.
8. Emilio Ancillotti, Raffaele Bruno, Marco Conti, Antonio Pinizzotto, “Load-aware routing in mesh networks: Models, algorithms and experimentation”, Elsevier, Computer Communications, 2010.
9. http://www.en.wikipedia.org.
10. P. K. Dash, A. C. Liew, S. Rahman, “Peak load forecasting using a fuzzy neural network”, Elsevier, Electric Power Systems Research, 1995.
11. Charan Langton, “Intuitive Guide to Principles of Communication”, www.complextoreal.com, Dec, 2005.