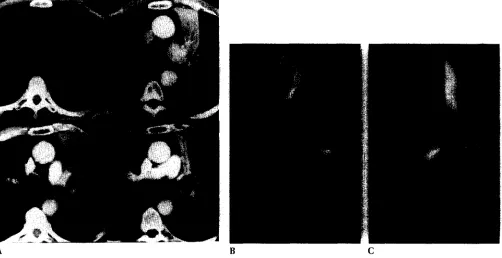
Three dimensional CT of central lung tumors
Full text
Figure

Related documents
Thus, the objective of this paper is to discuss the spatiotemporal land use and land cover change in major river basins (Sungai Tebrau, Sungai Skudai, Sungai Pulai and
• Pi's imam, priest, and pandit notice he was going Pi's imam, priest, and pandit notice he was going to mosque, church, and temple. to mosque, church,
Sonnet: A lyric poem of fourteen lines, usually in.. iambic pentameter, written about one important
Medical therapies for chronic thromboembolic pulmonary hypertension: an evolving treatment paradigm.. Soluble guanylate cyclase as an emerging therapeutic target in
More relevantly to the core of the survey is that these staff and in some cases senior staff, do not believe higher education is necessary in order to maintain
Risk Factor Analysis Tool (this form must be completed for any event potentially involving any of the following risk factors (regardless of whether the event is occurring on or
Medical mandatory reporting is one of the most important subjects of conflict between physician’s duty to confidentiality, respecting patient's confidentiality, and
Each study focused on a different area of financial accounting and the appropriate ways to account for transactions in a company’s four financial statements: the Income Statement,
