© 2016, IRJET | Impact Factor value: 4.45 | ISO 9001:2008 Certified Journal | Page 643
PERFORMANCE ANALYSIS ON FINGERPRINT IMAGE COMPRESSION
USING K-SVD-SR AND SPIHT
Aarthi P .
1, Priya V.
21
Research Scholar, Department of Computer Science, Vellalar College for Women Tamilnadu, India
2
Assistant Professor, Department of Computer Science, Vellalar College for Women Tamilnadu, India
---***---Abstract -
Digital image occupy a prominent place due to the technological innovations. Image compression minimizes the size in bits of a graphics file without degrading the quality of the image. The reduction in file size allows more images to be stored in a certain amount of disk or memory space. It also reduces the time necessary for images to be sent over the internet or downloaded from web pages. Image compression addresses the problem of reducing the amount of data required to represent a digital image. Recognition of persons by means of biometric description is an important technology in the society, because biometric identifiers cannot be shared and they intrinsically characterize the individual’s bodily distinctiveness. Among several biometric recognition technologies, fingerprint compression is very popular for personal identification. This research work has been performed on lossless image compression technique in comparison between K-Singular Value Decomposition-Sparse Representation (K-SVD-SR) and Set Partitioning In Hierarchical Trees (SPIHT) in fingerprint compression. K-SVD-SR algorithm has been taken to compare the reconstructed image quality in terms of mean square error (MSE) and peak signal-to-noise ratio (PSNR) with SPIHT.Key Words:
K-Singular Value Decomposition-SparseRepresentation (K-SVD-SR), Set Partitioning In Hierarchical Trees (SPIHT), mean square error (MSE) and peak signal-to-noise ratio (PSNR).
1. INTRODUCTION
With the increasing growth of technology and the entrance into the digital age, one has to handle a large amount of information every time which often presents difficulties. So, the digital information must be stored and retrieved in an efficient and effective manner, in order for it to be put to practical us. Wavelets provide a mathematical way of encoding information in such a way that it is layered according to level of details. This layering facilitates approximations at various intermediate stages. These approximations can be stored using a lot less space than the original data.
The image is actually a kind of redundant data i.e. it contains the same information from certain perspective of view. By using data compression techniques, it is possible to remove some of the redundant information contained in images. Image compression minimizes the size in bytes of a graphics file without degrading the quality of the image to an unacceptable level. The reduction in file size allows more images to be stored in a certain amount of disk or memory space.
Images contain large amounts of information that requires much storage space, large transmission bandwidths and long transmission times. Therefore it is advantageous to compress the image by storing only the essential information needed to reconstruct the image. An image can be thought of as a matrix of pixel (or intensity) values. In order to compress the image, redundancies must be exploited, (i.e.) areas where there is little or no change between pixel values. Hence images having large areas of uniform color will have large redundancies, and conversely images that have frequent and large changes in color will be less redundant and harder to compress. Visual communication is becoming increasingly important with applications in several areas such as multimedia, communication, transmission and storage of remote sensing images, education and business documents, and medical images.
2. METHODOLOGY
2.1 K-SVD-SR
The K-SVD (K-Singular Value Decomposition) is not effective when the dictionary size is too large. So a new compression standard based on sparse approximation is introduced. Without the ability of learning, the fingerprint images can’t be compressed well now. So, a novel based on K-SVD-SR (K-Singular Value Decomposition-Sparse Representation) is given in this work. The proposed method has the ability by updating the dictionary.
Construct the dictionary
© 2016, IRJET | Impact Factor value: 4.45 | ISO 9001:2008 Certified Journal | Page 644
fingerprint patches. The distribution of different pattern in this set and the distribution in the other database need not be similar they can be dissimilar also.
Three different ways to construct the dictionary, Choose the Algorithm Parameters Comparing the Fingerprint Patches Design the Training Set
Choose the Algorithm Parameters
The size of patches and compression efficiency are directly related. If the dictionary is quite large the arbitrary patch can be represented well which causes more computational complexity. Only with experiments the size of the patch is chosen.
Comparing the Fingerprint Patches
Normally, the fingerprint images are not the multiple sizes of patches. Matching Pursuit is a type of sparse approximation which finds the “Best Matching” projections of multidimensional data onto over complete dictionary. In MP dictionary atoms taken once never taken again; there by reduces the total algorithm complexity.
Design the Training Set
Here have to consider many details to target the problem of fingerprint. They are, number of training samples, components of the training set and how to modify the dictionary.
Divided into patches
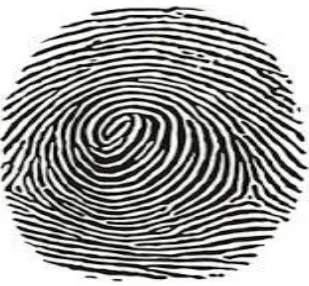
[image:2.595.327.537.102.306.2]The Fingerprint image is divided into square patches which have the same size with the training patches. In Fig-1 the new Fingerprint image is given. The size of the patches has a direct impact on the compression efficiency. The algorithm becomes more efficient as the size increases. In addition, to make the patches fit the dictionary better, the mean of each patch needs to be calculated and subtracted from the patch.
[image:2.595.84.239.574.717.2]Fig –1: A New Fingerprint Image
Fig -2: A Sample K-SVD-SR Dictionary
Here, the similarity measure between two patches is calculated by solving the optimization problem.
S(P1, P2) = – t
F is the Frobenius norm. P1 and P2 are the corresponding matrices of two patches. t, a parameter of the optimization problem, is a scaling factor. Repeat the second step until all patches have been tested.
K-Singular
Value
Decomposition–Sparse
Representation (K-SVD-SR) implementation
This implementation describes about how to use K-SVD-SR algorithm for fingerprint compression. Which includes the steps are,
Create the dictionary Compressing the fingerprint Coding and Quantization
Create the Dictionary
© 2016, IRJET | Impact Factor value: 4.45 | ISO 9001:2008 Certified Journal | Page 645
(OMP) proves to be the best in terms of getting the best out of each iteration.
s.t. ∀i, ǁXi ǁ0 < T
Y is consisted of the training patches, A is the dictionary, X are the coefficients and Xi is the ith column of X. In the sparse solving stage, compute the coefficients matrix X using MP method, which guarantees that the coefficients vector Xi has no more than T non-zero elements. Then, update each dictionary element based on the K-SVD-SR. However, from a run-time point of view, OMP was found to lead to far more efficient overall algorithm.
Since the number of data elements is much larger than the number of dictionary elements, our model assumption suggests that the dictionary atoms are of equal importance, such replacement is very effective in avoiding local minima and over-fitting. Similar to the idea of removal of unpopular elements from the dictionary, found that it is very effective to prune the dictionary from having too-close elements. If indeed such a pair of atoms is found, one of those elements should be removed and replaced with the least-represented signal.
Compressing the fingerprint
A new fingerprint is slices it into square patches which have the same size with the training patches. The size of the patches has a direct impact on the compression efficiency. The algorithm becomes more efficient as the size increases. However, the computation complexity and the size of the dictionary also increase rapidly. The proper size should be chosen. In addition, to make the patches fit the dictionary better, the mean of each patch needs to be calculated and subtracted from the patch. After that, compute the sparse representation for each patch. Those coefficients whose absolute values are less than a given threshold are treated as zero. For each patch, Four kinds of information need to be recorded they are, the mean value, the number about how many atoms to use, the coefficients and the location. The test shows that many image patches require few coefficients. Consequently, compared with the use of a fixed number of coefficients, the method reduces the coding complexity and improves the compression ratio.
Coding and Quantization
Entropy coding of the atom number of each patch, the mean value of each patch, the coefficients and the indexes is carried out by static arithmetic coders. The atom number of each patch is separately coded. The mean value of each patch is also separately coded. The quantization of coefficients is performed which are obtained from the training set over the dictionary. The first coefficient of each block is quantized with a larger number of bits than other coefficients and coded using a separate coder. The first index and other indexes are coded by the same
[image:3.595.322.546.176.388.2]arithmetic encoder. The first coefficient is quantized with 6 bits and other coefficients are quantized with 4 bits.
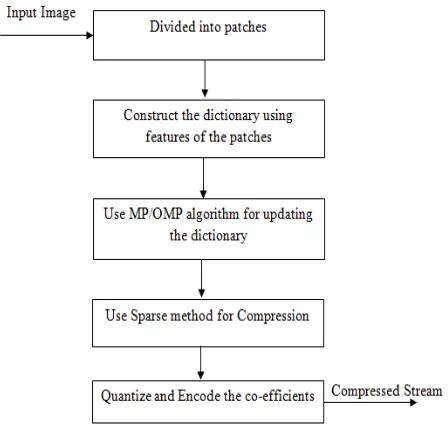
Fig -3 depicts the architecture of the K-SVD-SR algorithm for the compression of the finger print images
Fig -3: Architectural diagram for K-SVD-SR
The fingerprint is to be sliced into small patches.
Have to calculate the mean of each patch and it is subtracted from the patch.
Matching pursuit (MP) method is used to solve the minimization problem for each patch. If the absolute value of a coefficient is less than a given threshold, then it’s assumed as zero. Then the remaining coefficients and their locations are recorded.
Finally have to encode the atom number of each patch, the mean value of each patch, and the indexes, quantize and encode the coefficients.
Then the compressed stream is output.2.2 SPIHT
SPIHT (
Set
PartitioningIn Hierarchical Trees)
is an image compression algorithm that exploits the inherent similarities across the subbands in a wavelet decomposition of an image.© 2016, IRJET | Impact Factor value: 4.45 | ISO 9001:2008 Certified Journal | Page 646
partitions the decomposed wavelet into significant and insignificant partitions based on the three lists. They are
The List of Insignificant Pixels (LIP) The List of Insignificant Sets (LIS) The List of Significant Pixels (LSP)
The List of Insignificant Pixels (LIP)
It contains individual coefficients that have magnitudes smaller than the thresholds.
The List of Insignificant Sets (LIS)
It contains set of wavelet coefficients that are defined by tree structures and are found to have magnitudes smaller than the threshold.
The List of Significant Pixels (LSP)
It is a list of pixels found to have magnitudes larger than the threshold (significant).
Spatial orientation trees
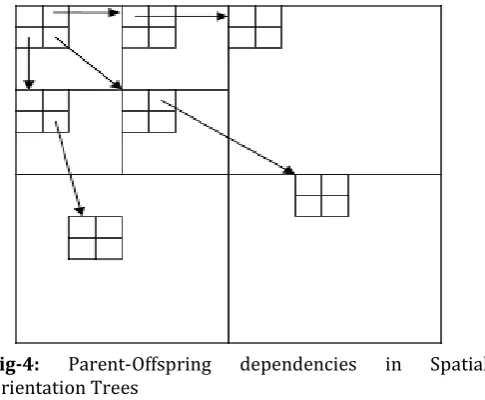
[image:4.595.42.285.411.611.2]A 2-D biorthogonal wavelet transform is applied to an image to produce a coarse-to-fine pyramid structure of sub-images.
Fig-4: Parent-Offspring dependencies in Spatial
Orientation Trees
Normally, most of the images energy is concentrated the low frequency components. Consequently, the various decreases as one move from the highest to the lowest of the subband pyramid. There is a spatial self similarity between subbands, and the coefficients are expected to be better magnitude-ordered as one move downward in the pyramid following the same spatial orientation.
A tree structure, called spatial orientation tree, naturally defines the spatial relationship on the hierarchical pyramid. Fig -4 shows how the spatial orientation tree is defined in a pyramid constructed with recursive four band splitting. Each node of the tree corresponds to a pixel, and
is identified by the pixel coordinate. Its direct descendants (offspring) correspond to the pixels of the same spatial orientation in the next finer level of the pyramid. The tree is defined in such a way that each node has either no offsprings, which always form a group of 2x2 adjacent pixels. The pixels in the highest level of the pyramid are the tree roots and are also grouped in 2x2 adjacent pixels. However, their offspring branching in different, and in each group one of has no descendants. Part of the spatial orientation trees are used as the partitioning subset in the sorting.
In the SPIHT, scalar quantization algorithm commencing at the coarsest resolution, the coefficients are tested against a threshold. Compression is achieved by assigning a single bit to any set for which all members are below the threshold (insignificant). The threshold is found as
= 2[ max| ]
Where is the coefficient oat coordinate (i, j) in the image. The decomposition process is repeated until reach the final scale.
One of the most powerful wavelet based image compression techniques is SPIHT. The main advantages of SPIHT method are it can provide Good Image quality with high PSNR and it is the best method for progressive Image transmission. SPIHT algorithm is represented by the equation as follows
(T) =
(𝑇), is the importance of a set of coordinate T. 𝐶𝑖,, is the coefficient value at each coordinate (i, j). The List of Significant Pixel (LSP) and List of Insignificant Set (LIS) lists contain the coordinates of coefficients. The LSP list is initially empty. In each pass, the members of the List of Insignificant Pixel (LIP) are first processed, then the members of LIS. This is essentially the significance map encoding step. In the refinement step the elements of LSP are processed. Each coordinate contained in LIP is examined first.
3. RESULTS AND DISCUSSION
© 2016, IRJET | Impact Factor value: 4.45 | ISO 9001:2008 Certified Journal | Page 647
PSNR = 10 ( Where
MSE =
Where a = Input image size b = Output image size M = Number of rows N = Number of columns
Compression Ratio is one of several measures that are commonly used to express the efficiency of a compression method. It is calculated as
Compression ratio =
[image:5.595.371.499.176.302.2]Nearly 50 fingerprint images are randomly downloaded from various websites. Fig- 5 shows the sample of the images in the database.
Fig- 5: Fingerprint Image Database
Fingerprint image compression using K-SVD-SR
algorithm
A sample image Fingerprint image1 has been taken from the Fingerprint image database, which is shown in Fig- 6.
Fig – 6: Sample Fingerprint image(Fing1)
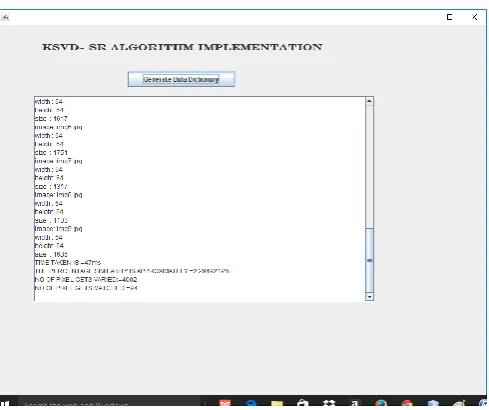
The dictionary constructed value of the image is shown in the Fig-7.
[image:5.595.313.558.362.567.2] [image:5.595.45.302.401.631.2]© 2016, IRJET | Impact Factor value: 4.45 | ISO 9001:2008 Certified Journal | Page 648
[image:6.595.37.288.94.263.2]
Fig- 8: Patch Conversion for Fingerprint image1 using K-SVD-SR.
Patch Conversion for Fingerprint image1 using K-SVD-SR algorithm is shown in the Fig- 8.
[image:6.595.307.564.173.433.2]After applying the K-SVD-SR on Fingerprint image1, the reconstructed image is shown in Fig- 9.
Fig- 9: K-SVD-SR reconstructed image
After applying thr K SVD- SR algorithm . the resultant for the reconstructed image is shown in the Fig- 10.
The size of the reconstructed image is 6 kb. The PSNR ratio, MSE, CR and Throughput time of the Fingerprint image1 are 5.31, 18.0, 5:2, and 94ms respectively.
Fig- 10: Fingerprint image(Fing1) compression using K-SVD-SR algorithm
The Table -1 depicts the Compression result for the K SVD-SR algorithm result . For the sample finger print image the resultant values of PSNR, MSE, CR and Throughput time are given.
Table -1: Compression result for K-SVD-SR algorithm
Serial
Number Fingerprint Name
Before Compression
(KB)
After Compression
(KB)
Throughput
Time (ms) PSNR MSE CR
1 Fing1 15 6 63 5.31 18 5:2
2 Fing2 20 8 62 5.02 25 5:2
[image:6.595.76.244.376.506.2]© 2016, IRJET | Impact Factor value: 4.45 | ISO 9001:2008 Certified Journal | Page 649
Chart 1: Resultant graph for K-SVD-SR algorithm
The Chart- 1 shows the resultant graph for the fingerprint compression of sample images using K-SVD-SR algorithm
Fingerprint image compression using SPIHT
algorithm
A sample image Fingerprint image1 has been taken from the Fingerprint image database, which is shown in Fig- 11.
Fig-11: Sample Fingerprint image (Fing1)
Fig-12: Processing list for SPIHT
Fig-12 shows the processing list value for fingerprint compression using SPIHT algorithm. It splits the values for
further process of compression. Thus the processing list helps to find the significant value. After that encoding and decoding the bitstream into the image.
The reconstructed image is displayed, which is shown in the Fig- 13.
Fig- 13: Compressed image using SPIHT
Fig- 14 depicts the resulatant values for the sample fingerprint image compression using SPIHT algorithm. The size of the reconstructed image is 3 kb. The PSNR ratio, MSE, CR and Throughput time of the Fingerprint image1 are 27.09, 12.7, 5:1, and 47ms respectively.
Fig-14: Fingerprint image compression using SPIHT algorithm
© 2016, IRJET | Impact Factor value: 4.45 | ISO 9001:2008 Certified Journal | Page 650
S .No Fingerprint Name Compression Before
(KB)
After Compression
(KB)
Throughput
Time (ms) PSNR MSE CR
1 Fing1 15 3 31 27.09 12.7 5:1
2 Fing2 20 4 47 25.83 17 5:1
3 Fing3 18 4 31 26.12 15.9 9:2
The Table- 2 shows the PSNR, MSE, CR and Throughput
time for sample fingerprint image compression using SPIHT algorithm. The Chart- 2 shows the resultant graph for the fingerprint image compression using SPIHT algorithm.
Chart- 2: Resultant Graph for SPIHT algorithm
The Table- 3 depicts the comparison result for fingerprint image compression using SPIHT algorithm
Table- 3: Comparison of K-SVD-SR and SPIHT
S. No
Finger print Name
Before Compression (kb)
After Compression (kb) KSVD -SR
After Compression (kb) SPIHT
1 Fing1 15 6 3
2 Fing2 20 8 4
3 Fing3 18 7 4
Hence the result proves, SPIHT can compress and reconstruct the image without changing the originality and
the quality of the images is better than the K-SVD-SR algorithm.
7.
CONCLUSION AND FUTURE WORK
CONCLUSION
This research work presents the comparison between K-Singular Value Decomposition-Sparse Representation (K-SVD-SR) and Set Partitioning In Hierarchical Trees (SPIHT) in Fingerprint Compression. Various fingerprint images in terms of size, quality and computational time are compressed using SPIHT and K-SVD-SR. The qualities of the fingerprint images are evaluated by the PSNR (Peak Signal To Noise Ratio), MSE (Mean Square Error) and CR (Compression Ratio).
By examining the PSNR and MSE values both in K-SVD-SR and SPIHT algorithm, SPIHT proves and promises that it can compress and reconstruct the image without changing the originality and the quality of the input image. From the experiment results it can be concluded that the SPIHT algorithm is effective and efficient than the K-SVD-SR algorithm in terms of PSNR, MSE, CR and computational time.
FUTURE WORK
This research can further be extended with the following novel ideas,
Machine learning approaches and artificial intelligence techniques can be used for image compression and compare with SPIHT results.
Other biometric identifiers like Face recognition, DNA, Palm print, Hand geometry, Iris recognition, Retina also can be used in SPIHT for compression
REFERENCES
[1] Chandandeep Kaur and Sumit Budhiraja,
© 2016, IRJET | Impact Factor value: 4.45 | ISO 9001:2008 Certified Journal | Page 651
Survey”, International Journal of Emerging Technology and Advanced Engineering, 2250-2459, 2013.
[2] Amandeep Kaur and Monica Goyal, “ROI Based
Image Compression of Medical Images” International Journal of Computer Science Trends and Technology, 2347-8578, 2014.
[3] Narasimhulu .S and Ramashri .T, “Gray-Scale
Image Compression Using DWT-SPIHT Algorithm”, International Journal of Engineering Research and Applications, 2248-9622, 2012.
[4] Meng Wang and Qi-rui Han, “An improved
Algorithm of SPIHT based on the Human Visual Characteristics”, World Academy of Science, Engineering and Technology, 2008.
[5] Nagamani .K and Ananth .A.G, “Image
Compression Techniques for High Resolution Satellite Imageries using Classical Lifting Scheme”, International Journal of Computer Applications, 0975-8887, 2011.
[6]Ritu Chourasiya and Ajit Shrivastava, “ A Study
of Image Compression based Transmission Algorithm using SPIHT for Low Bit Rate application”, Advanced Computing: An International Journal, 2012.
[7] Wang Shu-zhong, “Sparse Matrix of Image
Denoising Method based on SVD”, International Journal of Multimedia and Ubiquitous Engineering, 2014.