Abstract—Recently, the use of automated product quality
inspection in industries is rapidly increasing. Quality is commonly related with product to satisfy the customer’s desire and it is important to maintain it before sending to customers. This paper presents a technique for product inspection based on quadratic distance and level classifier. For the proposed technique, soft drink beverages have been used as product that to be tested for quality inspection. The offline database is created to inspect the product based on color concentration and water level quality inspection. The system used Otsu’ method for segmentation, histogram from combined red, green, blue (RGB) color model for features extraction, and quadratic distance classifier to classify the product based on color concentration. For water level, the coordinate of image is set to measure the range of water level. The experiment result shows that the proposed technique is 100% accurate.
Index Terms—Automatic visual inspection, Color
classification, Level analysis, Quadratic distance classifier
I. INTRODUCTION
OWADAYS, many industries have been upgraded from manual to automated visual inspection to inspect everything from pharmaceutical drugs to textile production. The human visual system is adapted to perform in a world of variety and change, the visual inspection process, on the other hand, requires observing the same type of image repeatedly to inspect the product [1]. Some reviews [2]-[5], [6] show that the accuracy of human visual inspection declines with dull, endlessly routine jobs. Automated visual inspection is obviously the alternative to the human inspector. The demand for industrial automation and the general acceptance among manufacturers show that the Manuscript received January 23, 2017.
N. Mohd Saad is with Center for Robotics & Industrial Automation (CeRIA) and Faculty of Electronic and Computer Engineering, Universiti Teknikal Malaysia Melaka (UTeM), 76100 Durian Tunggal, Melaka, Malaysia (E-mail: [email protected]).
N.N.S. Abdul Rahman is with Center for Robotics & Industrial Automation (CeRIA) and Faculty of Electronic and Computer Engineering, Universiti Teknikal Malaysia Melaka (UTeM), 76100 Durian Tunggal, Melaka, Malaysia (E-mail: [email protected]).
A.R. Abdullah is an Associate Professor and coordinator with Center for Robotics & Industrial Automation (CeRIA) and Faculty of Electrical Engineering, Universiti Teknikal Malaysia Melaka (UTeM), 76100 Durian Tunggal, Melaka, Malaysia (E-mail: [email protected]).
A.R. Syafeeza is with Center for Robotics & Industial Automation (CeRIA) and Faculty of Electronic and Computer Engineering, Universiti Teknikal Malaysia Melaka (UTeM), 76100 Durian Tunggal, Melaka, Malaysia (E-mail: [email protected]).
N.S.M. Noor is with Center for Robotics & Industrial Automation
automated systems will increase productivity and improve product quality [7], [8].
A vision inspection program can be a valuable tool for a wide range of beverage manufacturers. The ability of vision inspection to detect and prevent defective product packaging from being distributed to consumers is one of the good system. In recent years, retailers and consumers have become much less tolerant with poor packaging quality that can cause health risks or increased retailer costs because of manual inspection by humans.
Based on the manual inspection and quality of product issue, this paper is conducted to design the quality inspection for beverage product that can be used for automation process. In developing the quality inspection algorithm, new features will be constructed to carry out two processes of the beverage quality inspection. A quadratic distance classifier technique is proposed in this paper to classify a good or reject of beverage product, based on color concentration and level of water in a bottle. This technique is used to separate two or more classes of object by a quadratic surface. The main advantage of quadratic distance classifier is that the parameters of each class are estimated independently using samples of one class only. It is also has high efficiency, and when the differences on images reach to some extent, it can get high accuracy.
In this paper, an automatic visual inspection system for beverage product is developed as a system that only focused on the development of the quality inspection algorithm using Matlab software. Besides, this paper proposed a design of algorithms to classify the color concentration and water level of beverage product. This paper also proposed a design GUI for color concentration and a water level of quality inspection that completing the system. The results show that the accuracy of the system with the proposed technique is better than manual inspection technique.
The remainders of this paper are shown in the followings. Section II is described and illustrated the method used to developed visual inspection system. Section III is the experimental result that has been analyzed. Section IV is an overall conclusion about this paper.
II. METHODOLOGY
The color and water level quality inspection mainly employs a simple input device and software. Matlab software is chosen for the software development, as it provides a suitable GUI.
Quadratic Distance and Level Classifier for
Product Quality Inspection System
N. Mohd Saad, N.N.S. Abdul Rahman
,
A.R. Abdullah, A.R. Syafeeza, N.S.M. Noor
from source. The digital color camera 5.0 Megapixel is used to take the image as a sample. This paper is used 246 samples, product which is based on colors for beverage products (tropical, strawberry, orange, root beer and grape). The captured image is analyzed using a Matlab software. There are three main steps to categorize the image: color segmentation, classification and level.
B. Color Process
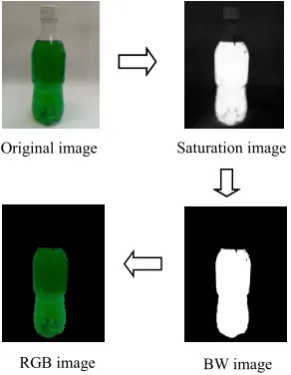
Fig. 1 shows the analysis framework for color beverages classification. The process is started by converting the input images of red, green, blue (RGB) color model for hue, saturation, value (HSV) representations. This is because HSV color space is similar to the way in which humans perceive color and less complex in terms of hue and saturation. Here, only S component is needed to do the segmentation and thresholding process. Otsu method and morphological operation are applied to segment the region of interest (ROI) area. Histogram analysis is performed to the ROI area. Lastly, the color saturation is classified by using the Quadratic distance classifier.
[image:2.595.49.288.321.489.2]
Fig. 1. Color classification process
C. Color Segmentation
Segmentation process is dividing an image into parts which is its shaper area [9]. The color segmentation often used for indexing and management of data. It is used to separate an image into certain division, which has similarity in the color information. Segmentation is a process that divides an image into its region or objects that have similar features or characteristics.
D. RGB to HSV
In RGB to HSV, the image is converted from RGB to HSV and saturation component. It is based on such intuitive color characteristics a tint, shade and tone. The coordinate system is cylindrical, and the colors are defined inside a hexcone. The hue H is running from 0 to 360º. The saturation of S is the degree of strength or purity and it is from 0 to 1. Purity is how white is added to the color, so S=1 makes the purest color. The brightness of V also ranges from 0 to 1, where 0 is the black.
E. Otsu’ Method
Thresholding is a method of creating binary image from gray level image [10]. Otsu’ method is utilized image thresholding or, the reduction of a gray level image to a binary image. Otsu’ proposed a method that maximizes the separability of the resultant classes in gray levels utilizing a between-class variance function [11]. The description of the syntax are, level = graythresh(I) computes a global threshold (level) that can be used to convert an intensity image to a binary image with im2bw.
F. Classification Process
The image is classified by using the quadratic distance technique. From the feature extraction, image is converted into red, green and blue histogram to get the distribution data in the image. The image must be normalized to get the value from 0-1. The red, green and blue histogram is divided into 10 bins and then it is combined to become one RGB histogram which is has 30 bins to view the distributed data from the images.
)] ( 2 ) ( 1
[P i P i 2
Vthresh
=
− , i = 1,2,3,..,30 (1) Where, P1(i) is reference image and P2(i) is the test imagefrom the histogram bins. Fig. 2 shows an example of the color process for the reference image.
Fig. 2. Color process of reference image
G. Level Process
The level classification process is inspected based on three conditions which are level pass, level overfill and level underfill. The input image is processed by setting two points for range of level. The observation of this experiment shows that if the water is above from point 1, the level is overfill. Then, if the water is below from point 2, the level is underfill. The level is passed when the water is between at point 1 and point 2. This process is shown in Fig. 3 to Fig. 5.
Input image
RGB to HSV
Take S Component
Thresholding (Otsu method)
Small pixel removal (Morphological
operation) ROI
(Segmentation area) Histogram
Analysis (R, G, B, Combine)
Quadratic Distance Classifier
Classified color
Original image Saturation image
[image:2.595.354.500.369.557.2]Fig. 3. Level Pass
Fig. 4. Level Overfill
[image:3.595.321.530.47.250.2]Fig. 5. Level Underfill
III. RESULTS
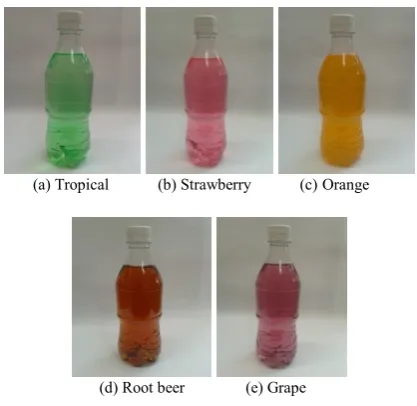
Following are the results of the experiment that has been carried out. Fig. 6 shows five types of reference images which are used as the template in classification stage. Fig. 7 shows an example of beverages for color classification failed.
(a) Tropical (b) Strawberry (c) Orange
[image:3.595.310.558.320.452.2](d) Root beer (e) Grape
Fig. 6. Five types products of reference image
(a) Tropical (b) Strawberry (c) Orange
(d) Root beer (e) Grape
Fig. 7. Five type’s examples of color fail
Fig. 8 and Fig. 9 shows the histogram distributions for color intensity of sample in Fig. 6 (b) and Fig. 7 (b), respectively.
0 50 100 150 200 250 300
0 2000 4000 6000 8000 10000 12000
Red channel Green channel Blue channel
Fig. 8. RGB combine graph of reference image
0 50 100 150 200 250 300 0
2000 4000 6000 8000 10000 12000
[image:3.595.308.561.488.630.2]Red channel Green channel Blue channel
Fig. 9. RGB combine graph of test image
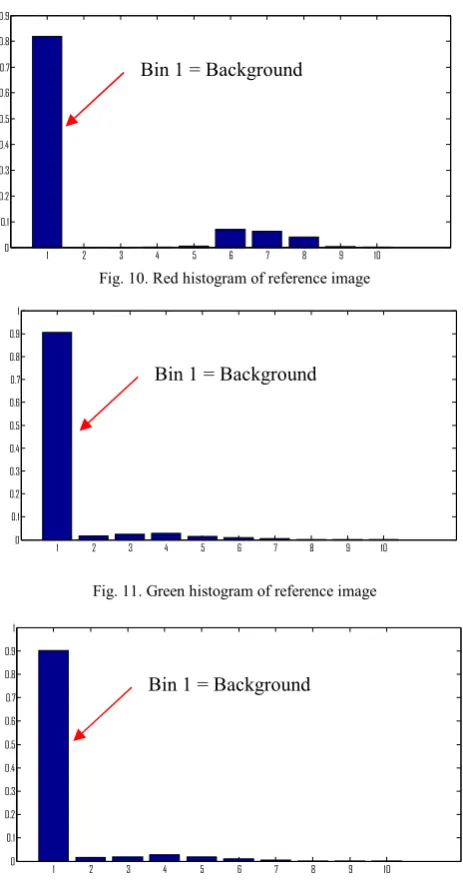
Afterwards, the 8-bit RGB histograms are grouped into 10-bin histogram. The results are shown in Fig. 10 – Fig.12 for red, green and blue component of reference image strawberry in Fig. 6(b), respectively.
Original image BW image Output image
Original image BW image Output image
Original image BW image Output image
Red channel Blue channel
Green channel
Red channel Blue channel
[image:3.595.69.269.549.745.2]1 2 3 4 5 6 7 8 9 10 0
[image:4.595.51.283.45.490.2]0.1 0.2 0.3 0.4 0.5 0.6 0.7 0.8 0.9
Fig. 10. Red histogram of reference image
1 2 3 4 5 6 7 8 9 10
[image:4.595.315.533.49.170.2]0 0.1 0.2 0.3 0.4 0.5 0.6 0.7 0.8 0.9 1
Fig. 11. Green histogram of reference image
1 2 3 4 5 6 7 8 9 10
0 0.1 0.2 0.3 0.4 0.5 0.6 0.7 0.8 0.9 1
Fig. 12. Blue histogram of reference image
Bins first of histogram show the value of background image which is black image and the rest bins shown the value of color images. The background image was ignored and data from bin 2-10 was taken for analysis. These histograms are then combined into one variable for the classification process. This is shown in Fig. 13 and Fig. 14.
0 5 10 15 20 25 30
[image:4.595.312.548.362.453.2]0 0.01 0.02 0.03 0.04 0.05 0.06 0.07
Fig. 13. Combination of RGB histogram for reference image
0 5 10 15 20 25 30
0 0.01 0.02 0.03 0.04 0.05 0.06 0.07
Fig. 14. Combination of RGB histogram for test image
Value of red component is from bin 1-9, green component bin 10-18 and the blue component bin 19-27. The rest three bins are ignored and not taken because there is from the background image. Only value from bin 1-27 are used to calculate the distance and difference of two color images which are image color pass (reference image) and image fail (test image).
The data of each bin from two RGB histogram of the reference image, P1(i) and test image P2(i) are calculated by
using the quadratic distance formula as shown in Equation 1 to get distance value of two color images. This distance value can differentiate the color of two images. Fig. 15 shows the classification process.
)] ( 2 ) ( 1
[P i P i 2
Vthresh
−
=
Fig 15. Block diagram of color classification process
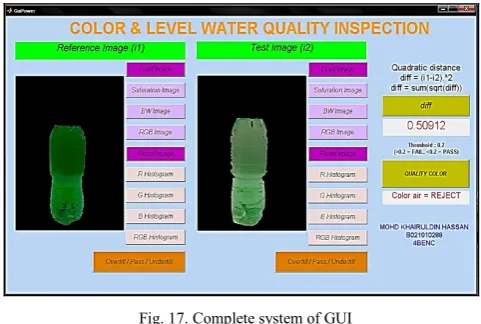
[image:4.595.303.546.558.704.2]For all sample results, the threshold value is set by 0.2 which is for color PASS when the threshold value less than 0.2 and if more than 0.2 the color of the images were REJECT. Fig. 16 and Fig.17 show the complete graphical user interface for the proposed system.
Fig. 16. GUI layout Bin 1 = Background
Bin 1 = Background
Bin 1 = Background
R G B
R G B
= 0.5091 Color = Reject
[image:4.595.54.271.608.722.2]Fig. 17. Complete system of GUI
Fig. 18 shows the percentage of each sample image that is tested in real-time system, 100% accuracy is achieved during this testing.
Fig. 18. System accuracy graph
IV. CONCLUSION
This paper has presented a system of beverage quality inspection process. The quality inspection was divided into three main processes; which are a color classification process, range level of water inspection and graphical user interface for the system. Color classification analysis introduces two proposed techniques which are Otsu’ method and Quadratic distance classifier. Images of sample are taken by digital color camera for experimental setup. All the images are processed by using Matlab software and its image processing toolbox. In color analysis, original image is converted to HSV and take S component which is saturation component to process images. After that, it uses Otsu method to threshold and become black and white image, and then ROI is converted for graphical analysis. The quadratic distance classifier technique is used to classify the color image and find the distance value between two color images based on the histogram. The coordinates of the image are set to find the range of pass, overfill and underfill of water level in the bottle. The GUI is designed by using user interface object that available in Matlab software. The system is tested and 100% accuracy is achieved.
ACKNOWLEDGMENT
The authors would like to thank to the Universiti Teknikal Malaysia Melaka (UTeM), Rehabilitation Engineering & Assistive Technology (REAT) under Center for Robotics &
Higher Education (MOHE), Malaysia for sponsoring this work under project GLuar/STEVIA/2016/FKE-CeRIA/l00009 and the use of the existing facilities to complete this project.
REFERENCES
[1] D. H. Harris, "The nature of industrial inspection," Human Factors, vol. 11, no. 2, pp. 139 148, 1969.
[2] J. W. Schoonard and J. D. Gould, "Field of view and target uncertainty in visual search and inspection," Human Factors, Feb. 1973.
[3] K. J. Pithadiya, C. K. Modi & J. D. Chauhan (2011), “Selecting the Most Favourable Edge Detection Technique for Liquid Level Inspection in Bottles” International Journal of Computer Information Systems and Industrial Management Applications (IJCISIM) ISSN: 2150-7988 Vol.3, pp.034-044, 2011.
[4] Mohammad A. Younes, S. Darwish, “Online Quality Monitoring of Perforated Steel Strips Using an Automated Visual Inspection (AVI) System”, Proceedings of the 2011 IEEE ICQR, p 575-579.
[5] R. H. Day, "Visual spatial illusions: A general explanation, “Science, vol. 175, pp. 1335-1340, Mar. 1972.
[6] S. C. Wang, "Human reliability in visual inspection," Quality, Sept. 1974.
[7] J. R. Parks, "Intelligent machines-Commercial potential", Radio Electron. Eng., vol. 47, no. 8/9, pp. 355-367, 1977.
[8] T. Nicholson, R. Thomas, and W. D. Marbach, "Blue-collar robots," Newsweek, Apr. 23, 1979.
[9] I. Siena, K. Adi, R. Gernowo, and N. Mirnasari, “Development of Algorithm Tuberculosis Bacteria Identification Using Color Segmentation and Neural Networks,” Int. J. Video Image Process.
Netw. Secur. IJVIPNS-IJENS, vol. 12, no. 4, pp. 9–13, 2012.
[10] S. A. Daramola and M. A. Adefunminiyi, “Text content dependent writer identification,” pp. 45–49, 2016.
[11] Fangyan Nie, Member IAENG and Pingfeng Zhang “Fuzzy Partition and Correlation fo Image Segmentation with Differential Evolution,
IAENG International Journal of Computer Science, 2013.
[12] Che-Seung Cho, Byeong-Mook Chung, “Development of Real-Time Vision-Based Fabric Inspection System”, IEEE TRANSACTIONS ON INDUSTRIAL ELECTRONICS, VOL. 52, NO. 4, AUGUST 2005.
[13] E. Norouznezhad (2008), ”A HIGH RESOLUTION SMART CAMERA WITH GIGE VISION
[14] R. Siricharoenchai, W. Sinthupinyo, “Using Efficient Discriminative Algorithm in Automated Visual Inspection of Feed”, Communication Software and Networks (ICCSN), 2011 IEEE, p 95-99.
[15] T. Hastie, R. Tibshirani, and J. Friedman, The Elements of Statistical Learning: Data Mining, Inference and Prediction. Heidelberg, Germany: Springer Verlag, 2001.
[16] V. Kecman. Learning and Soft Computing. MIT Press, Cambridge, Massachusetts, London, England, 2001.
[17] W. He, K. Yuan, H. Xiao and Z. Xu, “A high speed robot vision system with GigE Vision Extension”, Proceedings of the 2011 IEEE International Conference on Mechatronics and Automation August 7 - 10, Beijing, China.
[18] W. Yao Rong, Dong He, “Rapid Detection Method for Fabric Defects Based on Machine Vision”, 2010 International Conference on Computer Application and System Modeling (ICCASM 2010), p 662-666.
[19] Chen Junhua, Lei Jing, Research on Color Image Classification Based on HSV Color Space, Second International Conference on Instrumentation & Measurement, Computer, Communication and Control, 2012.
[20] Narendra V G , Narendra V G ,Quality Inspection and Grading of Agricultural and Food Products by Computer Vision- A Review, International Journal of Computer Applications, May 2010. [21] Yousef Al Ohali, 2011, Computer vision based date fruit grading
system: Design and implementation, Journal of King Saud University – Computer and Information Science 23, 29–36.
[22] ZHANG Xueyi, et al. Development of Automatic Detection System for Medicine Packaging[J]. Packaging engineering, 2009, 30 (6): 47 ~ 50.
[image:5.595.46.287.272.394.2]