ISSN Online: 2162-2086 ISSN Print: 2162-2078
DOI: 10.4236/tel.2019.97151 Sep. 30, 2019 2371 Theoretical Economics Letters
Integrating the SRM and Lean Paradigms: The
Constructs and Measurements
Omar M. Bwaliez
1, Ismail Abushaikha
21Management Sciences Department, School of Management and Logistics Sciences, German Jordanian University, Amman, Jordan 2Logistics Sciences Department, School of Management and Logistics Sciences, German Jordanian University, Amman, Jordan
Abstract
Through integrating the supplier relationship management (SRM) and lean paradigms, this paper develops the concept of lean supplier relationship management (LSRM) and examines its relationship with firm performance (FP). The LSRM practices are identified and mapped into: supply flexibility, just-in-time delivery, information integration, and supplier partnership. The developed hypotheses are tested using a sample of 162 Jordanian manufac-turing firms. Results show that LSRM practices are positively and significant-ly correlated with each other, and they have a positive and significant rela-tionship with FP. This study contributes to literature by synthesizing SRM and lean constructs, and providing empirical evidence of the relationship between LSRM and FP. The study also contributes to literature through de-veloping an assessment tool for determining the level of adoption of the LSRM practices. Moreover, the study provides a sense of where Jordanian manufacturing firms are today on their journey in the field of LSRM, and provides practical implications for manufacturing firms involved in SRM in-itiatives.
Keywords
Supplier Relationship Management, Lean, Firm Performance, Supply Chain, Just-in-Time, Manufacturing Firms, Jordan
1. Introduction
Firms have long strived to improve performance through supply chain man-agement (SCM). Suppliers are increasingly becoming valuable resources for firms due to their large and direct impact on firm performance (FP) in terms of good quality, efficiency, responsiveness, and customer satisfaction [1] [2]. Sup-How to cite this paper: Bwaliez, O.M. and
Abushaikha, I. (2019) Integrating the SRM and Lean Paradigms: The Constructs and Measurements. Theoretical Economics Let-ters, 9, 2371-2396.
https://doi.org/10.4236/tel.2019.97151
Received: August 19, 2019 Accepted: September 27, 2019 Published: September 30, 2019
Copyright © 2019 by author(s) and Scientific Research Publishing Inc. This work is licensed under the Creative Commons Attribution International License (CC BY 4.0).
DOI: 10.4236/tel.2019.97151 2372 Theoretical Economics Letters plier relationship management (SRM) is one of the main paradigms that is ex-tensively discussed in SCM research area [3] [4] [5]. SRM can be defined as the collaboration between the firm and its suppliers to maintain the flow of needed materials, resources, parts, and information [6] [7].
Lean is a valuable paradigm that is applied by firms to survive [8] [9] [10]. The core principle of implementing lean is reducing waste through optimal utiliza-tion of firm’s resources [11]. SRM is one of the areas in which lean can be ap-plied [12] [13] [14]. However, literature still lacks understanding of how lean can be applied in the context of SRM. This paper develops the concept of lean sup-plier relationship management (LSRM) and examines its relationship with FP. We propose that if a firm wants to adopt LSRM paradigm, it should collabora-tively work with its suppliers to reduce cost and waste by pulling what is needed. This study develops an assessment tool to determine the level of adoption of the LSRM practices in Jordanian manufacturing firms, and provides a sense of where Jordanian manufacturing firms are today on their journey in the field of LSRM.
Jordanian firms have long been struggling in managing their supply chains due to several reasons. Firms in Jordan are liable to several risks leading to the disruption of the availability of materials and components and the wasting of significant resources [4]. This situation is because that Jordan has been affected negatively by the political instability in the Middle East, and closure of borders. Additionally, Jordan depends largely on import of merchandise from abroad due to the lack of manufacturing capabilities but also its limited natural resources. This means that there is higher complexity in the supply chain, and higher de-pendency is placed on achieving competitiveness through smoothing the flow of material and information [15]. Such a situation may affect the performance of Jordanian firms due to dissatisfied customers.
Therefore, understanding the effect of LSRM practices on each other and its influence on firms’ performance represents potential solutions to the aforemen-tioned problems facing Jordanian manufacturing firms. Moreover, due to insuf-ficiency and scarcity of knowledge, a thorough research is highly crucial and in-sistent in such area. The current study is one of the first studies that attempt to address this gap in the existing literature by addressing the following objectives: 1) integrating the SRM and lean paradigms and developing an assessment tool for measuring LSRM practices, and 2) examining the relationship between LSRM practices and FP. Taken together, this research utilizes the principles of SRM and the policies of lean to constitute a lean-based SRM construct for man-ufacturing firms in Jordan. This work will substantially enrich literature of SCM. The approach presented in this study can be used in order to improve the per-formance of manufacturing firms through adopting LSRM practices.
DOI: 10.4236/tel.2019.97151 2373 Theoretical Economics Letters
2. Literature Review
This section introduces the literature review on SRM and lean paradigms, and integrates the two paradigms into LSRM. This section also proposes the relevant hypotheses from literature and develops the theoretical model of the study.
2.1. SRM
SRM refers to the collaboration between the firm and its suppliers to maintain the flow of needed materials, resources, parts, and information for the purpose of producing goods or providing services efficiently and effectively [6] [7]. SRM plays a vital role in shaping the FP and involves managing all interactions with third party firms that supply goods or services to a firm in order to maximize the value of these interactions [1] [2]. In practice, SRM requires creating closer and more collaborative relationships with key suppliers in order to reveal and realize new value and reduce risk of failure [6].
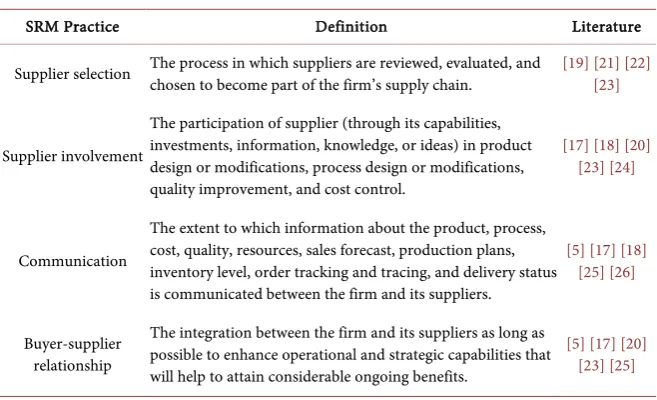
SRM involves a set of practices undertaken by a firm to boost effective SCM. According to [16] (p. 606), “the ultimate goal of supplier management practices is to achieve better performance in the supply chain”. [5] described the latest evolution of SRM practices, which include mainlining communication with ma-jor key suppliers, establishing long-term contracts, and pursuing joint invest-ments with suppliers. While, [17] identified four aspects of SRM, namely sharing information, developing collaborative approaches, joint decision making, and system coupling with key suppliers. [18] used many activities to represent SRM practices. These activities are sharing information with suppliers through a coordinated information system, working with key suppliers in product and process innovation, working with them for developing new technologies, and involving them in the implementation of firm’s logistics network. Additionally, [19] viewed SRM in terms of supplier selection, supplier development, and suppli-er psuppli-erformance review. Moreovsuppli-er, [20] represented SRM through supplisuppli-er base reduction, effective buyer-supplier relationship, communication, cross-functional teams, and supplier involvement. Consequently, the literature depicts SRM prac-tices from a variety of different perspectives with a common goal of ultimately improving FP. After reviewing and consolidating the literature, four distinctive practices were developed. They are supplier selection, supplier involvement, communication, and buyer-supplier relationship. Table 1 lists these practices along with their definitions and supporting literature.
2.2. Lean and SRM
DOI: 10.4236/tel.2019.97151 2374 Theoretical Economics Letters Table 1. SRM practices with their definition and appearance in literature.
SRM Practice Definition Literature
Supplier selection The process in which suppliers are reviewed, evaluated, and chosen to become part of the firm’s supply chain. [19] [21] [22] [23]
Supplier involvement
The participation of supplier (through its capabilities, investments, information, knowledge, or ideas) in product design or modifications, process design or modifications, quality improvement, and cost control.
[17] [18] [20] [23] [24]
Communication
The extent to which information about the product, process, cost, quality, resources, sales forecast, production plans, inventory level, order tracking and tracing, and delivery status is communicated between the firm and its suppliers.
[5] [17] [18] [25] [26]
Buyer-supplier relationship
The integration between the firm and its suppliers as long as possible to enhance operational and strategic capabilities that will help to attain considerable ongoing benefits.
[5][17][20]
[23][25]
being applied widely in service sector [9] [29] [30]. Thus, lean can be applied in every business and every process. It is not only a tactic or a cost reduction pro-gram, but also a way of thinking and acting for an entire firm [11] [27].
Regardless of establishing what lean is, it remains important to establish how to become lean. This can be achieved by a set of synergistic managerial practices called lean practices. These practices include but are not limited to SRM, conti-nuous improvement, just-in-time (JIT), total quality management (TQM), work teams, employee involvement, and cellular manufacturing. Many scholarly works (e.g., [10] [11] [31] [32] [33] [34]) offered a presentation of the most fre-quently identified lean practices in literature. Other works (e.g., [8] [10] [11] [28] [35] [36]) supported the positive impact of these lean practices on FP. On the other hand, a considerable stream of literature (e.g., [9] [13] [30]) has fo-cused on synthesizing lean with other management practices.
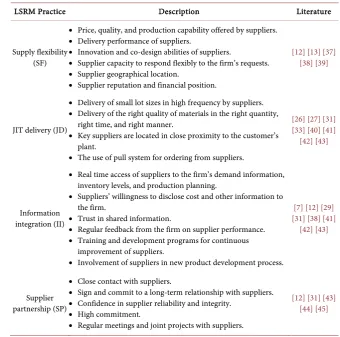
DOI: 10.4236/tel.2019.97151 2375 Theoretical Economics Letters Table 2. The considered LSRM practices with their description and appearance in litera-ture.
LSRM Practice Description Literature
Supply flexibility (SF)
• Price, quality, and production capability offered by suppliers. • Delivery performance of suppliers.
• Innovation and co-design abilities of suppliers.
• Supplier capacity to respond flexibly to the firm’s requests. • Supplier geographical location.
• Supplier reputation and financial position.
[12] [13] [37] [38] [39]
JIT delivery (JD)
• Delivery of small lot sizes in high frequency by suppliers. • Delivery of the right quality of materials in the right quantity,
right time, and right manner.
• Key suppliers are located in close proximity to the customer’s plant.
• The use of pull system for ordering from suppliers.
[26] [27] [31] [33] [40] [41] [42] [43]
Information integration (II)
• Real time access of suppliers to the firm’s demand information, inventory levels, and production planning.
• Suppliers’ willingness to disclose cost and other information to the firm.
• Trust in shared information.
• Regular feedback from the firm on supplier performance. • Training and development programs for continuous
improvement of suppliers.
• Involvement of suppliers in new product development process.
[7] [12] [29] [31] [38] [41]
[42] [43]
Supplier partnership (SP)
• Close contact with suppliers.
• Sign and commit to a long-term relationship with suppliers. • Confidence in supplier reliability and integrity.
• High commitment.
• Regular meetings and joint projects with suppliers.
[12] [31] [43] [44] [45]
2.3. FP
FP is a set of managerial and critical methodologies that allow firm managers to attain one or more pre-selected goals [21]. Until now, there is neither consensus nor agreement among scholars and practitioners about the definition of FP and its elements [21] [30] [46]. Thus, there are several definitions and indicators used to measure it [6] [21] [30] [47] [48].
2.4. Hypotheses Development
The relationships between the considered LSRM practices and their influence on FP are presented in the following subsections.
2.4.1. The Role of SF
ef-DOI: 10.4236/tel.2019.97151 2376 Theoretical Economics Letters fect on FP [1] [2]. [50] confirmed that selecting quality suppliers having SF ca-pabilities improves FP. Moreover, SF is a key approach to improve FP by making sure suppliers are capable and committed to fulfilling manufacturer’s current and future expectations [38]. Selecting the right suppliers having SF not only brings radical benefits to firms but also improves customer satisfaction [51]. Hence, the following hypotheses are developed:
H1: SF practice has a positive relationship with JD practice. H2: SF practice has a positive relationship with SP practice. H3: SF practice has a positive relationship with FP.
2.4.2. The Role of JD
Meeting the requirements of delivery time is one of the important factors to be considered for SF [15]. Moreover, delivery is one of the most used criteria in evaluating and selecting the suitable logistics service providers [52]. In addition, [53] provided evidence that JD performance plays a critical role in the SF deci-sion. According to [37], it becomes a necessity to select a suitable supplier with JD to achieve SF. JD, on the other hand, facilitates good relationship between the firm and its suppliers [54]. JD also involves mutual and trusted long-term rela-tionship with suppliers [55]. According to [56], it is important to encourage suppliers and customers to develop JD in order to enhance SP. JD is crucial for all industries to gain global competitiveness [57]. JD also improves quality to achieve operational excellence [58]. According to [59], JD has strong effect on logistics performance in supply chains. Consequently, the following hypotheses should be tested:
H4: JD practice has a positive relationship with SF practice. H5: JD practice has a positive relationship with SP practice. H6: JD practice has a positive relationship with FP.
2.4.3. The Role of II
II through sharing timely and sensitive information between firms and their suppliers improves SF [40]. Integrated inter-organizational communication brings closer relationship among the supply chain members in the field of II which promotes a comforting level of SP [60]. Employing II systems in supply chains might be an effective lean approach to enhance SP through managing in-formation and communication on a real-time basis. II can lead to a faster and more efficient process to correct quality problems when they occur [43]. [61] argued that II systems help to achieve enhanced FP. [62] found that many sup-plier product problems were due to poor II. In addition, II between buyer and supplier is very crucial in SP through involvement in putting the fundamental design of product, its development process, and logistical decisions [6] [51]. II also provides the needed collaboration, which in turn leads to improved FP [63]. Moreover, II increases the competitive advantage of the supply chain [64]. Ac-cordingly, the following hypotheses are proposed:
DOI: 10.4236/tel.2019.97151 2377 Theoretical Economics Letters H8: II practice has a positive relationship with SP practice.
H9: II practice has a positive relationship with FP.
2.4.4. The Role of SP
Closeness of relationship between buyer and supplier is one of the criteria used to determine SF of the best alternative supplier [6] [65]. SP between a buying firm and its suppliers helps to upgrade supplier’s capabilities in delivery [66]. Cooperative SP between firms and their suppliers facilitate the achievement of JD [67]. According to [68], SP helps to improve II through knowledge transfer from the buyer to the supplier. Likewise, a close SP among the supply chain members helps to share information [21]. As a result, SP can reinforce II [69]. [65] found that SP contributes to FP. It is widely accepted that effective SP en-hances business competitiveness, profitability, and the ability of a firm to pro-duce quality products [1]. Firms that embrace SP reported substantial revenue gains and cost savings. Moreover, a well-developed SP has an everlasting and positive effect on the competitiveness of the entire supply chain [70]. Thus, firms are increasingly looking forward to build close SP in order to achieve a stronger competitive position [6]. [49] found that a good SP leads to competitive advan-tage followed by profitability. Customer’s needs can be met by implementing a cooperative SP [21]. Moreover, higher profitability can also be achieved through
SP [6] [15] [51]. [64] revealed that SP improves FP. Accordingly, the following
hypotheses can be proposed:
H10: SP practice has a positive relationship with SF practice. H11: SP practice has a positive relationship with JD practice. H12: SP practice has a positive relationship with II practice. H13: SP practice has a positive relationship with FP.
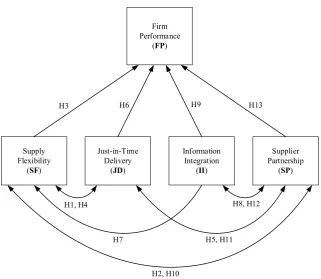
2.5. The Research Model
In order to explore the association between LSRM practices and FP, a proposed research model that combines all of the aforementioned hypotheses is devel-oped. This model, shown in Figure 1, represents a structural equation model (SEM) that needs to be studied. LSRM practices and FP constitute the construct latent variables of this model.
DOI: 10.4236/tel.2019.97151 2378 Theoretical Economics Letters Figure 1. The research model.
and FP (e.g., [6] [17] [26] [71]), this study looks more closely at the SRM, which is part of supply chain integration. In examining FP, some researchers focus on either financial performance (e.g., [3] [72]) or non-financial performance of the firm (e.g., [4] [17] [24] [71]). This study takes both of them into account [73]. Consequently, this study presents the first research model that illustrates the ef-fect of LSRM practices on each other and explains their efef-fect on FP.
3. Methodology
This scholarly work is a cross-sectional study. It aims to study the effect of LSRM on FP of Jordanian manufacturing firms by collecting data through a question-naire. The research instrument, population, and sample are presented in the next subsections.
3.1. Research Instrument
Based on the literature review, relevant questionnaire items were drafted in or-der to measure the construct latent variables of the research model. To improve the understanding of its content, the resulting draft was reviewed by five aca-demic professors in the field of logistics and SCM at the German Jordanian University, and seven executive managers from different manufacturing firms. Then, some modifications were made according to their notes and recommen-dations. The items were ensured to be written in such a way that reduces the li-kelihood of misunderstanding the overall practice by the respondent. Thereafter, the finalized version of the questionnaire was valid to be used.
Firm Performance
(FP)
Supply Flexibility
(SF)
Just-in-Time Delivery
(JD)
Information Integration
(II)
Supplier Partnership
(SP)
H1, H4 H8, H12
H3 H6 H9 H13
H2, H10
DOI: 10.4236/tel.2019.97151 2379 Theoretical Economics Letters In its final form, the questionnaire comprised two main sections; the first sec-tion included quessec-tions about the firms’ type and size, while the second secsec-tion of the questionnaire contained 50 follow-on accurate and specific items about the implementation level of each LSRM practice and FP. The respondents were asked to evaluate each item using five-point Likert scale anchored from 1 = not adopted to 5 = fully adopted, and centered at 3 = partially adopted. The next subsections present the construct latent variables of the model and how they were measured in the questionnaire with supporting references.
3.1.1. SF Construct
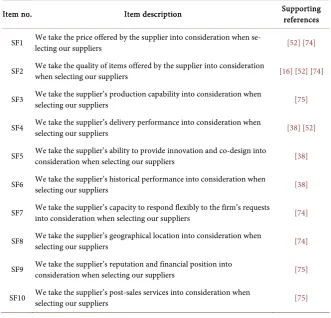
SF practice was measured through the criteria on which the supplier is selected. This criterion includes supplier’s price, product quality, production capability, flexibility, historical performance, delivery performance, closeness to the firm, reputation, financial position, and post-sales services [16] [38] [52] [74] [75]. Table 3 shows these measures.
3.1.2. JD Construct
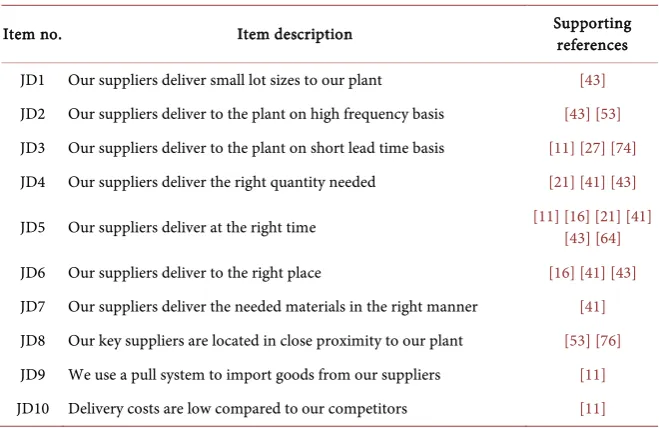
[image:9.595.208.540.411.729.2]Measurement items adopted by many scholarly works (e.g., [11] [21] [27] [41] [43] [53] [64] [74] [76]) were used in this study to measure JD practice. These items assessed the extent to which the firm’s suppliers can deliver goods in small lot sizes, on high frequency, and small lead time basis as shown in Table 4.
Table 3. Questionnaire items of SF construct.
Item no. Item description Supporting references
SF1 We take the price offered by the supplier into consideration when se-lecting our suppliers [52] [74]
SF2 We take the quality of items offered by the supplier into consideration when selecting our suppliers [16] [52] [74]
SF3 We take the supplier’s production capability into consideration when selecting our suppliers [75]
SF4 We take the supplier’s delivery performance into consideration when selecting our suppliers [38] [52]
SF5 We take the supplier’s ability to provide innovation and co-design into consideration when selecting our suppliers [38]
SF6 We take the supplier’s historical performance into consideration when selecting our suppliers [38]
SF7 We take the supplier’s capacity to respond flexibly to the firm’s requests into consideration when selecting our suppliers [74]
SF8 We take the supplier’s geographical location into consideration when selecting our suppliers [74]
SF9 We take the supplier’s reputation and financial position into consideration when selecting our suppliers [75]
DOI: 10.4236/tel.2019.97151 2380 Theoretical Economics Letters Table 4. Questionnaire items of JD construct.
Item no. Item description Supporting references
JD1 Our suppliers deliver small lot sizes to our plant [43] JD2 Our suppliers deliver to the plant on high frequency basis [43] [53] JD3 Our suppliers deliver to the plant on short lead time basis [11] [27] [74] JD4 Our suppliers deliver the right quantity needed [21] [41] [43]
JD5 Our suppliers deliver at the right time [11] [16] [21] [41] [43] [64]
JD6 Our suppliers deliver to the right place [16] [41] [43] JD7 Our suppliers deliver the needed materials in the right manner [41] JD8 Our key suppliers are located in close proximity to our plant [53] [76] JD9 We use a pull system to import goods from our suppliers [11] JD10 Delivery costs are low compared to our competitors [11]
3.1.3. II Construct
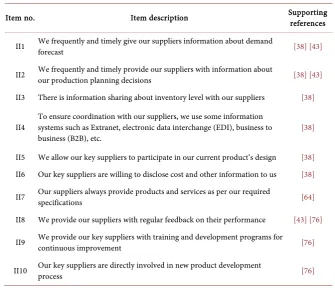
Many scholars (e.g., [38] [43] [64] [76]) presented many examples of measure-ment items can be used to examine II, which include evaluating the extent of firm’s ability to provide its suppliers with information about production plan-ning, inventory level, demand forecast, and regular feedback on their perfor-mance. These items are shown in Table 5.
3.1.4. SP Construct
Some examples of items that were used to measure SP includes long-term con-tracts, supplier’s reliability and integrity, and active steps taken by the firm to reduce the number of short-term suppliers. These items were adopted from [15] [23] [43] [51] [76] [77] [78]. Table 6 shows all of these items.
3.1.5. FP Construct
Due to its multidimensionality, academic scholars confronted many difficulties to build appropriate and measurable FP constructs [46]. Although, subjective and objective measures of FP are provided in literature [47] [48], subjective measures are more preferable by business management researchers (e.g., [5] [21] [26]). In line with these researchers, a set of subjective measures were used in this study. In literature, FP was assessed by the product quality, market share growth, customer satisfaction, employee satisfaction, firm reputation, and the competitive position of the firm compared to competitors [21] [22] [73]. Table 7 shows the items used to measure FP.
3.2. Research Population and Sample
DOI: 10.4236/tel.2019.97151 2381 Theoretical Economics Letters Table 5. Questionnaire items of II construct.
Item no. Item description Supporting references
II1 We frequently and timely give our suppliers information about demand forecast [38] [43]
II2 We frequently and timely provide our suppliers with information about our production planning decisions [38] [43]
II3 There is information sharing about inventory level with our suppliers [38]
II4 To ensure coordination with our suppliers, we use some information systems such as Extranet, electronic data interchange (EDI), business to
business (B2B), etc. [38]
II5 We allow our key suppliers to participate in our current product’s design [38] II6 Our key suppliers are willing to disclose cost and other information to us [38]
II7 Our suppliers always provide products and services as per our required specifications [64]
II8 We provide our suppliers with regular feedback on their performance [43] [76]
II9 We provide our key suppliers with training and development programs for continuous improvement [76]
[image:11.595.205.540.398.629.2]II10 Our key suppliers are directly involved in new product development process [76]
Table 6. Questionnaire items of SP construct.
Item no. Item description Supporting references
SP1 We strive to establish long-term cooperative relationships with our suppliers [43] SP2 We frequently are in close contact with our suppliers [43] SP3 We sign a long-term contract (e.g., more than 3 years) with our suppliers [51] SP4 We have a confidence that our suppliers are reliable and have integrity [15]
SP5 We take active steps to reduce the number of trivial many suppliers in each category [76]
SP6 Our suppliers are very committed [51] [77]
SP7 There is an excellent understanding between suppliers and our firm [78] SP8 Our firm meets frequently with key suppliers to discuss supply chain issues [23]
SP9 We know our key suppliers and try to build deep connections with their managers and decision makers [51]
SP10 Our key suppliers are loyal to our firm [51]
Table 7. Questionnaire items of FP construct.
Item no. Item description Supporting references
DOI: 10.4236/tel.2019.97151 2382 Theoretical Economics Letters
Continued
FP3 The revenue growth rate of our firm has exceeded the competitors [30] FP4 The market share growth of our firm has exceeded the competitors [30] [73] [79] FP5 The productivity of our firm has exceeded the competitors [79]
FP6 The customers are satisfied with our products’ quality compared to competitors [21] [30]
FP7 The customers are satisfied with our firm’s delivery lead-time compared to competitors [21] [30] [50]
FP8 The overall competitive position of our firm is better than that of competitors [21] [30] [63] FP9 The overall growth of our firm is better than that of competitors [79] FP10 The employee satisfaction level of our firm is better than that of competitors [21] [63]
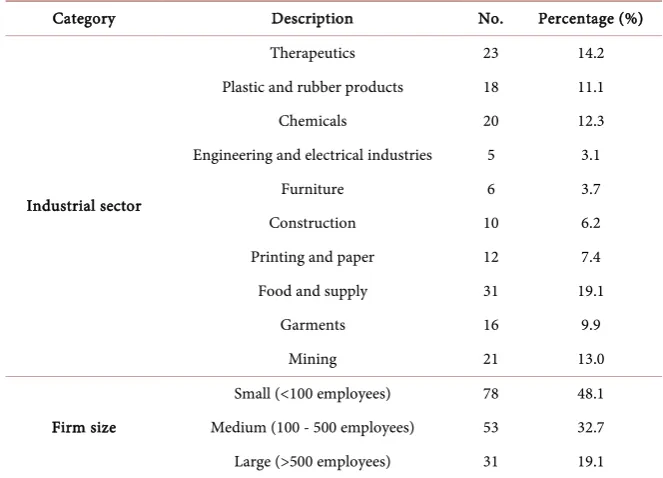
Amman and they are classified into 10 industrial sectors, namely therapeutics, plastic and rubber products, chemicals, engineering and electrical industries, furniture, construction, printing and paper, food and supply, garments, and mining. As recommended by [81], the sample size that is suitable for this popu-lation is 292. Our questionnaire was sent to 300 Jordanian manufacturers who were willing to participate in this study, after being contacted by email and phone. The selected sample was taken from all the typical industrial classifica-tions distinguished by [80] to ensure a full representation of manufacturing sec-tor in Jordan [9]. At the end, a total of 162 valid responses were received, mak-ing a response rate of 54%. This percentage goes in line with several other stu-dies that were conducted within the area of lean management and used a similar distribution methodology (e.g. [9] [30] [82]). Moreover, the authors of this study administrated and aggressively followed up the questionnaire distribution process themselves. Their involvement contributed to the delivery of the ques-tionnaire to as many respondents as possible and helped in clarifying any ambi-guity concerning the definitions or any other issues related to the questionnaire. The characteristics of the selected sample are shown in Table 8.
Managers in the top or middle levels who have a direct contact with suppliers and those with responsibilities related to SCM activities were asked to participate in the questionnaire. Hence, respondents included general managers, supply chain managers, operations managers, plant managers, purchasing managers, and others. It is worth mentioning that a pretest pilot study was conducted be-fore distributing the questionnaire to the targeted firms in order to test the ques-tionnaire items for their clarity, comprehensiveness, and acceptability. As sug-gested by [83], a random sample of 25 firms was selected for this pilot study. Eighteen responses with a response rate of 72% were received. The received res-ponses were carefully studied and analyzed, and the required adjustments were made.
4. Results and Discussions
DOI: 10.4236/tel.2019.97151 2383 Theoretical Economics Letters Table 8. Sample composition (n = 162 firms).
Category Description No. Percentage (%)
Industrial sector
Therapeutics 23 14.2
Plastic and rubber products 18 11.1
Chemicals 20 12.3
Engineering and electrical industries 5 3.1
Furniture 6 3.7
Construction 10 6.2
Printing and paper 12 7.4
Food and supply 31 19.1
Garments 16 9.9
Mining 21 13.0
Firm size
Small (<100 employees) 78 48.1
Medium (100 - 500 employees) 53 32.7
Large (>500 employees) 31 19.1
social sciences (SPSS), namely IBM SPSS Statistics and IBM SPSS Amos. It com-prised multicollinearity, validity and reliability, model fitness, descriptive analy-sis, hypotheses testing, and analysis of variance (ANOVA). These analyses are presented in the next subsections.
4.1. Multicollinearity
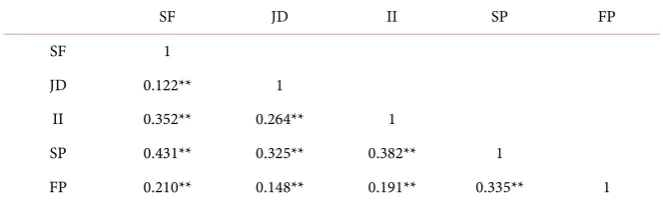
Multicollinearity of the dataset is measured by the coefficient of correlation. Ac-cording to [84], multicollinearity indicates the degree by which questionnaire items measure the same entity. The coefficient of correlation ranges from −1 to 1, and a value of 0.9 or above for the inter-item correlations indicates the possi-bility that two or more items measure the same entity. Zero correlation means that there is no relation between the items. Table 9 shows the correlation matrix for all construct latent variables of the research model. It is worth mentioning that the correlation analysis was conducted between the mean of answers for each construct latent variable. Since there is no value above the threshold of 0.9, it is confirmed that there are no multicollinearity type problems in our model.
4.2. Validity and Reliability
DOI: 10.4236/tel.2019.97151 2384 Theoretical Economics Letters Table 9. Correlation matrix of the construct latent variables.
SF JD II SP FP
SF 1
JD 0.122** 1
II 0.352** 0.264** 1
SP 0.431** 0.325** 0.382** 1
FP 0.210** 0.148** 0.191** 0.335** 1
**Correlation is significant at the 0.01 level (two-tailed).
Reliability includes internal consistency of the construct latent variables [9]. It is measured using the Cronbach’s alpha (α) coefficient, which gives a reflection of the degree to which different items complement each other and measure the same overall concept [85]. The closer Cronbach’s α coefficient to 1.0, the greater internal consistency of the items in the questionnaire [85] [87]. Although values above 0.7 are often considered to be acceptable [86] [87], a Cronbach’s α value of 0.8 is mainly the target [87]. A value of 0.6 or less indicates unsatisfactory con-sistency reliability [84]. Table 10 shows that Cronbach’s α values for all con-struct latent variables and the overall LSRM practices are more than 0.7. Conse-quently, research instrument reliability was also assumed.
4.3. Model Fitness
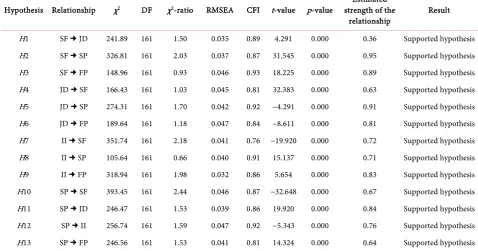
Model fitness refers to the degree to which the SEM matches the observed data. For the purpose of this study, we used Chi-square (χ2) test, relative chi-square ratio (χ2-ratio), root mean square error of approximation (RMSEA), compara-tive fit index (CFI), and t-test to measure the model fitness.
While, a high value of χ2 means that there is a poor fit between the observed and expected frequencies, a small value of χ2 indicates a good model fitness. Due to the effect of sample size, Chi-square test is not always a clear assessment tool of the model fitness. Thus, various kinds of fitness indices that are independent of the sample size have been developed. According to [88], the χ2-ratio is com-puted through dividing the χ2 value by the corresponding degrees of freedom (DF). If the value of χ2-ratio is less than 5, the proposed model will be accepted [88]. Table 11 shows that the χ2-ratio for all hypotheses is less than 5, which means that the proposed model can be accepted.
RMSEA can also be used to measure the model fitness. RMSEA value of 0.05 or less means that there is a close fitness of the model in relation to the DF, and the models with RMSEA value of 0.10 or more have poor fitness [87]. Table 11 shows that all RMSEA values of the proposed model are less than 0.05. Thus, the results of RMSEA test support our model fitness.
DOI: 10.4236/tel.2019.97151 2385 Theoretical Economics Letters Table 10. Cronbach’s α value of the construct latent variables.
Construct latent variable Cronbach’s α value
SF 0.81
JD 0.83
II 0.78
SP 0.79
FP 0.83
Overall LSRM practices 0.80
Table 11. Fitness of the developed SEM.
Hypothesis Relationship χ2 DF χ2-ratio RMSEA CFI t-value p-value strength of the Estimated
relationship Result
H1 SF JD 241.89 161 1.50 0.035 0.89 4.291 0.000 0.36 Supported hypothesis
H2 SF SP 326.81 161 2.03 0.037 0.87 31.545 0.000 0.95 Supported hypothesis
H3 SF FP 148.96 161 0.93 0.046 0.93 18.225 0.000 0.89 Supported hypothesis
H4 JD SF 166.43 161 1.03 0.045 0.81 32.383 0.000 0.63 Supported hypothesis
H5 JD SP 274.31 161 1.70 0.042 0.92 −4.291 0.000 0.91 Supported hypothesis
H6 JD FP 189.64 161 1.18 0.047 0.84 −8.611 0.000 0.81 Supported hypothesis
H7 II SF 351.74 161 2.18 0.041 0.76 −19.920 0.000 0.72 Supported hypothesis
H8 II SP 105.64 161 0.66 0.040 0.91 15.137 0.000 0.71 Supported hypothesis
H9 II FP 318.94 161 1.98 0.032 0.86 5.654 0.000 0.83 Supported hypothesis
H10 SP SF 393.45 161 2.44 0.046 0.87 −32.648 0.000 0.67 Supported hypothesis H11 SP JD 246.47 161 1.53 0.039 0.86 19.920 0.000 0.84 Supported hypothesis H12 SP II 256.74 161 1.59 0.047 0.92 −5.343 0.000 0.76 Supported hypothesis H13 SP FP 246.56 161 1.53 0.041 0.81 14.324 0.000 0.64 Supported hypothesis
is derived from comparing the hypothesized model with the independent model, and it provides a measure of the complete co-variation [90]. Table 11 shows that all CFI values are very close to 0.9, which means that our proposed model has good fitness.
The t-test was used to measure the statistical significance of the relationship between SEM variables at a specific level of significance (α = 0.01). In this test, the t-value computed by a specific equation or using a statistical software (re-ferred to as t0) is compared with the value of t indicated in the t-distribution ta-ble (referred to as tα,DF in one-tailed test and tα/2,DF in two-tailed test) [87] [91]. In our two-tailed test, if |t0| > tα/2,DF, this indicates that there is a significant rela-tionship between the two variables [91]. Since the absolute value of all t-values presented in Table 11 exceeds the values indicated in the t-distribution table, all developed hypotheses are supported.
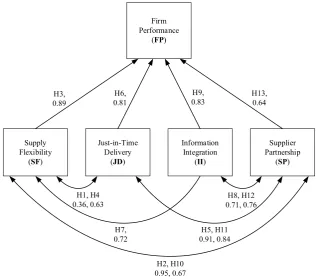
[image:15.595.59.538.248.499.2]rela-DOI: 10.4236/tel.2019.97151 2386 Theoretical Economics Letters tionship between all construct latent variables are presented in Table 11 and shown in Figure 2. Improving or harming any one of the four LSRM practices will affect each other, and will have an impact on FP according to the estimated strength of each relationship among them. This implies that none of them should be ignored or given less attention. It is clear that SF practice has the highest impact on FP with a regression weight of 0.89, followed by II practice with a regression weight of 0.83, then JD with a regression weight of 0.81, and SP practice has the lowest impact on FP with a regression weight of 0.64.
4.4. Descriptive Analysis
Table 12 shows a descriptive analysis comprises finding the mean (x), variance
(S2), and implementation index for each construct latent variable. It also shows that the selected sample of Jordanian manufacturing firms implements the con-sidered LSRM practices by 50.58%. The highest implementation level is in SF practice with a percentage of 65.11%, while the lowest implementation level is in JD practice with a percentage of 32.31%.
[image:16.595.212.534.430.709.2]Figure 3 draws the relationship between the impacts of LSRM practices on FP using the estimated strength of the relationships listed in Table 11 versus the implementation index of these practices listed in Table 12. The horizontal dashed line represents the average of the implementation index values of the overall LSRM practices, which is 50.58%, and the vertical dashed line represents the average impact of these practices on FP, which is 0.79. These two dashed lines divide the diagram in terms of impact on FP (either high or low) and
Figure 2. Estimated strengths of the SEM relationships.
Firm Performance
(FP)
Supply Flexibility
(SF)
Just-in-Time Delivery
(JD)
Information Integration
(II)
Supplier Partnership
(SP)
H1, H4
0.36, 0.63 0.71, 0.76H8, H12
H3,
0.89 0.81H6, 0.83H9, H13,0.64
H2, H10 0.95, 0.67
H5, H11 0.91, 0.84 H7,
DOI: 10.4236/tel.2019.97151 2387 Theoretical Economics Letters Figure 3. Impact of LSRM practices on FP versus their implementation index.
Table 12. Descriptive analysis of the construct latent variables.
Construct latent variable Mean (x) Variance (S2) Implementation index
SF 3.26 0.67 65.11%
JD 1.62 0.54 32.31%
II 2.08 0.77 41.62%
SP 3.16 0.97 63.27%
FP 3.31 0.58 66.21%
Overall LSRM practices 2.53 0.74 50.58%
implementation index (either high or low) into four quarters: high impact on FP—high implementation level, low impact on FP—high implementation level, low impact on FP—low implementation level, and high impact on FP—low im-plementation level.
From the classification shown in Figure 3, it can be concluded that the great-est opportunity for improving Jordanian firms’ performance should be focused on aspects related to JD and II practices due to their high impact on FP and low implementation level by Jordanian manufacturing firms. However, SF practice should not have high priority by Jordanian manufacturing firms because its im-plementation level is the highest among other practices (i.e., 65.11%). In addi-tion, Due to the fact that Jordanian firms maintain good relationships and deep connections with their suppliers [15], SP practice has the second highest imple-mentation index (i.e., 63.27%) after SF practice. SP practice should have the lowest priority by Jordanian manufacturing firms because its estimated impact on FP is the lowest among other practices (i.e., 0.64).
4.5. Hypotheses Testing and ANOVA
Although t-test can be used for hypotheses testing, measuring the p-value for each relationship can also be used to test hypotheses. If p-value is less than α
SF
JD II SP
20 30 40 50 60 70 80 90 100
0.5 0.55 0.6 0.65 0.7 0.75 0.8 0.85 0.9 0.95 1
Im
ple
m
en
ta
tio
n
le
ve
l (
%
)
DOI: 10.4236/tel.2019.97151 2388 Theoretical Economics Letters then there is a significant relationship between the studied variables [91]. At the 0.01 level of significance, Table 11 shows that p-value for each relationship is less than α. This leads to the same results of the t-test that support all of the de-veloped hypotheses.
ANOVA is one of the popular techniques of hypotheses testing [87]. It is a method of decomposing the total variability in a set of observations, as measured by the sum of the squares of these observations from their average, into compo-nent sums of squares that are associated with specific defined sources of varia-tion [91]. Table 13 shows a two-tailed one way ANOVA test of the developed model at the 0.01 level of significance. It is clear that f0-values exceed the value of f0.005,v1,v2 for each LSRM practice. This means that all LSRM practices have posi-tive and significant relationships with FP.
[image:18.595.58.541.501.733.2]The findings of the study at hand corroborate with previous studies on the positive and significant impact of the ordinary SRM practices on FP (e.g., [1] [3] [6] [18] [49] [64]). The study findings are also consistent with previous studies that explored the role of adopting SRM practices in lean settings and contexts (e.g., [38] [53]). Moreover, our findings go in line with the previous results of several national (e.g., [79] [92]) and international studies (e.g., [8] [28] [35] [36]) that revealed a positive and significant relationship between lean practices and FP. Taken together, the general assumption in literature is that either lean prac-tices affect FP or SRM pracprac-tices affect FP, without investigating the effect of both of them combined on FP. This study improves our understanding of how inte-grating both SRM and lean paradigms could be translated into improved FP. Consequently, the finding that LSRM practices have a positive and significant relationship with FP is an important contribution to the logistics and SCM lite-rature.
Table 13. One-way ANOVA test of the developed SEM.
LSRM Practice Source of Variation Sum of Squares DF Mean Square f0 ν1 ν2 p-value Result
SF
Between Groups 40.401 9 2.886
2.329 9 1610 0.000 relationship with SF has a positive FP
Within Groups 4385.696 1610 1.239
Total 4426.097 1619 -
JD
Between Groups 31.404 9 2.243
2.503 9 1610 0.000 relationship with JD has a positive FP
Within Groups 3172.616 1610 0.896
Total 3217.02 1619 -
II
Between Groups 91.278 9 6.520
4.181 9 1610 0.000 relationship with II has a positive FP
Within Groups 5520.650 1610 1.560
Total 5611.928 1619 -
SP
Between Groups 63.232 9 4.517
3.857 9 1610 0.000 relationship with SP has a positive FP
Within Groups 4144.439 1610 1.171
DOI: 10.4236/tel.2019.97151 2389 Theoretical Economics Letters
5. Conclusions
The necessity for efficient buyer-supplier relationship has made supplier analysis one of the firm’s most important processes. This study was motivated by a desire to explore the relationship between adopting LSRM practices and their effect on FP. It utilizes the principles of SRM and the policies of lean to constitute a lean-based SRM system. In LSRM, the focal firm collaboratively works with its suppliers to reduce cost and waste by pulling what is needed. Thus, LSRM can be achieved through a set of practices that are focusing on eliminating waste by re-ducing inventory and improving quality in the supply chain. Based on literature review, this study considered SF, JD, II, and SP as the main LSRM practices. In brief, the current study is one of the first studies to address the following two objectives: 1) integrating the SRM and lean paradigms and developing an as-sessment tool for measuring LSRM practices, and 2) examining the relationship between LSRM practices and FP.
The findings show that the selected sample of Jordanian manufacturing firms implements the considered LSRM practices by 50.58%. The highest tion level is in SF practice, followed by SP, then II, and the lowest implementa-tion level is in JD practice. Regarding the effects of practices on each other, the results provide strong evidence that the considered LSRM practices affect each other positively and significantly, and they have a positive and significant effect on the performance of Jordanian manufacturing firms. Improving or harming any one of the four LSRM practices will affect each other and will have an im-pact on FP according to the standardized regression weights among them. This implies that none of them should be ignored or given less attention. SF practice has the highest impact on FP, followed by II practice, then JD, and SP practice has the lowest impact on FP.
The greatest opportunity for improving Jordanian firms’ performance should be focused on aspects related to JD and II practices due to their high impact on FP and low implementation level. JD practice can be enhanced in Jordanian manufacturing firms through asking suppliers to deliver needed parts in small lot sizes on high frequency basis (i.e., small lead times). On the other hand, to improve II practice, Jordanian manufacturing firms should frequently and time-ly provide their suppliers with information about demand forecast, production planning decisions, and inventory level. They are also recommended to use in-formation systems such as Extranet, electronic data interchange (EDI), and business to business (B2B) to ensure more information transfer and exchange. Moreover, Jordanian manufacturing firms should provide their suppliers with regular feedback about their performance and training and development pro-grams for continuous improvement. Suppliers should also be directly involved in new product development processes.
per-DOI: 10.4236/tel.2019.97151 2390 Theoretical Economics Letters formance, efficiency, and productivity. Firms, regardless of their business type, have to consider lean in their daily operations because it can improve their over-all performance.
6. Limitations and Directions for Future Research
Though this study attained some important findings and insights related to in-tegrating SRM and lean paradigms, it has limitations that can be addressed in future studies. Our data were obtained from a sample of 162 Jordanian manu-facturing firms representing 10 industrial sectors. However, the restriction of the data collection to a single country limits the generalization of the results. In or-der to generalize the results, this study can be applied in additional countries other than Jordan; it also can be done with larger samples. The assessment tool developed in this study can also be used by future researchers interested in the area of LSRM who could conclude corroborating or conflicting results.
This study is restricted only in one impact area of lean, which is SRM area. In order to build upon this study, future researchers are recommended to measure the implementation level of the other lean impact areas, such as warehouse management, transportation management, new product development, human resource management, and customer relationship management.
Conflicts of Interest
The authors declare no conflicts of interest regarding the publication of this pa-per.
References
[1] Ndubisi, N.O., Jantan, M., Hing, L.C. and Ayub, M.S. (2005) Supplier Selection and Management Strategies and Manufacturing Flexibility. The Journal of Enterprise Information Management, 18, 330-349. https://doi.org/10.1108/17410390510592003
[2] Foerstl, K., Franke, H. and Zimmermann, F. (2016) Mediation Effects in the ‘Pur-chasing and Supply Management (PSM) Practice-Performance Link’: Findings from a Meta-Analytical Structural Equation Model. Journal of Purchasing & Supply Management, 22, 351-366. https://doi.org/10.1016/j.pursup.2016.08.001
[3] Lambert, D.M. and Schwieterman, M.A. (2012) Supplier Relationship Management as a Macro Business Process. Supply Chain Management:An International Journal, 17, 337-352. https://doi.org/10.1108/13598541211227153
[4] Abdallah, A.B., Abdullah, M.I. and Saleh, F.I.M. (2017) The Effect of Trust with Suppliers on Hospital Supply Chain Performance: The Mediating Role of Supplier Integration. Benchmarking: An International Journal, 24, 694-715.
https://doi.org/10.1108/BIJ-05-2016-0062
[5] Amoako-Gyampah, K., Boakye, K.G., Adaku, E. and Famiyeh, S. (2019) Supplier Relationship Management and Firm Performance in Developing Economies: A Moderated Mediation Analysis of Flexibility Capability and Ownership Structure.
International Journal of Production Economics, 208, 160-170.
https://doi.org/10.1016/j.ijpe.2018.11.021
DOI: 10.4236/tel.2019.97151 2391 Theoretical Economics Letters
Performance: A Contingency and Configuration Approach. Journal of Operations Management, 28, 58-71. https://doi.org/10.1016/j.jom.2009.06.001
[7] Huang, M.C., Yen, G.F. and Liu, T.C. (2014) Reexamining Supply Chain Integration and the Supplier’s Performance Relationships under Uncertainty. Supply Chain Management: An International Journal, 19, 64-78.
https://doi.org/10.1108/SCM-04-2013-0114
[8] Nawanir, G., Kong Teong, L. and Othman, S.N. (2013) Impact of Lean Practices on Operations Performance and Business Performance: Some Evidence from Indone-sian Manufacturing Companies. Journal of Manufacturing Technology Manage-ment, 24, 1019-1050. https://doi.org/10.1108/JMTM-03-2012-0027
[9] Al-Tahat, M.D. and Bwaliez, O.M. (2015) Lean-Based Workforce Management in Jordanian Manufacturing Firms. International Journal of Lean Enterprise Research, 1, 284-316. https://doi.org/10.1504/IJLER.2015.071744
[10] Wickramasinghe, G.L.D. and Wickramasinghe, V. (2017) Implementation of Lean Production Practices and Manufacturing Performance: The Role of Lean Duration.
Journal of Manufacturing Technology Management, 28, 531-550.
https://doi.org/10.1108/JMTM-08-2016-0112
[11] Dave, Y. and Sohani, N. (2019) Improving Productivity Through Lean Practices in Central India-Based Manufacturing Industries. International Journal of Lean Six Sigma, 10, 601-621. https://doi.org/10.1108/IJLSS-10-2017-0115
[12] Doolen, T.L. and Hacker, M.E. (2005) A Review of Lean Assessment in Organiza-tions: An Exploratory Study of Lean Practices by Electronics Manufacturers. Journal of Manufacturing Systems, 24, 55-67.
https://doi.org/10.1016/S0278-6125(05)80007-X
[13] Kim, S.K. (2015) Lean Initiative Practice for Supplier Developments in Philippines.
International Journal of Lean Six Sigma, 6, 349-368.
https://doi.org/10.1108/IJLSS-12-2014-0042
[14] Frazzon, E., Tortorella, G.L., Dávalos, R., Holtz, T. and Coelho, L. (2017) Simula-tion-Based Analysis of a Supplier-Manufacturer Relationship in Lean Supply Chains. International Journal of Lean Six Sigma, 8, 262-274.
https://doi.org/10.1108/IJLSS-03-2016-0009
[15] Abushaikha, I., Al-Weshah, G. and Alsharairi, M. (2019) How Do Retail Firms Ben-efit from Co-Locating in Logistics-Intensive Clusters? A Focus on the Inbound Supply Function. The International Review of Retail, Distribution, and Consumer Research, 1-19. https://doi.org/10.1080/09593969.2019.1635906
[16] Qrunfleh, S. Tarafdar, M. and Ragu-Nathan, T.S. (2012) Examining Alignment be-tween Supplier Management Practices and Information Systems Strategy. Ben-chmarking: An International Journal, 19, 604-617.
https://doi.org/10.1108/14635771211258034
[17] Boer, H. and Boer, H. (2019) Design-for-Variety and Operational Performance: The Mediating Role of Internal, Supplier, and Customer Integration. Journal of Manu-facturing Technology Management, 30, 438-461.
https://doi.org/10.1108/JMTM-03-2018-0065
[18] Duhaylongsod, J.B. and De Giovanni, P. (2019) The Impact of Innovation Strategies on the Relationship Between Supplier Integration and Operational Performance.
International Journal of Physical Distribution & Logistics Management, 49, 156-177. https://doi.org/10.1108/IJPDLM-09-2017-0269
DOI: 10.4236/tel.2019.97151 2392 Theoretical Economics Letters Production, 131, 836-848. https://doi.org/10.1016/j.jclepro.2016.04.007
[20] Chen, I.J. and Paulraj, A. (2004) Towards a Theory of Supply Chain Management: The Constructs and Measurements. Journal of Operations Management, 22, 119-150. https://doi.org/10.1016/j.jom.2003.12.007
[21] Sezhiyan, D.M. and Nambirajan, T. (2010) Development of Scale to Measure Sup-plier Selection, Supply Effort Management and Organizational Performance.
Asia-Pacific Business Review, 6, 12-17.
https://doi.org/10.1177/097324701000600404
[22] Forkmann, S., Henneberg, S.C., Naudé, P. and Mitrega, M. (2016) Supplier Rela-tionship Management Capability: A Qualification and Extension. Industrial Mar-keting Management, 57, 185-200. https://doi.org/10.1016/j.indmarman.2016.02.003
[23] Jajja, M.S.S., Kannan, V.R., Brah, S.A. and Hassan, S.Z. (2017) Linkages between Firm Innovation Strategy, Suppliers, Product Innovation, and Business Perfor-mance: Insights from Resource Dependence Theory. International Journal of Oper-ations & Production Management, 37, 1054-1075.
https://doi.org/10.1108/IJOPM-09-2014-0424
[24] Al-Abdallah, G.M., Abdallah, A.B. and Bany Hamdan, K. (2014) The Impact of Supplier Relationship Management on Competitive Performance of Manufacturing Firms. International Journal of Business and Management, 9, 192-202.
https://doi.org/10.5539/ijbm.v9n2p192
[25] Li, S., Ragu-Nathan, B., Ragu-Nathan, T.S. and Subba Rao, S. (2006) The Impact of Supply Chain Management Practices on Competitive Advantage and Organization-al Performance. Omega, 34, 107-124. https://doi.org/10.1016/j.omega.2004.08.002
[26] Liu, H., Ke, W., Kee Wei, K. and Hua, Z. (2013) Effects of Supply Chain Integration and Market Orientation on Firm Performance: Evidence from China. International Journal of Operations & Production Management, 33, 322-346.
https://doi.org/10.1108/01443571311300809
[27] Womack, J., Jones, D. and Roos, D. (1990) The Machine that Changed the World: The Story of Lean Production. Harper Perennial, New York, NY.
[28] Yang, M.G., Hong, P. and Modi, S.B. (2011) Impact of Lean Manufacturing and En-vironmental Management on Business Performance: An Empirical Study of Manu-facturing Firms. International Journal of Production Economics, 129, 251-261.
https://doi.org/10.1016/j.ijpe.2010.10.017
[29] Adebanjo, D., Laosirihongthong, T. and Samaranayake, P. (2016) Prioritizing Lean Supply Chain Management Initiatives in Healthcare Service Operations: A Fuzzy AHP Approach. Production Planning & Control, 27, 953-966.
https://doi.org/10.1109/IEEM.2013.6962410
[30] Abushaikha, I., Salhieh, L. and Towers, N. (2018) Improving Distribution and Business Performance through Lean Warehousing. International Journal of Retail & Distribution Management, 46, 780-800.
https://doi.org/10.1108/IJRDM-03-2018-0059
[31] Shah, R. and Ward, P.T. (2007) Defining and Developing Measures of Lean Produc-tion. Journal of Operations Management, 25, 785-805.
https://doi.org/10.1016/j.jom.2007.01.019
[32] Browning, T.R. and Heath, R.D. (2009) Reconceptualizing the Effects of Lean on Production Costs with Evidence from the F-22 Program. Journal of Operations Management, 27, 23-44. https://doi.org/10.1016/j.jom.2008.03.009
Me-DOI: 10.4236/tel.2019.97151 2393 Theoretical Economics Letters
thods and Tools on the Operational Performance of Manufacturing Organizations.
International Journal of Production Research, 52, 5346-5366.
https://doi.org/10.1080/00207543.2014.903348
[34] Sahoo, S. and Yadav, S. (2018) Lean Production Practices and Bundles: A Compara-tive Analysis. International Journal of Lean Six Sigma, 9, 374-398.
https://doi.org/10.1108/IJLSS-01-2017-0002
[35] Taj, S. and Morosan, C. (2011) The Impact of Lean Operations on the Chinese Manufacturing Performance. Journal of Manufacturing Technology Management, 22, 223-240. https://doi.org/10.1108/17410381111102234
[36] Sangwa, N.R. and Sangwan, K.S. (2018) Development of an Integrated Performance Measurement Framework for Lean Organizations. Journal of Manufacturing Tech-nology Management, 29, 41-48. https://doi.org/10.1108/JMTM-06-2017-0098
[37] Barla, S.B. (2003) A Case Study of Supplier Selection for Lean Supply by Using a Mathematical Model. Logistics Information Management, 16, 451-459.
https://doi.org/10.1108/09576050310503420
[38] So, S. and Sun, H. (2010) Supplier Integration Strategy for Lean Manufacturing Adoption in Electronic-Enabled Supply Chains. Supply Chain Management: An In-ternational Journal, 15, 474-487. https://doi.org/10.1108/13598541011080455
[39] El Mokadem, M. (2017) The Classification of Supplier Selection Criteria with Re-spect to Lean or Agile Manufacturing Strategies. Journal of Manufacturing Tech-nology Management, 28, 232-249. https://doi.org/10.1108/JMTM-04-2016-0050
[40] Simpson, D.F. and Power, D.J. (2005) Use the Supply Relationship to Develop Lean and Green Suppliers. Supply Chain Management: An International Journal, 10, 60-68. https://doi.org/10.1108/13598540510578388
[41] Kisperska-Moron, D. and De Haan, J. (2011) Improving Supply Chain Performance to Satisfy Final Customers: ‘Leagile’ Experiences of a Polish Distributor. Interna-tional Journal of Production Economics, 133, 127-134.
https://doi.org/10.1016/j.ijpe.2009.12.013
[42] Moyano-Fuentes, J. and Sacristán-Díaz, M. (2012) Learning on Lean: A Review of Thinking and Research. International Journal of Operations & Production Man-agement, 32, 551-582. https://doi.org/10.1108/01443571211226498
[43] Marodin, G.A., Tortorella, G.L., Frank, A.G. and Filho, M.G. (2017) The Moderat-ing Effect of Lean Supply Chain Management on the Impact of Lean Shop Floor Practices on Quality and Inventory. Supply Chain Management: An International Journal, 22, 473-485. https://doi.org/10.1108/SCM-10-2016-0350
[44] Martínez-Jurado, P.J. and Moyano-Fuentes, J. (2014) Lean Management, Supply Chain Management and Sustainability: A Literature Review. Journal of Cleaner Production, 85, 134-150. https://doi.org/10.1016/j.jclepro.2013.09.042
[45] Jasti, N. and Kodali, R. (2015) A Critical Review of Lean Supply Chain Management Frameworks: Proposed Framework. Production & Planning Control, 26, 1051-1068.
https://doi.org/10.1080/09537287.2015.1004563
[46] Miller, C.C., Washburn, N.T. and Glick, W.H. (2013) Perspective—The Myth of Firm Performance. Organization Science, 24, 948-964.
https://doi.org/10.1287/orsc.1120.0762
[47] Richard, P.J., Devinney, T.M., Yip, G.S. and Johnson, G. (2009) Measuring Organi-zational Performance: Towards Methodological Best Practice. Journal of Manage-ment, 35, 718-804. https://doi.org/10.1177/0149206308330560
DOI: 10.4236/tel.2019.97151 2394 Theoretical Economics Letters
Performance. International Journal of Production Economics, 156, 269-282.
https://doi.org/10.1016/j.ijpe.2014.05.011
[49] Joshi, S., Kharat, M., Raut, R., Kamble, S. and Kamble, S. (2017) To Examine the Relationships between Supplier Development Practices and Supplier-Buyer Rela-tionship Practices from the Supplier’s Perspective. Benchmarking: An International Journal, 24, 1309-1336. https://doi.org/10.1108/BIJ-01-2016-0006
[50] Shin, H., Collier, D.A. and Wilson, D. (2000) Supply Management Orientation and Supplier/Buyer Performance. Journal of Operations Management, 18, 317-333.
https://doi.org/10.1016/S0272-6963(99)00031-5
[51] Samawi, G., Abushaikha, I., Salhieh, L., Mdanat, M. and Al-Rashid, A. (2019) Aligning Business Strategic Priorities and Purchasing Practices in Industrial Firms: Evidence from an Emerging Economy. Theoretical Economic Letters, 9, 709-736.
https://doi.org/10.4236/tel.2019.94047
[52] Alkhatib, S.F. (2017) Strategic Logistics Outsourcing: Upstream-Downstream Supply Chain Comparison. Journal of Global Operations and Strategic Sourcing, 10, 309-333. https://doi.org/10.1108/JGOSS-08-2016-0024
[53] Wu, Y.C. (2003) Lean Manufacturing: A Perspective of Lean Suppliers. Internation-al JournInternation-al of Operations & Production Management, 23, 1349-1376.
https://doi.org/10.1108/01443570310501880
[54] Kinyua, B.K. (2015) An Assessment of Just in Time Procurement System on Organ-ization Performance: A Case Study of Corn Products Kenya Limited. European Journal of Business and Social Sciences, 4, 40-53.
[55] Singh, D.K. and Singh, S. (2015) Procurement Strategy for Manufacturing and JIT.
International Journal of Engineering Research and Development, 11, 10-17. [56] Helper, S. (1991) How Much Has Really Changed between US Automakers and
Their Suppliers? Sloan Management Review, 15, 15-28.
[57] Singh, S. and Garg, D. (2011) Attributes in JIT Purchasing. AKGEC Journal of Technology, 2, 29-33.
[58] Kulkarni, S.N., Patil. A.M. and Pingle, S.S. (2014) Supplier Evaluation and Purchas-ing in JIT Environment—A Survey of Indian Firms. International Journal of Me-chanical and Production Engineering, 2, 1-5.
[59] Othman, A.A., Sundram, V.P.K., N.M. and Bahrin, A.S. (2016) The Relationship between Supply Chain Integration, Just-in-Time and Logistics Performance: A Sup-plier’s Perspective on the Automotive Industry in Malaysia. International Journal of Supply Chain Management, 5, 44-51.
[60] Guimaraes, T., Cook, D. and Natarajan, N. (2002) Exploring the Importance of Business Clockspeed as a Moderator for Determinants of Supplier Network Perfor-mance. Decision Sciences, 33, 629-644.
https://doi.org/10.1111/j.1540-5915.2002.tb01659.x
[61] Rai, A., Patnayakuni, R. and Seth, N. (2006) Firm Performance Impacts of Digitally Enabled Supply Chain Integration Capabilities. MIS Quarterly, 30, 225-246.
https://doi.org/10.2307/25148729
[62] Newman, R.G. and Rhee, K.A. (1990) A Case Study of NUMMI and its Suppliers.
Journal of Purchasing and Materials Management, 26, 15-20.
https://doi.org/10.1111/j.1745-493X.1990.tb00516.x
DOI: 10.4236/tel.2019.97151 2395 Theoretical Economics Letters https://doi.org/10.1016/j.ijpe.2004.05.009
[64] de Araújo, M.C.B., Alencar, L.H. and Viana, J.C. (2015) Structuring a Model for Supplier Selection. Management Research Review, 38, 1213-1232.
https://doi.org/10.1108/MRR-04-2014-0076
[65] Prajogo, D., Oke, A. and Olhager, J. (2016) Supply Chain Processes: Linking Supply Logistics Integration, Supply Performance, Lean Processes and Competitive Per-formance. International Journal of Operations & Production Management, 36, 220-238. https://doi.org/10.1108/IJOPM-03-2014-0129
[66] Handfield, R.B. and Bechtel, C. (2002) The Role of Trust and Relationship Structure in Improving Supply Chain Responsiveness. Industrial Marketing Management, 31, 367-382. https://doi.org/10.1016/S0019-8501(01)00169-9
[67] Zeller, T.L. (1995) Achieving Market Excellence through Quality: The Case of Ford Motor. Business Horizons, 38, 23-31. https://doi.org/10.1016/0007-6813(95)90019-5
[68] Wagner, S.M. and Krause, D.R. (2009) Supplier Development: Communication Approaches, Activities and Goals. International Journal of Production Research, 47, 3161-3177. https://doi.org/10.1080/00207540701740074
[69] Aharonovitz, M.C.S., Vidal Vieira, J.G. and Suyama, S.S. (2018) How Logistics Per-formance is Affected by Supply Chain Relationships. The International Journal of Logistics Management, 29, 284-307. https://doi.org/10.1108/IJLM-09-2016-0204
[70] Famiyeh, S. and Kwarteng, A. (2018) Supplier Selection and Firm Performance: Empirical Evidence from a Developing Country’s Environment. International Journal of Quality & Reliability Management, 35, 690-710.
https://doi.org/10.1108/IJQRM-06-2016-0091
[71] Das, D. (2018) The Impact of Sustainable Supply Chain Management Practices on Firm Performance: Lessons from Indian Organizations. Journal of Cleaner Produc-tion, 203, 179-196. https://doi.org/10.1016/j.jclepro.2018.08.250
[72] Li, W.Y., Chow, P.S., Choi, T.M. and Chan, H.L. (2016) Supplier Integration, Green Sustainability Programs, and Financial Performance of Fashion Enterprises under Global Financial Crisis. Journal of Cleaner Production, 135, 57-70.
https://doi.org/10.1016/j.jclepro.2016.06.048
[73] Kafetzopoulos, D., Gotzamani, K. and Skalkos, D. (2019) The Relationship between EFQM Enablers and Business Performance: The Mediating Role of Innovation.
Journal of Manufacturing Technology Management, 30, 684-706.
https://doi.org/10.1108/JMTM-06-2018-0166
[74] Ekici, A. (2013) An Improved Model for Supplier Selection under Capacity Con-straint and Multiple Criteria. International Journal of Production Economics, 141, 574-581. https://doi.org/10.1016/j.ijpe.2012.09.013
[75] Kar, A.K. and Pani, A.K. (2014) Exploring the Importance of Different Supplier Se-lection Criteria. Management Research Review, 37, 89-105.
https://doi.org/10.1108/MRR-10-2012-0230
[76] Minh, K.S., Zailani, S., Iranmanesh, M. and Heidari, S. (2019) Do Lean Manufac-turing Practices Have Negative Impact on Job Satisfaction? International Journal of Lean Six Sigma, 10, 257-274. https://doi.org/10.1108/IJLSS-11-2016-0072
[77] Liu, Y., Huang, Y., Luo, Y., Zhao, Y. (2012) How Does Justice Matter in Achieving Buyer-Supplier Relationship Performance? Journal of Operations Management, 30, 355-367. https://doi.org/10.1016/j.jom.2012.03.003
DOI: 10.4236/tel.2019.97151 2396 Theoretical Economics Letters Procurement Management, 8, 67-90. https://doi.org/10.1504/IJPM.2015.066283
[79] Alkunsol, W.H., Sharabati, A.A., AlSalhi, N.A. and El-Tamimi, H.S. (2018) Lean Six Sigma Effect on Jordanian Pharmaceutical Industry’s Performance. International Journal of Lean Six Sigma, 10, 23-43. https://doi.org/10.1108/IJLSS-01-2017-0003
[80] ACI (2019) Amman Chamber of Industry. http://www.aci.org.jo/page/industrial_
directory.aspx.
[81] Sekaran, U. and Bougie, R. (2010) Research Methods for Business: A Skill Building Approach. 5th Edition, John Wiley & Sons Ltd., West Sussex.
[82] Salhieh, L., Altarazi, S. and Abushaikha, I. (2018) Quantifying and Ranking the “7-Deadly” Wastes in a Warehouse Environment. The TQM Journal, 31, 94-115.
https://doi.org/10.1108/TQM-06-2018-0077
[83] Rea, L. and Parker, A. (2014) Designing and Conducting Survey Research: A Com-prehensive Guide. 4th Edition, John Wiley & Sons, Inc., Jossey-Bass, CA.
[84] Haier Jr., J., Black, W., Babin, B. and Anderson, R. (2014) Multivariate Data Analy-sis. 7th Edition, Pearson Education Ltd., Harlow.
[85] Litwin, M.S. (1995) How to Measure Survey Reliability and Validity. Sage Publica-tions, Inc., Thousand Oaks, CA. https://dx.doi.org/10.4135/9781483348957
[86] Nunnally, J.C. and Bernstein, I.H. (1994) Psychometric Theory. 3rd Edition, McGraw-Hill, Inc., New York.
[87] George, D. and Mallery, P. (2010) SPSS for Windows Step by Step: A Simple Guide and Reference 17.0 Update. 4th Edition, Allyn & Bacon, Boston, MA.
[88] Armstrong, R. and Tan, S. (2000) Corporate-Customer Satisfaction in the Banking Industry of Singapore. International Journal of Bank Marketing, 18, 97-111.
https://doi.org/10.1108/02652320010339617
[89] Hooper, D., Coughlan, J. and Mullen, M. (2008) Structural Equation Modeling: Guidelines for Determining Model Fit. Electronic Journal of Business Research Methods, 6, 53-60. https://doi.org/10.21427/D7CF7R
[90] Byrne, B.M. (2016) Structural Equation Modeling with AMOS: Basic Concepts, Ap-plications, and Programming, Routledge, London.
[91] Berenson, M.L., Levine, D.M. and Szabat. K.A. (2015) Basic Business Statistics: Concepts and Applications. 13th Edition, Pearson Education Ltd., Essex, England. [92] Al-Hyari, K., Abu Hammour, S., Abu Zaid, M.K.S. and Haffar, M. (2016) The
Im-pact of Lean Bundles on Hospital Performance: Does Size Matter? International Journal of Health Care Quality Assurance, 29, 877-894.