G. H´ebrard,
18E. Jehin,
19U. Kolb,
13P. F. L. Maxted,
4G. Miller,
20L. D. Nielsen ,
12D. L. Pollacco,
5,6F. J. Pozuelos,
7,19D. Queloz,
12,15H. Relles,
21B. Smalley ,
4A. H. M. J. Triaud,
22S. Udry,
16R. West
5,6and P. J. Wheatley
5,6Affiliations are listed at the end of the paper
Accepted 2019 July 23. Received 2019 July 23; in original form 2019 June 24
A B S T R A C T
SuperWASP, the Northern hemisphere WASP observatory, has been observing the skies from La Palma since 2004. In that time, more than 50 planets have been discovered with data contributions from SuperWASP. In the process of validating planets, many false-positive candidates have also been identified. The TESS telescope is set to begin observations of the northern sky in 2019. Similar to the WASP survey, the TESS pixel size is relatively large (13 arcsec for WASP and 21 arcsec for TESS), making it susceptible to many blended signals and false detections caused principally by grazing and blended stellar eclipsing binary systems. In order to reduce duplication of effort on targets, we present a catalogue of 1 041 Northern hemisphere SuperWASP targets that have been rejected as planetary transits through follow-up observation.
Key words: methods: observational – catalogues – planets and satellites: detection.
1 I N T R O D U C T I O N
The identification of exoplanets via the transit method is com-plicated by the presence of astrophysical false positives (Brown 2003; Cameron 2012). These are light curves showing periodic dips whose depth and recurrence period are planet-like, but whose origins are another type of transiting system, such as a brown dwarf or eclipsing binary stars. Furthermore, limitations in telescope resolution can cause light from multiple sources to blend into one apparent source, causing deep transit events of non-planetary origin to become diluted and mimic a planetary transit.
In order to reject these false positives, ground-based photometric surveys such as the Hungarian-made Automated Telescope Network (HATnet; Hartman et al.2004), HATSouth (Bakos et al.2013), the Qatar Exoplanet Survey (QES; Alsubai et al.2013), the Kilodegree Extremely Little Telescope (KELT; Pepper et al. 2007) and the Wide-Angle Search for Planets (WASP; Pollacco et al. 2006) employ ground-based follow-up networks to identify, observe, and reject or validate planet candidates. Often this follow-up takes the form of radial velocity observations, but in many cases additional
E-mail:[email protected]
photometry is also used to determine the signal’s origin and transit parameters.
With the successful launch of the Transiting Exoplanet Survey Satellite (TESS; Ricker et al. 2015), it has become essential for previous follow-up attempts to be made public. TESS will survey the entire sky with varying cadences in order to identify transit candidate events. Each TESS pixel represents 21 arcsec on the sky, making the probability of blends in the aperture high. To help process the high rate of incoming data, automated methods are being developed to vet the TESS data, e.g. Yu et al. (2019), Osborn et al. (2019). However, these methods do not provide perfect classifications, and many false positives can be earmarked for further follow-up. While the TESS mission has enlisted the help of a large number of observatories for follow-up work, TESS is producing candidates faster than they can be followed up with the observing facilities available, necessitating candidate ranking and prioritization.
Following in the footsteps of the KELT catalogue of false positives (Collins et al.2018), we present here a catalogue of false positives observed by the SuperWASP follow-up team. In Section 2, we describe the candidate validation and follow-up strategy of the WASP project. The contents of the false positive catalogue are laid out in Section 3. Finally, in Section 4 we reflect on the contents
of the catalogue and compare the false-positive rate to predictions. The catalogue is available as a csv file in the online edition of the manuscript.
2 S U P E R WA S P P R O J E C T
The Wide Angle Search for Planets (WASP) consortium was one of the first telescope networks to undertake a large sky survey with the goal of discovering exoplanets, and particularly ‘hot Jupiters’, by the transit method in stars bright enough for spectroscopic follow-up (Pollacco et al.2006). The WASP consortium consists of two observatories, with the northern component, SuperWASP, located at the Observatorio del Roque de los Muchachos on La Palma and WASP-South at the Sutherland station of the South African Astronomical Observatory. Both telescopes are made up of an array of eight commercial Canon 200 mm f/1.8 camera lenses backed by 2kx2k E2V CCD cameras mounted together. Since 2006 they have monitored most of the visible sky throughout at least two observing seasons, avoiding only the galactic plane and the low-altitude celestial polar regions.
The raw-image data are corrected using bias frames, thermal dark-current exposures, and flat-field exposures. Typically the light curves for stars in the USNO-B1.0 catalogue that are brighter than an R magnitude of 15 are extracted. The light curves for each star are taken from three different circular apertures with radii of 2.5, 3.5, and 4.5 pixels, corresponding to 34, 48, and 62 arcsec on the sky. Checking whether the transit signal appears stronger in the larger apertures gives an indication of whether the object is blended with a nearby star, and thereby helps to eliminate photometric blends from further analysis (Pollacco et al.2006).
The WASP pipeline also performs several other corrections for trends in the photometry, including the effects of extinction, instrumental colour response, and the system’s zero point. Similar to many other transit searches, the light curves are searched for transit signals using the box-least squares (BLS) method (Kov´acs, Zucker & Mazeh 2002). This algorithm iterates through many period steps and transit lengths to find the strongest ‘box’ shaped signal. This is computationally expensive, so searches are generally only done for periods up to 16 d in the WASP pipeline. The light curve folded on the best-fitting period forms the basis for human vetting for planetary candidates. For a complete description of the WASP calibration and transit search methods, see Pollacco et al. (2006) and Collier Cameron et al. (2006).
All of the WASP targets are accessible to the team in an online archive. Each star’s entry contains the WASP light curve folded on the best-fitting period from the BLS algorithm, the periodogram from the BLS run, stellar parameters such as an estimated radius, brightness, and temperature generated from the NOMAD catalogue, and a list of the system parameters based on the BLS best-fitting period and subsequent MCMC analysis of the system. This includes transit depth, period, inclination, and secondary radius.
As of 2019 April 18, the SuperWASP and WASP-South project have produced 163 published planets:130 with SuperWASP, 109 with WASP-South, and 24 joint north and south. In addition, SuperWASP has contributed to rejecting an additional 1041 objects after follow-up data was taken. These objects, shown in Fig.1, are presented in this work.
The WASP data base contains information of all stars with anR
15.0 in the USNO-B1.0 catalogue, and the BLS transit detection
1https://wasp-planets.net/wasp-planets/
runs are only made for stars with more than 1000 data points. The archive contains all data available from the beginning of the SuperWASP project through March of 2014. The members of the WASP team have access to all of the light curves on an online data base. From the website, users can go through and manually identify targets for follow-up. This can be done by a direct search for the object, by sky region, or through a more sophisticated query to select all stars with specific properties.
There are four tiers to the stars flagged for follow-up. A flag of ‘C’ indicates a low priority candidate, ‘B’ a medium priority, ‘A’ a high priority, and ‘AA’ being a very high priority. When the star exhibits an interesting light curve where the priority is uncertain, the flag ‘D’ can be used to generate further discussion on the target, as well as trigger an additional reduction of the data for the star.
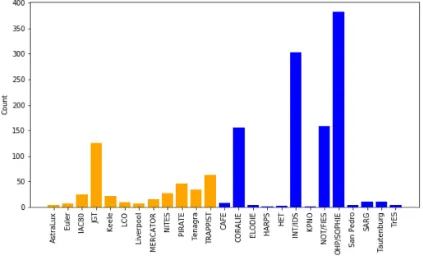
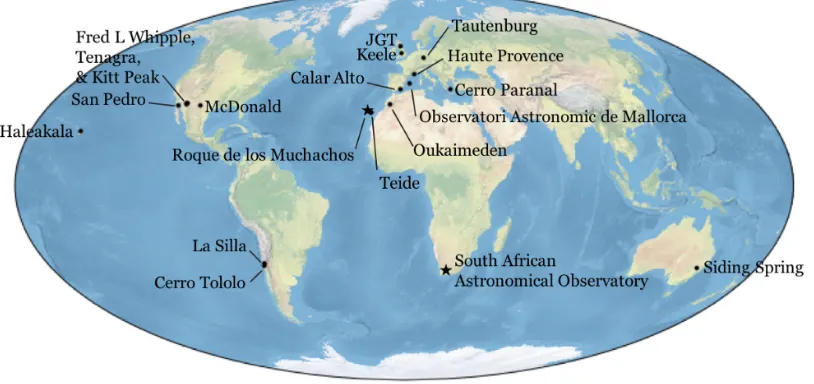
Stars with a follow-up flag make up a pool from which targets are selected based on telescope availability and target visibility. The follow-up can be done either with photometric observations with a telescope with seeing-limited angular resolution to constrain the ephemeris and check for close blends, or spectroscopic obser-vations to check for spectroscopic blends and measure the radial velocity amplitude. The SuperWASP project relies on follow-up observations from a wide range of instruments to observe targets of interest. The contribution from each instrument is shown in Fig.2. For further information about each instrument, refer to Appendix A. The observatory locations can be seen in Fig.3.
Once the nature of the light curve is known, it can be dispositioned in the catalogue as a planet (P), an eclipsing binary (EB), a blend with nearby objects (Blend), a low-mass companion (EBLM), a variable star (V), a false detection (X), or simply rejected after follow-up (RAF). If follow-up data was taken by another instrument to make the disposition determination, an additional, optional follow-up flag can be used to add further information. This can include information from spectroscopic follow-up, such as single or double lined eclipsing binary (SB1 or SB2) or line bissector (LB) variations. The follow-up flag can also add further information about the star, such as whether the star is a rapid rotator (RR) or a giant (G). Further information about the flags and their meanings can be found in Section 3.
3 FA L S E - P O S I T I V E C ATA L O G U E
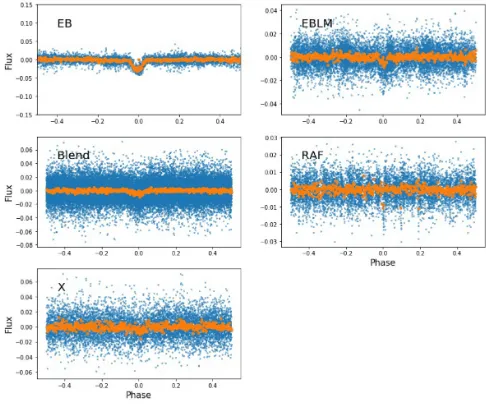
The WASP FP catalogue contains entries for each star that has been dispositioned after additional observation. The conventions for primary flags and follow-up flags are described below. Examples of randomly selected light curves of the different primary classifica-tions can be seen in Fig.4.
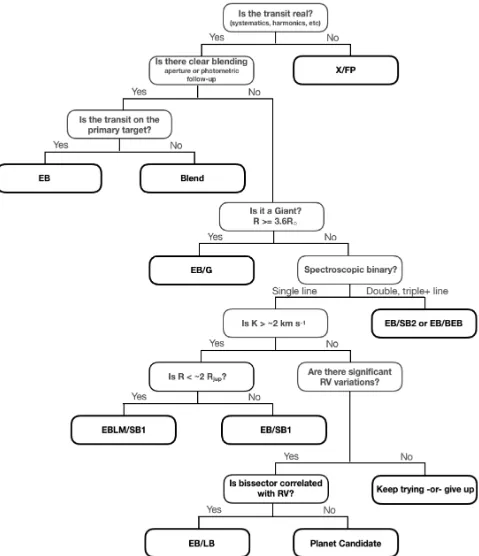
A summary decision tree describing the dispositioning process can be seen in Fig.5. The limits that make up the branches of the decision tree are used as guidelines and not necessarily definitive rules. For example, the radial velocity semi-amplitude K has a cut-off of 2 km s−1, an upper estimate based on a marginal brown dwarf in a 3 d orbit around a star typical for what is expected in the SuperWASP survey:
K=1.83kms−1
P 3d
1/3
Mp
13MJup
M
M
−2/3 .
Stars with radii greater than 3.6 Rare rejected as giants. Detectable dips (>0.004 mag) around larger stars must be caused by objects too large to be planets.
Blends are a common type of astrophysical false positive. In these systems, the dip in magnitude is clearly on a nearby star and not
Figure 1. Location of all of the SuperWASP planet candidates that have been rejected after further follow-up. The black line shows the ecliptic. The different colours represent the different classifications. The missing swath between 18 and 20 h falls on a particularly dense region of the galactic plane. WASP avoided this region as the level of photometric confusion was too high to confidently perform aperture photometry. The celestial polar regions were not surveyed, both because of the low altitude and because of the vignetting by the WASP enclosure.
Figure 2. Number of stars for which follow-up observations that contributed to the final disposition were taken, by observatory. Orange and blue bars represent photometric and spectrographic instruments, respectively. In total, 891 objects in the catalogue had spectroscopic follow-up while 315 had follow-up photometry. 165 stars fall in the intersection of these groups where both types of data were used for dispositioning.
on the primary target, but the starlight is blended together when imaged on the 13 arcsec pixel−1scale of the WASP cameras. This is analogous to the situation for TESS, which has 21 arcsec pixel−1. As the innermost WASP photometric aperture has a radius of 2.5 pixels – just over 34 arcsec – blending is a frequent issue. Blends
are generally revealed by photometric follow-up with an instrument with greater spatial resolution than WASP provides. However, more widely separated blends can also be identified by comparing the relative depths of transits detected by WASP with the same period in adjacent resolved stars or by radial velocity measurements showing
[image:3.595.87.510.364.624.2]Figure 3. Locations of the observatories used for follow-up of SuperWASP targets. The stars at the Roque de los Muchachos Observatory and South African Astronomical Observatory denote the location of SuperWASP and WASP-South, respectively.
no radial velocity changes on the primary target but motion on a nearby companion. If the star is shown to be part of a triple system, a further follow-up flag of ‘BEB’ is added. In the case of a binary or triple blended system in which the target star has been shown to have evolved off of the main sequence, a ‘G’ follow-up flag is used in place of ‘BEB’.
Eclipsing binaries, systems in which two stars orbit one another, are denoted with a primary ‘EB’ flag. If the determination was made through photometric follow-up, where the transit signal is too deep and V-shaped to be explained by a planetary object, no follow-up flag is provided. If the binary status was determined through spectral observations, additional information is provided when possible. A follow-up flag of ‘SB1’ or ‘SB2’ is used for single or double lined binary. In cases where three or more stellar components are seen, the primary flag remains ‘EB’, but the follow-up flag is changed to ‘BEB’ for blended eclipsing binary.
An ‘SB1’ can also be indicative of a low-mass eclipsing binary (EBLM). This category reflects an object more massive than a planet or a brown dwarf, but with a radius comparable to a gas-giant planet or a very low mass star close to the mass limit for hydrogen burning. These are of particular interest for TESS as their flat-bottomed transits can pass almost every vetting test. In general, radial velocity data is needed to constrain the mass and confirm the EBLM status. However, in a few cases, the EBLM label was assigned based on the radius alone with the justification being the most likely explanation for an object larger than 2.2RJup is a small star and not a hyper inflated planet. Several EBLMs reported in this catalogue have significantly larger radii than this limit. This reflects the fact that the catalogue contains properties of the secondary mass estimates from the WASP archive, not values determined after follow-up. As with the EBs, EBLMs will not have a follow-up flag if determined photometrically. Note that 18 of the EBLMs included in this catalogue have already been reported by Triaud et al. (2017). These have been denoted with a ‘∗’ after the SWASP ID.
The ’X’ flag in this catalogue is a broad category and can either indicate that the light curve was a non-astrophysical false positive due to systematics, in which case the follow-up flag is ‘FP’ for false
positive, or that the light curve was otherwise rejected. Again, the comments column will provide further detail.
Some follow-up flags can be used for several different primary flags. The ‘RR’ follow-up flag indicated the star is rapidly rotating, defined in the WASP data base as having an FWHM>8 km s−1. The ‘G’ flag indicates that the primary target star is a giant. In the case that the giant status was deduced prior to follow-up by looking at the reduced proper motion of the star, the star is not included in the catalogue. However, in some cases, the giant status of the star was not known until spectral data were obtained. The recentGaia
data release has now greatly reduced the risk for spending follow-up effort of evolved stars. Finally ‘O’ stands for ‘other’, meaning that none of the follow-up flags provided captures why the object was categorized as it was. When possible, further information about the classification is included in the ‘Comments’ column of the table. In some cases, a star in the catalogue is labelled as rejected without further classification (denoted as ‘RAF’). The flags in the false positive catalogue have therefore been updated to reflect the true disposition. The exception to this is for the case when planetary status has been rejected based only on the fact that the star was determined to be a giant. In this event, the primary flag remains ‘RAF’ with a ‘G’ for follow-up.
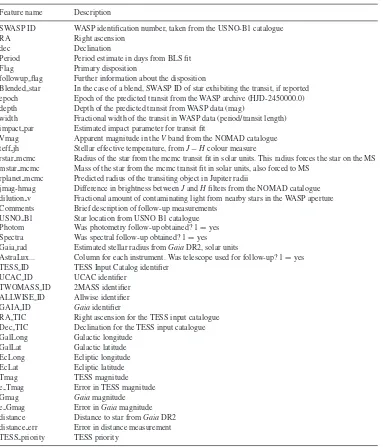
In addition to the disposition flags, the catalogue contains features about the star, such as the radius, mass, and temperature. There is also information about the potential transiting system determined from the BLS and MCMC models, including features such as the period, depth, and width of the signal. The type of follow-up, spectroscopic or photometric, is recorded, as well as a binary flag for every follow-up instrument used by the WASP team. The flag is set to 1 for any observation made by an instrument regardless of whether that observation was useful or conclusive due to weather, timing issues, or noise. A brief description on how the disposition was made is provided in the ‘Comment’ column. Finally, additional positional and descriptive information, including the TESS Input Catalog (TIC) number and TESS priority values, are provided. A full description of all features included in the catalogue is provided in Table1, with an example of the catalogue entries in Table2.
Figure 4. Examples of light curves for each of the primary classification types, selected randomly from the catalogue. The objects shown here are EB 1SWASP J131147.03+173430.5, EBLM 1SWASP J023134.38+342208.1, Blend 1SWASP J210729.47+021911.8, X 1SWASP J151846.85+234844.0, and RAF 1SWASP J031917.69+401724.2. All WASP data points are shown in blue, with a phase binned light curve overplotted in orange.
The dispositions in this catalogue are based on notes recorded by many different observers across several instruments since observations began. We have manually reviewed the catalogue to check for consistency in flags and follow-up flags to align with the above guidelines. However, due to the variation amongst observers, evolution in labelling convention over time, and level of detail provided about the classification decision, the catalogue may contain some mislabelled stars. Furthermore, presence in the false positive catalogue does not necessarily mean that there is not a planet in the system, only that there is not a planet of the predicted size and period found in the WASP data.
The catalogue highlights several interesting features in the population of stars that have been observed. One trend that is apparent in the data is the magnitude sensitivity of SuperWASP. Fig.6shows that the vast majority of stars observed with WASP have
V-band magnitudes less than 14, even though the input catalogue contains all stars brighter than a magnitude of 15. The reason for this is twofold. First, brighter objects have better signal to noise, with objects brighter than aVmagnitude of 9.4 having precision
around 0.004 mag. By aVmagnitude of 11.5, the precision drops to .01 (Pollacco et al. 2006). Secondly, follow-up observations, and especially sensitive spectroscopic observations, are magnitude limited, so brighter stars are treated preferentially for follow-up attempts.
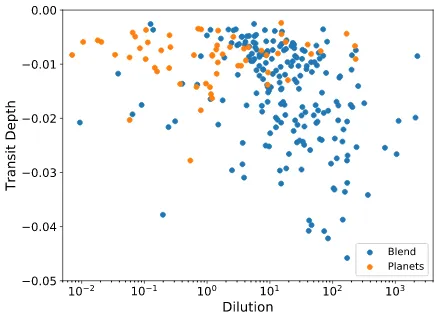
Fig. 7 shows the relationship between the transit period in days to the depth of the transit in magnitude for each type of false positive. In addition, the known population of SuperWASP planets are overlayed with black crosses. This clearly shows that the majority of planets detectable with WASP have transit depths less that 2.5 per cent, and a depth greater than that is strongly suggestive of an eclipsing binary or low mass eclipsing object. In Fig.8, we see that the majority of planets that have been detected lie in the temperature range of 5000–6500K. This is because the sensitivity of WASP favours stars in the F and G range (Bentley2009).
In order to try to quantify the effect of blended light on follow-up stars, we useGaiaphotometry to make a rough prediction on the dilution of light from the primary target. We search theGaiaDR2 data base (Gaia Collaboration et al. 2016, 2018) for all objects
Figure 5. A manual ‘decision tree’ describing the general criteria for dispositioning objects in the WASP database. In many cases, there is not enough data to completely go through the decision tree. When this happens, only branches containing known information are used. For example, if only spectroscopic follow-up is available, we bypass the branch pertaining to aperture and photometric blends.
within the middle WASP aperture of 3.5 pixels (48 arcsec) in radius surrounding the target star. We then combine the relative magnitude of the surrounding stars to the target star to measure the total dilution. Higher dilution values mean increased light from other sources within the aperture. As can be seen in Fig.9,
there is a clear tendency for planets to be found where few other stars are present to dilute the target light. This is most apparent when comparing to the population of blends, although a similar trend is seen when comparing planets to eclipsing binaries and other low-mass eclipsing companions. This demonstrates another
epoch Epoch of the predicted transit from the WASP archive (HJD-2450000.0) depth Depth of the predicted transit from WASP data (mag)
width Fractional width of the transit in WASP data (period/transit length) impact par Estimated impact parameter for transit fit
Vmag Apparent magnitude in theVband from the NOMAD catalogue teff jh Stellar effective temperature, fromJ−Hcolour measure
rstar mcmc Radius of the star from the mcmc transit fit in solar units. This radius forces the star on the MS mstar mcmc Mass of the star from the mcmc transit fit in solar units, also forced to MS
rplanet mcmc Predicted radius of the transiting object in Jupiter radii
jmag-hmag Difference in brightness betweenJandHfilters from the NOMAD catalogue dilution v Fractional amount of contaminating light from nearby stars in the WASP aperture Comments Brief description of follow-up measurements
USNO B1 Star location from USNO B1 catalogue Photom Was photometry follow-up obtained? 1=yes Spectra Was spectral follow-up obtained? 1=yes Gaia rad Estimated stellar radius fromGaiaDR2, solar units
AstraLux... Column for each instrument. Was telescope used for follow-up? 1=yes TESS ID TESS Input Catalog identifier
UCAC ID UCAC identifier TWOMASS ID 2MASS identifier ALLWISE ID Allwise identifier GAIA ID Gaiaidentifier
RA TIC Right ascension for the TESS input catalogue Dec TIC Declination for the TESS input catalogue GalLong Galactic longitude
GalLat Galactic latitude EcLong Ecliptic longitude EcLat Ecliptic latitude
Tmag TESS magnitude
e Tmag Error in TESS magnitude
Gmag Gaiamagnitude
e Gmag Error inGaiamagnitude distance Distance to star fromGaiaDR2 distance err Error in distance measurement TESS priority TESS priority
way which Gaia data can be used to help with candidate prioritization.
4 S U M M A RY A N D C O N C L U S I O N S
Here, we have presented a catalogue of all stars displaying transit-like signals in SuperWASP data that were shown to not be planets after further follow-up. Objects that are currently undergoing additional observations or that do not have a definitive disposi-tion are not included. In total, 1041 false positives have been included in the catalogue, while 54 planets have been discov-ered with SuperWASP or jointly with WASP-South. This false positive rate is similar to that reported by the KELT team which found 1128 false positives and 30 reported planets (Collins et al. 2018).
In addition to the WASP planets, the data base includes many planets that have been discovered by other survey missions, and therefore have not been assigned a WASP name. While not all of
these planets are visible in the WASP data due to poor signal to noise, lack of sufficient data on the star, or periods outside of the WASP search space, nearly 50 additional planets can be identified in the SuperWASP data.
Several attempts have been made in order to estimate the detection rates of both planets and false positives for transit surveys. Brown (2003) estimated the throughput for a program akin to the typical fields of the STARE telescope, with 211 h of observing spread out over 91 d with a telescope with a photometric aperture of 20 arcsec and an upper magnitude limit of 12. For a comparable number of stars as TESS target stars, a total of only 7–8 hot Jupiters would be detectable with at least 3 transits, while nearly 86 binaries, hierarchical binaries, and blends would be seen.
G¨unther et al. (2016) made a similar calculation for the NGTS transit survey. They estimated the yield of planets and other false positives over 4 yr of projected observations. With an estimated 1 mmag of red noise, 244 planets were estimated to be detectable, while over 5500 eclipsing binaries and blends would be observed.
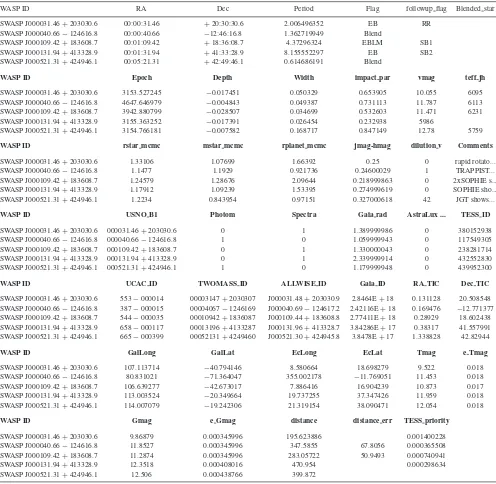
[image:7.595.109.492.69.516.2]Table 2. Sample of the SuperWASP false positive catalogue.
SWASP ID RA Dec Period Flag followup flag Blended star
1SWASP J000031.46+203030.6 00:00:31.46 +20:30:30.6 2.006496352 EB RR
1SWASP J000040.66−124616.8 00:00:40.66 −12:46:16.8 1.362719949 Blend
1SWASP J000109.42+183608.7 00:01:09.42 +18:36:08.7 4.37296324 EBLM SB1
1SWASP J000131.94+413328.9 00:01:31.94 +41:33:28.9 8.155552297 EB SB2
1SWASP J000521.31+424946.1 00:05:21.31 +42:49:46.1 0.614686191 Blend
SWASP ID Epoch Depth Width impact par vmag teff jh
1SWASP J000031.46+203030.6 3153.527245 −0.017451 0.050329 0.653905 10.055 6095
1SWASP J000040.66−124616.8 4647.646979 −0.004843 0.049387 0.731113 11.787 6113
1SWASP J000109.42+183608.7 3942.880799 −0.028507 0.034699 0.532603 11.471 6231
1SWASP J000131.94+413328.9 3155.363252 −0.017391 0.026454 0.232938 5986
1SWASP J000521.31+424946.1 3154.766181 −0.007582 0.168717 0.847149 12.78 5759
SWASP ID rstar mcmc mstar mcmc rplanet mcmc jmag-hmag dilution v Comments
1SWASP J000031.46+203030.6 1.33106 1.07699 1.66392 0.25 0 rapid rotato...
1SWASP J000040.66−124616.8 1.1477 1.1929 0.921736 0.24600029 1 TRAPPIST...
1SWASP J000109.42+183608.7 1.24579 1.28676 2.09644 0.218999863 0 2xSOPHIE s...
1SWASP J000131.94+413328.9 1.17912 1.09239 1.53395 0.274999619 0 SOPHIE sho...
1SWASP J000521.31+424946.1 1.2234 0.843954 0.97151 0.327000618 42 JGT shows...
SWASP ID USNO B1 Photom Spectra Gaia rad AstraLux ... TESS ID
1SWASP J000031.46+203030.6 000031.46+203030.6 0 1 1.389999986 0 380152938
1SWASP J000040.66−124616.8 000040.66−124616.8 1 0 1.059999943 0 117549305
1SWASP J000109.42+183608.7 000109.42+183608.7 0 1 1.330000043 0 238281714
1SWASP J000131.94+413328.9 000131.94+413328.9 0 1 2.339999914 0 432552830
1SWASP J000521.31+424946.1 000521.31+424946.1 1 0 1.179999948 0 439952300
SWASP ID UCAC ID TWOMASS ID ALLWISE ID Gaia ID RA TIC Dec TIC
1SWASP J000031.46+203030.6 553−000014 00003147+2030307 J000031.48+203030.9 2.8464E+18 0.131128 20.508548 1SWASP J000040.66−124616.8 387−000015 00004067−1246169 J000040.69−124617.2 2.42116E+18 0.169476 −12.771377 1SWASP J000109.42+183608.7 544−000035 00010942+1836087 J000109.44+183608.8 2.77411E+18 0.28929 18.602438 1SWASP J000131.94+413328.9 658−000117 00013196+4133287 J000131.96+413328.7 3.84286E+17 0.38317 41.557991 1SWASP J000521.31+424946.1 665−000399 00052131+4249460 J000521.30+424945.8 3.8478E+17 1.338828 42.82944
SWASP ID GalLong GalLat EcLong EcLat Tmag e Tmag
1SWASP J000031.46+203030.6 107.113714 −40.794146 8.580664 18.698279 9.522 0.018
1SWASP J000040.66−124616.8 80.831021 −71.364047 355.002178 −11.769051 11.453 0.018
1SWASP J000109.42+183608.7 106.639277 −42.673017 7.886416 16.904239 10.873 0.017
1SWASP J000131.94+413328.9 113.003524 −20.349664 19.737255 37.347426 11.959 0.018
1SWASP J000521.31+424946.1 114.007079 −19.242306 21.319154 38.090471 12.054 0.018
SWASP ID Gmag e Gmag distance distance err TESS priority
1SWASP J000031.46+203030.6 9.86879 0.000345996 195.623886 0.001400228
1SWASP J000040.66−124616.8 11.8527 0.000345996 347.5855 67.8056 0.000365508
1SWASP J000109.42+183608.7 11.2874 0.000345996 283.05722 50.9493 0.000740941
1SWASP J000131.94+413328.9 12.3518 0.000408016 470.954 0.000298634
1SWASP J000521.31+424946.1 12.506 0.000438766 399.872
However, only 620 of those would pass the vetting procedures for the instrument, making the estimated success rate around 28 per cent.
For the TESS mission, an extensive study was done to simulate planet detections and false positive rates (Sullivan et al. 2015). In this work, the authors project that a total of 1700 planets could be discovered using the 2x10⁵ target stars, and more than 20 000 planets when also including other stars in the full-frame images with 30 min sampling. In addition, 1100 grazing binaries, hierarchical eclipsing binaries, or blended eclipsing binaries could be detectable in the targets stars, rising greatly to 664 000 when including the full-frame stars. However, not all of these binaries are false positives, as many can be easily distinguished without further observations. In particular, their paper uses ellipsoidal variations, the presence of secondary eclipses, long ingress and egresses, and
centroid motion to separate planets from other astrophysical false positives in order to reduce the number of candidates requiring follow-up.
These studies findings are not directly comparable to the Super-WASP results reported in the false positive catalogue. The studies were conducted making assumptions on mission specifications that differ from that of WASP. In addition, the SuperWASP archive contains more than 30 000 stars that have been dispositioned as binaries, blends, low-mass eclipsing objects, or variable stars without the need for additional observations, and many more that have been rejected but did not receive a label. Finally, the WASP follow-up team has not observed all of the stars in the catalogue that have been flagged as targets of interest, so the final success rate of SuperWASP is not known.
Figure 6. Comparison of theV-band magnitude and transit depth for all objects in the SuperWASP false positive catalogue. As before, only planets found by either SuperWASP or a joint discovery with WASP-South are overplotted for context. While WASP retains information on stars>15 mag, the noise on stars that faint do not have sufficient precision. As seen here, SuperWASP tends to follow-up on objects brighter than a magnitude of 13–14.
Figure 7. Period in days and depth in magnitude, both scaled logrithmically for clarity, for all objects in the SuperWASP false positive catalogue. Planets found by either SuperWASP or a joint discovery with WASP-South are overplotted for context. The BLS search used to find predicted periods has a maximum period of 16 d, although often the search only extends out to 14 d. Periods found near one integer day are filtered out as the day/night cycle on Earth creates artefacts in the SuperWASP data that frequently tricks the BLS algorithm into finding a transit signal when none is present.
Of the 1041 stars presented here, a total of 474 eclipsing binaries, 240 low-mass eclipsing objects, and 209 blends are reported. In addition, 71 stars were rejected based on their giant status and a further 47 were rejected for other reasons, with 34 of those being non-astrophysical false positives. In the subset of the stars with spectroscopic follow-up, 207 were single-lined binaries and 290 were double lined. 47 stars were shown to be in a system with at least three components. These stars along with their flag, follow-up flag, transit details, stellar properties, and other identifying features are included in the catalogue and are available as a csv file in the online edition of this manuscript.
[image:9.595.60.272.55.212.2]With the launch of TESS, the number of stars being surveyed has gone up dramatically, and many thousands of possible transiting objects will be revealed. The intention of this work is to share the findings of the WASP team with other groups in order to eliminate a duplication of observational time and effort.
Figure 8. Comparison of the relationship between host star temperature and estimated secondary radius. It is clear that the majority of planets have been found around F and G type stars, as is expected based on the sensitivity of WASP. It is also notable that many stars with estimated secondary radii that are much larger than would be expected for a planet were followed up on. This is due largely to the large pixel size of SuperWASP, leading to blending of light from multiple stars in the aperture dampening the transit depth in the WASP data.
Figure 9. Comparison of the relationship between dilution in the 3.5 pixel aperture and transit depth for planets and blends. As expected, the more dilution in the WASP aperture, the more likely a transit signal is not due to a planet, but rather from a blend with another background object.
AC K N OW L E D G E M E N T S
NS acknowledges the support of the National Priorities Research Program (NPRP) grant #X-019-1-006 from the Qatar National Research Fund (a member of Qatar Foundation). ACC acknowl-edges support from the Science & Technology Facilities Coun-cil (STFC) consolidated grant number ST/R000824/1. DJA ac-knowledges support from the STFC via an Ernest Rutherford Fellowship (ST/R00384X/1). FF, DLP, RGW and PJW acknowl-edge support from STFC consolidated grants (ST/L000733/1 and ST/P000495/1). SCCB acknowledges support from Fundac¸˜ao para a Ciˆencia e a Tecnologia (FCT) through Investigador FCT contract IF/01312/2014/CP1215/CT0004, through national funds (PTDC/FIS-AST/28953/2017) and by FEDER - Fundo Europeu de Desenvolvimento Regional through COMPETE2020 - Programa Operacional Competitividade e Internacionalizac¸˜ao (POCI-01-0145-FEDER-028953) and (PIDDAC) by the grant
[image:9.595.60.273.303.458.2] [image:9.595.319.538.324.484.2]UID/FIS/04434/2019. TRAPPIST is funded by the Belgian Fund for Scientific Research (Fond National de la Recherche Scientifique, FNRS) under the grant FRFC 2.5.594.09.F, with the participation of the Swiss National Science Fundation (SNF). MG and EJ are F.R.S.-FNRS Senior Research Associates. The research leading to these results has received funding from an ARC grant for Concerted Research Actions financed by the Wallonia-Brussels Federation. TRAPPIST-North is a project funded by the University of Li`ege, and performed in collaboration with Cadi Ayyad University of Marrakesh.
R E F E R E N C E S
Aceituno J. et al., 2013,A&A, 552, A31 Alsubai K. A. et al., 2013, Acta Astron., 63, 465 Bakos G. ´A. et al., 2013,PASP, 125, 154 Baranne A. et al., 1996, A&AS, 119, 373 Barkaoui K. et al., 2019,AJ, 157, 43 Bentley S., 2009, PhD thesis, Keele University Bouchy F. et al., 2009,A&A, 505, 853
Bouchy F., D´ıaz R. F., H´ebrard G., Arnold L., Boisse I., Delfosse X., Perruchot S., Santerne A., 2013,A&A, 549, A49
Brown T. M., 2003,ApJ, 593, L125 Cameron A. C., 2012,Nature, 492, 48
Collier Cameron A. et al., 2006,MNRAS, 373, 799 Collins K. A. et al., 2018,AJ, 156, 234
Gaia Collaboration et al., 2016,A&A, 595, A1 Gaia Collaboration et al., 2018,A&A, 616, A1
Gillon M., Jehin E., Magain P., Chantry V., Hutsem´ekers D., Manfroid J., Queloz D., Udry S., 2011, EPJ Web Conf., 11, 06002
G¨unther M. N., Queloz D., Demory B.-O., Bouchy F., 2016, MNRAS, 465, 3379
Hartman J. D., Bakos G., Stanek K. Z., Noyes R. W., 2004,AJ, 128, 1761 Holmes S. et al., 2011,PASP, 123, 1177
Hormuth F., Brandner W., Hippler S., Henning T., 2008,J. Phys. Conf. Ser., 131, 012051
Jehin E. et al., 2011, The Messenger, 145, 2 Kolb U., 2014, Rev. Mex. Astron. Astrofis., 45, 16
Kolb U., Brodeur M., Braithwaite N., Minocha S., 2018, Robot. Telesc. Stud. Res. Educ. Proc., 1, 127
Kov´acs G., Zucker S., Mazeh T., 2002,A&A, 391, 369 Mayor M. et al., 2003, The Messenger, 114, 20
Meaburn J., L´opez J. A., Guti´errez L., Quir´oz F., Murillo J. M., Vald´ez J., Pedrayez M., 2003, Rev. Mex. Astron. Astrofis., 39, 185
Osborn H. P. et al., 2019, preprint (arXiv:e-print) Pepper J. et al., 2007,PASP, 119, 923
Perruchot S. et al., 2008, in McLean I. S., Casali M. M., eds, Proc. Conf. Ser. Vol. 7014, Ground-based and Airborne Instrumentation for Astronomy II. SPIE, Bellingham, p. 70140J
Pollacco D. L. et al., 2006,PASP, 118, 1407 Queloz D. et al., 2001, The Messenger, 105, 1
Ricker G. R. et al., 2015,J. Astron. Telesc. Instrum. Syst., 1, 014003 Sullivan P. W. et al., 2015,ApJ, 809, 77
Triaud A. H. M. J. et al., 2017,A&A, 608, A129 Yu L. et al., 2019,AJ, 158, 25
S U P P O RT I N G I N F O R M AT I O N
Supplementary data are available atMNRASonline.
WASP FP catalog submitted.csv
Please note: Oxford University Press is not responsible for the content or functionality of any supporting materials supplied by the authors. Any queries (other than missing material) should be directed to the corresponding author for the article.
A P P E N D I X : O B S E RVAT O R I E S
A1 Photometric Observatories
AstraLux – The AstraLux camera (Hormuth et al. 2008) is an instrument on the Calar Alto 2.2m telescope located in Spain. This instrument relies on the ‘Lucky Imaging’ technique to obtain nearly diffraction-limited seeing. This technique takes thousands of short exposure images and keeps only the best 5–10 per cent of images, as determined by the Strehl ratio, to make the final ‘lucky’ image.
EulerCam – EulerCam is the photometric imager hosted by the 1.2 m Leonhard Euler Telescope at La Silla. The telescope is also the home to CORALIE, which performs spectroscopic follow-up observations.
Liverpool/RATCAM/RISE – The Liverpool Telescope (LT) is a robotic instrument located at the Observatorio del Roque de los Muchachos on La Palma, Canary Islands. The RATCam instrument was the optical CCD camera until it was decommissioned in 2014 February. RATCam was replaced by the Infrared-Optical (IO:O) instrument to improve upon the field of view and sensitivity. The fast-readout, wide-field camera RISE was also used for some observations.
IAC80 – The IAC80 is an 80 cm optical telescope is part of Teide Observatory in Spain. Images are taken using the CAMELOT CCD imager.
TRAPPIST – The TRAnsiting Planets and PlanetesImals Small Telescope (TRAPPIST) is a pair of 60cm telescopes. The southern component, operational since 2010, is located in La Silla, Chile (Gillon et al.2011; Jehin et al. 2011). The more recent northern component, installed in 2016, is located at Ouka¨ımeden Observatory in Morocco (Barkaoui et al.2019).
JGT – The James Gregory Telescope (JGT), operational since 1962, is a 94 cm optical telescope located in St Andrews, Scotland. NITES – The Near Infra-red Transiting ExoplanetS (NITES) telescope is 0.4 m telescope located at El Observatorio del Roque de los Muchachos on La Palma, Canary Islands.
PIRATE – The Physics Innovations Robotic Astronomical Tele-scope Explorer (PIRATE) instrument is a robotic 43 cm teleTele-scope (Holmes et al.2011; Kolb2014; Kolb et al.2018). From 2009– 15, the telescope operated from the Observatori Astronomic de Mallorca and later moved to the Observatorio del Teide, Tenerife in 2016.
MERCATOR – This 1.2 m semi-robotic telescope is located at the Roque de los Muchachos Observatory on La Palma, Canary Islands.
KEELE – Keele University hosts two telescopes, a 31 cm refractor dating back to 1874 and a 60 cm reflector for current research including SuperWASP follow-up. Both are located on the campus.
LCO – The Las Cumbres Observatory is a network of robotic telescopes spanning the globe in eight different locations. The telescope network is dedicated to school groups and amateur astronomers, as well as members of the LCO network. Telescopes as part of this observatory include the 2m Faulkes Telescope North (Haleakala Observatory, Hawaii) and South (Siding Spring, New South Wales, Australia). 1 m Sinestro telescopes are located at Siding Spring Observatory (2), South African Astronomical Observatory in Sutherland (3), Cerro Tololo Observatory in Chile (3), and a single Sinestro at McDonald Observatory in Texas, USA. An additional two 1 m telescopes are under construction at Ali Observatory in Western Tibet, China. Finally, 0.4 m telescopes are available at Siding Spring Observatory (2), the South African
A2 Spectroscopic Observatories
CORALIE – CORALIE (Queloz et al.2001) is the high resolution spectrometer on the Swiss 1.2 m Leonhard Euler Telescope at La Silla Observatory. CORALIE is a major work-horse for false positive identification. In addition to characterizing numerous Su-perWASP planets, CORALIE has helped eliminate 156 candidates based on its follow-up.
OHP/SOPHIE – SOPHIE (Perruchot et al.2008; Bouchy et al. 2009, 2013) was the upgraded replacement for the ELODIE spectrograph and began observations in 2006. It is located at the Observatoire de Haute-Provence (OHP) in France. SOPHIE is a major contributor to the WASP mission, helping to characterize many WASP planets and identify 383 false positives.
INT/IDS – The Intermediate Dispersion Spectrograph (IDS) is a long-slit spectrograph at the 2.5 m Isaac Newton Telescope at the Observatorio del Roque de los Muchachos.
NOT/FIES – The Fibre-fed Echelle Spectrograph (FIES) is the high-resolution spectrograph on the 2.5 m Norwegian Optical Telescope. It is housed at the Observatorio del Roque de los Muchachos, La Palma, Canary Islands.
TrES – The Tillinghast Reflector Echelle Spectrograph is a fibre-fed optical echelle spectrograph mounted on the 1.5 m Tillinghast telescope at the Fred L. Whipple Observatory in Arizona.
ELODIE – ELODIE (Baranne et al. 1996) was an echelle spectrograph at the Observatoire de Haute-Provence 1.93 m reflector telescope in France. ELODIE was the precursor to CORALIE and was in operation from 1993 to 2006. As it was decommissioned very early in the WASP project, there are very few observations by this instrument.
CAFE – The Calar Alto Fiber-fed ´Echelle spectrograph (Aceituno et al.2013) is a single-fibre high resolution spectrograph located on the 2.2m telescope at the Calar Alto Observatory.
HET – The Hobby–Eberly Telescope (HET) at McDonald Obser-vatory in Texas is an 11 m telescope that hosts three spectroscopic instruments of high, medium, and low resolution.
HARPS – The High Accuracy Radial velocity Planet Searcher (HARPS; Mayor et al. 2003) instrument is one of the most successful radial velocity planet hunters. HARPS-N, located on the ESO 3.6m Telescopio Nazionale Galileo (TNG) telescope at La Silla Observatory, began operations in 2012.
graph on the 2.1 m telescope at the San Pedro M´artir Observatory (Meaburn et al.2003).
1Centre for Exoplanet Science, SUPA, School of Physics and Astronomy,
University of St Andrews, St Andrews KY16 9SS, UK
2Universit´e Grenoble Alpes, CNRS, IPAG, F-38000 Grenoble, France
3Qatar Environment and Energy Research Institute (QEERI), Hamad Bin
Khalifa University (HBKU), Qatar Foundation, Doha, Qatar 4Astrophysics Group, Keele University, Staffordshire, ST5 5BG, UK
5Centre for Exoplanets and Habitability, University of Warwick, Gibbet Hill
Road, Coventry, CV4 7AL, UK
6Department of Physics, University of Warwick, Coventry CV4 7AL, UK
7Astrobiology Research Unit, Universit´e de Li`ege, 19C All´ee du 6 Aoˆut,
B-4000 Li`ege, Belgium
8Oukaimeden Observatory, High Energy Physics and Astrophysics
Labora-tory, Cadi Ayyad University, Marrakech, Morocco
9Instituto de Astrof´ısica e Ciˆencias do Espac¸o, Universidade do Porto,
CAUP, Rua das Estrelas, P-4150-762 Porto, Portugal
10Science Advocates Association, Picassa 5/38, PL-03-126 Warsaw, Poland
11INAF, Osservatorio Astrofisico di Torino, via Osservatorio 20, I-10025
Pino Torinese, Italy
12Observatoire de Gen`eve, Universit´e de Gen`eve, 51 Chemin des Maillettes,
CH-1290 Sauverny, Switzerland
13Department of Physical Sciences, The Open University, Milton Keynes,
MK7 6AA, UK
14Aix Marseille Universit´e, CNRS, CNES, LAM (Laboratoire
d’Astrophysique de Marseille), F-13388 Marseille, France
15Cavendish Laboratory, JJ Thompson Avenue, CB3 0HE, Cambridge, UK
16INAF - Osservatorio Astrofisico di Catania, Via S. Sofia 78, I-95123
Catania, Italy
17Hobart and William Smith Colleges, Department of Physics, Geneva, NY
14456, USA
18Institut d’astrophysique de Paris, UMR7095 CNRS, Universit´e Pierre &
Marie Curie, 98bis boulevard Arago, F-75014 Paris, France
19Space sciences, Technologies and Astrophysics Research (STAR) Institute,
Universit´e de Li`ege, B-4000 Li`ege, Belgium
20Department of Physics, University of Oxford, Denys Wilkingson Building,
Keble Road, Oxford, OX1 3RH, UK
21Center for Astrophysics, Harvard & Smithsonian, 60 Garden St.,
Cam-bridge, MA 02138, USA
22School of Physics & Astronomy, University of Birmingham, Edgbaston,
Birmingham B15 2TT, UK
This paper has been typeset from a TEX/LATEX file prepared by the author.