ISSN Print: 2327-4336
DOI: 10.4236/gep.2019.78008 Aug. 16, 2019 105 Journal of Geoscience and Environment Protection
Influence of the Atlantic Multidecadal
Oscillation and the Pacific Decadal Oscillation
on Global Temperature by Wavelet-Based
Multifractal Analysis
Fumio Maruyama
Department of Sport and Health Science, Matsumoto University, Matsumoto, Japan
Abstract
Oceanic–atmospheric patterns, Atlantic Multidecadal Oscillation (AMO) and Pacific Decadal Oscillation (PDO), and their respective influence on the glob-al warming hiatus were the main interests of this study. In generglob-al, a fractglob-al property is observed in the time series of dynamics of complex systems; hence, we investigated the relations among the AMO, PDO, and El Niño-Southern Oscillation (ENSO) from the point of view of multifractality, in which changes in fractality were detected with multifractal analysis using wavelet transform. For the periods 1950-1976 and 1998-2012, global temper-ature increased little, with positive AMO and negative PDO indices; subse-quently, the rate of temperature increase weakened. Global temperature in-creased again in 1976, with the reversal of the AMO and PDO indices from negative to positive. More specifically, AMO, PDO, and Niño3.4 (ENSO in-dex) exhibited fractality change from multifractality to monofractality, pro-viding them stability. Generally, the PDO was influenced largely by the ENSO. But, around 1960 and around 2000, whose periods corresponded to hiatus pe-riods in global warming, the influence of the ENSO on the PDO was weak. In 1998, the AMO increased and PDO decreased and global temperature increased little and the multifractality of PDO, and Niño3.4 was weak, which corres-ponded to the change from multifractality to monofractality in 1976. Wavelet analysis showed the leads of PDO and Niño3.4 indices with respect to global temperature. Consequently, the PDO and ENSO showed large influence on global temperature and, further, on the global warming hiatus.
Keywords
AMO, PDO, ENSO, Global Temperature, Wavelet, Multifractal How to cite this paper: Maruyama, F.
(2019). Influence of the Atlantic Multide-cadal Oscillation and the Pacific DeMultide-cadal Oscillation on Global Temperature by Wavelet-Based Multifractal Analysis. Jour-nal of Geoscience and Environment Pro-tection, 7, 105-117.
https://doi.org/10.4236/gep.2019.78008
Received: June 24, 2019 Accepted: August 13, 2019 Published: August 16, 2019
Copyright © 2019 by author(s) and Scientific Research Publishing Inc. This work is licensed under the Creative Commons Attribution International License (CC BY 4.0).
DOI: 10.4236/gep.2019.78008 106 Journal of Geoscience and Environment Protection
1. Introduction
The Atlantic Multidecadal Oscillation (AMO) is a near-global scale mode of the observed multidecadal climate variability with alternating warm and cool phases over large parts of the Northern Hemisphere. Many prominent examples of re-gional multidecadal climate variability have been related to the AMO, including the North Eastern Brazilian and the African Sahel rainfall, the Atlantic hurri-canes, and the North American and European summer climates (Knight et al., 2006). The AMO is a genuine quasiperiodic cycle of internal climate variability persisting for many centuries and is related to variability in the oceanic thermo-haline circulation (THC) (Knight et al., 2005). The change in phase of the AMO in the 1960s may have caused a cooling of the US and European summer climates (Sutton & Hodson, 2005). When the phase of the AMO was positive, the Atlantic hurricane activity increased (Goldenberg et al., 2001). The importance of the AMO has been recognized by ecologists as a significant factor influencing ecosystems state (Nye et al., 2014). For instance, there have been studies focused on the im-pacts on soil moisture of AMO, along with another oceanic-atmospheric pattern, the Pacific Decadal Oscillation (PDO) (Tang et al., 2014). The rate of global mean surface temperature increase slowed between 1998 and 2012 and the change was often termed the “global warming hiatus” (Medhang et al., 2017).
Self-similarity, alternatively known as fractal property, exists in various ob-jects in nature. Monofractality shows an approximately similar pattern at differ-ent scales and is characterized by a fractal dimension. Multifractality is a non-uniform, more complex fractal and is decomposed into many subsets characte-rized by different fractal dimensions. Moreover, fractal properties can be ob-served in the time series representing the dynamics of complex systems. A change in fractality accompanies a phase transition and changes of state. Multi-fractal properties of daily rainfall were investigated in two contrasting climates: an East Asian monsoon climate with extreme rainfall variability and a temperate climate with moderate rainfall variability (Svensson et al., 1996). In both cli-mates, the frontal rainfall showed monofractality, whereas the convective-type rainfall showed multifractality.
On the above basis, climate change can be interpreted from the perspective of fractals. A change of fractality may be observed when a climate changes. We at-tempt to explain changes in climate, referred to as regime shifts, through fractal-ity analysis.
For analyzing the multifractal behavior of the climate index, we apply the wavelet transform, as wavelet methods are useful in the analysis of complex non-stationary time series. The wavelet transform allows reliable multifractal analysis to be performed (Muzy et al., 1991). In terms of the multifractal analy-sis, we concluded in our previous paper (Maruyama & Morimoto, 2015) that a climatic regime shift corresponds to a change from multifractality to monofrac-tality of the PDO index.
DOI: 10.4236/gep.2019.78008 107 Journal of Geoscience and Environment Protection and PDO and to understand their influence on the global warming hiatus. From the view of multifractality, we investigated the relations among the AMO, PDO, ENSO, and global temperature. To detect the changes in fractality, we performed a multifractal analysis using the wavelet transform and wavelet coherence.
2. Data and Method of Analysis
We used a monthly time series provided by NOAA’s Climate Prediction Center, USA (CPC), as detailed below, and applied the AMO, PDO, Niño3.4 indices, and global mean surface air temperature anomalies as inputs of the analysis.
We used the Daubechies wavelet as the analyzing wavelet because it is widely used in solving a broad range of problems, e.g., self-similarity properties of a signal or fractal problems and signal discontinuities. The data used consisted of a discrete signal that fitted the Daubechies mother wavelet with the capability of precise inverse transformation. Hence, precisely optimal value of τ(q) could be calculated as explained below. We then estimated the scaling of the partition function Zq(a), defined as the sum of the q-th powers of the modulus of the wavelet transform coefficients at scale a. In our study, the wavelet-transform coefficients did not become zero, and therefore, for a precise calculation, the summation was considered for the entire set. Muzy et al. (1991) defined Zq(a) as the sum of the q-th powers of the local maxima of the modulus to avoid division by zero. We obtained the partition function Zq(a):
( )
[ ]
( )
, qq
Z a =
∑
W f a bϕ ,(1)
where W f a bϕ
[ ]( )
, is the wavelet coefficient of the function f, a is a scale pa-rameter and b is a space parameter. The time window was set to 6 years for rea-sons outlined in the next statements. We calculated the wavelets using a time window of various periods: 10, 6, and 4 years. For a time window of 10 years, a slow change of fractality was observed. Such case was inappropriate for finding a rapid change of regime shift because when we integrated the wavelet coefficient over a wide range, small changes were canceled. In contrast, a fast change of fractality was observed for a time window of 4 years. Specifically, the first and subsequent data overlapped by 3 years, much shorter than the 9 years in the case of the 10-year calculation, thus leading to a large change of fractality. Moreover, for the 6-year time window, a moderate change of fractality was observed, and hence, we set the time window to this period. For small scales, we expect( )
~ ( )qq
Z a aτ . (2)
First, let us investigate the changes of Zq(a) in time series at a different scale a for each q, using a plot of the logarithm of Zq(a) against the logarithm of time scale a. Here τ(q) was the slope of the linear fitted line on the log-log plot for each q. Next, we plotted τ(q) vs q. The time window was then shifted forward 1 year and the process was repeated.
DOI: 10.4236/gep.2019.78008 108 Journal of Geoscience and Environment Protection convex upwards with respect to q, then the time series is classified as multifractal
(Frish & Parisi, 1985). Further, we provided a definition for the value of R2,
which is the coefficient of determination, for fitting the straight line as follows: if R2 ≥ 0.98, then the time series is monofractal; otherwise, if 0.98 > R2, then the time series is multifractal.
Subsequently, we calculated τ(q) of different moments q for individual records for the Niño3.4 index. Figure 1 shows a plot of τ(q) between 1980 and 1994. The data were analyzed in 6-year sets, e.g., τ(q) of n80 was calculated for 1980-1985, and that of n81 was calculated for 1981-1986. For a study of the change of fractality, the time window was shifted forward to 1 year, and τ(q) was calculated from n80 up to n89. A monofractal signal would correspond to a straight line for τ(q), whereas τ(q) for a multifractal signal would be nonlinear. Most of the multifractality observed was due to the negative value of q, i.e., small fluctuations were more inhomogeneous than large fluctuations. From Figure 1, the data sets in the cases of was n80 - n82, n85 - n87, and n89 were monofractal, whereas those in the cases of n83, n84, and n88 were multifractal.
Accordingly, we plotted the value of the τ(−6) in each index. Here, a negative large value of τ(−6) showed large multifractality. More importantly for the
τ(−6), q = −6 was the appropriate number showing the change of τ. Additional-ly, the value of τ(−6) did not always correspond to the fractality obtained from the value of R2.
3. Results
3.1. Relationship between the AMO and PDO
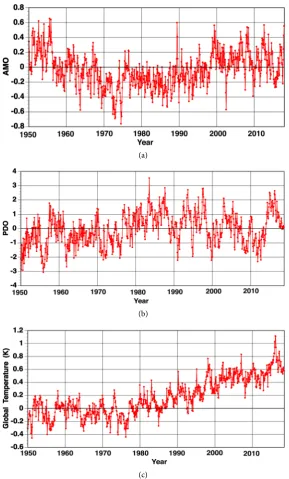
Figure 2(a) and Figure 2(b) show the AMO and PDO indices, respectively. For a period in 1980s, both indices had opposite changes. On one hand, the AMO
[image:4.595.262.487.476.704.2]DOI: 10.4236/gep.2019.78008 109 Journal of Geoscience and Environment Protection (a)
(b)
[image:5.595.229.519.68.548.2](c)
Figure 2. (a) Atlantic Multidecadal Oscillation (AMO) index; (b) Pacific Decadal Oscilla-tion (PDO) index; (c) Global mean temperature anomalyes.
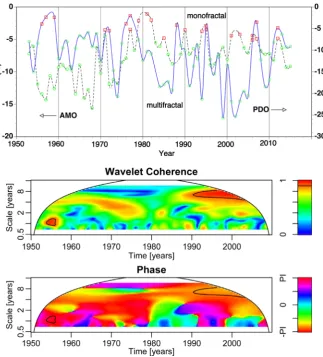
DOI: 10.4236/gep.2019.78008 110 Journal of Geoscience and Environment Protection from Figure 3 (top). We applied the Morlet wavelet to show the wavelet cohe-rence and phase between the AMO and PDO in Figure 3 (middle and bottom, respectively). Coherence between the AMO and PDO indices was strong near 1970 and for 1990-2000, during which a lead of the PDO index was observed. The phase of AMO index was delayed relative to PDO index, and it was opposite phase of the PDO index. Those opposing phases were also the reason for the similar changes in fractality in both the AMO and PDO. Those trends are also shown in the ENSO indices, the Niño3.4 index and Southern Oscillation Index (SOI) (Maruyama, 2018). The Niño3.4 and SOI are obtained from sea surface temperature and sea level pressure, respectively and the phases difference is π. For 1956, the AMO changed from positive to negative, whereas the PDO changed from negative to positive. The multifractality of AMO became strong and the AMO became unstable and that of PDO became monofractality and the PDO
DOI: 10.4236/gep.2019.78008 111 Journal of Geoscience and Environment Protection became stable. For 1976, the AMO and PDO indices changed from negative to positive, accompanied by an increase in global temperature. Moreover, the AMO was negative for 1955-2000 but increased to positive once in 1976 and then be-came negative. The τ(−6) of the AMO and PDO increased and the fractality of the AMO and PDO became monofractal in 1976 and the AMO and PDO became sta-ble. For 1998, the AMO increased and PDO decreased and global temperature in-creased little and the multifractality of PDO and Niño3.4 was weak, which corres-ponded to the change from multifractality to monofractality in 1976.
3.2. Relationship between the AMO and Global Temperature
Figure 2(c) shows the global mean temperature anomalies. Here, the rate of in-crease in global mean surface temperature slowed down for 1950-1975 and 1998-2012. The change between 1998 and 2012, of which the change for the second period was often referred to as the “global warming hiatus” (Medhang et
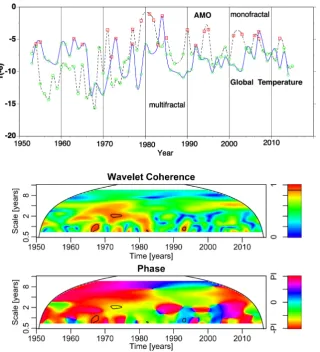
[image:7.595.216.537.305.658.2]al., 2017). The τ(−6) of the AMO and global temperature are shown in Figure 4
DOI: 10.4236/gep.2019.78008 112 Journal of Geoscience and Environment Protection (top). Note the striking similarity between the patterns of increase and decrease in τ(−6), that is, similarity in the changes in fractality. The lead of AMO index was shown. We show the wavelet coherence and phase between the AMO and global temperature using the Morlet wavelet in Figure 4 (middle and bottom, respectively). Coherence between the AMO index and global temperature in 1-2-year scale was strong for 1960-1980 and the strong lead of the AMO index was not observed.
3.3. Relationship between the PDO and Global Temperature
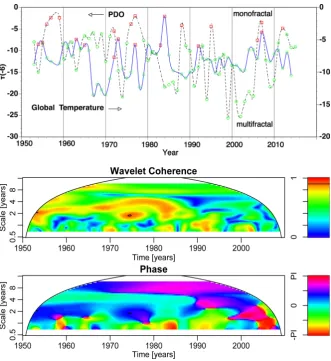
Figure 2(b) shows a plot of the PDO index, whereas the τ(−6) of the PDO and
global temperature are shown in Figure 5 (top). Fractality for PDO and global temperature changed with many reverse changes. For the period describing the global warming hiatus, the changes in fractality were very similar in the 2000s. Figure 5 shows the wavelet coherence (middle) and phase (bottom) between the
[image:8.595.209.541.297.659.2]DOI: 10.4236/gep.2019.78008 113 Journal of Geoscience and Environment Protection PDO and global temperature using the Morlet wavelet. Coherence between the PDO index and global temperature in the 2-year scale was strong for 1970-1985, and the lead of the PDO index was observed.
3.4. Relationship between the ENSO and Global Temperature
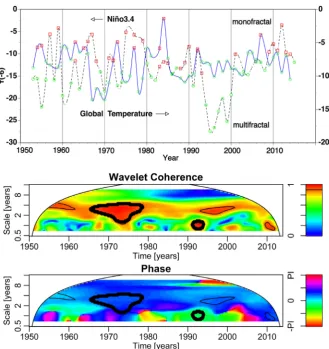
Figure 6 (top) shows a plot of the τ(−6) of the Niño3.4 and global temperature.
Changes in fractality were very similar for 1970s and 2000s, when the coherence was strong. Figure 6 shows the wavelet coherence (middle) and phase (bottom) between the Niño3.4 and global temperature using the Morlet wavelet. Specifi-cally, coherence between the Niño3.4 and global temperature was strong for 1965-1975 and 1990-2005, and the lead of the Niño3.4 index was observed. The strong influence of the ENSO on the global temperature was shown.
3.5. Relationship between the PDO and ENSO
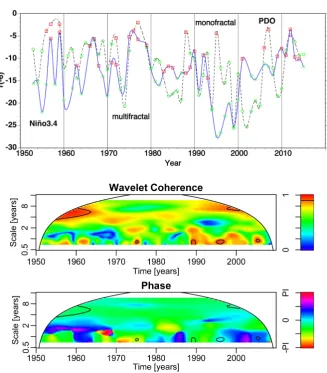
Figure 7 (top) shows a plot of the τ(−6) of the PDO and Niño3.4. Apparently,
[image:9.595.210.540.306.656.2]DOI: 10.4236/gep.2019.78008 114 Journal of Geoscience and Environment Protection
Figure 7. The τ(−6) of the PDO, and Niño3.4 index (top). Wavelet coherence (middle) and phase (bottom) between the PDO and Niño3.4 index. In the wavelet phase, the posi-tive value shown by the blue and pink shading means that the PDO leads Niño3.4 index and the negative value shown by the green, yellow and red shading means that Niño3.4 index leads the PDO.
changes in fractality were similar for the period 1955-1980. Moreover, the wave-let coherence and phase between the PDO and Niño3.4 using the Morwave-let wavewave-let are shown in Figure 7 (middle and bottom, respectively). Coherence between the PDO and Niño3.4 indices was strong for 1955-1965 and 1990-2000, and the lead of the Niño3.4 index was observed. Here, the strong influence of ENSO on the PDO was apparent.
But, around 1960 and around 2000, the Niño3.4 index laged the PDO, whose periods corresponded to hiatus periods in global warming. A relatively novel method for identifying running leading-aging LL-relations shows the same re-sults (Seip & Wang, 2018). The sign of the PDO index changed at 1976, and both fractalities changed from multifractality to monofractality.
4. Discussion
DOI: 10.4236/gep.2019.78008 115 Journal of Geoscience and Environment Protection which the AMO index was negative and PDO was positive. However, global temperature increased little for 1950-1976, during which the PDO was negative and the first half of the AMO was positive. Likewise, global temperature in-creased little for 1998-2012, a period alternatively referred to as the global warming hiatus, during which the AMO was positive and the PDO was negative, except for the medial term.
Accordingly, the AMO and PDO indices exhibited opposite changes. The cool AMO phases, whose AMO were negative, occurred in the period 1965-1998. The PDO index became positive during the warm phase of 1976-1998. In the positive phase, PDO favored El Niño, which tended to warm the atmosphere (Tollefson, 2014). The phase of AMO index was delayed relative to PDO index, and oppo-site the phase of the PDO index. When the AMO is cool phase (negative), PDO is warm phase (positive). For the AMO and PDO, the changes in fractality were similar, which was due to the opposite phase.
Coherence between the AMO and PDO indices, and those between the AMO and Niño3.4 and the PDO and Niño3.4, was strong near the year 1970 and in the period 1990-2000. Hence the strong coherence between the AMO and PDO was due to the strong coherence between the other two. Moreover, coherence be-tween the AMO index and global temperature in 1-2-year scale was strong for 1960-1980. During the period of the global warming hiatus, the changes in frac-tality between the PDO and global temperature were very similar in the 2000s. Coherence between the PDO index and global temperature in the same 2-year scale was strong for 1970-1985, and the lead of the PDO index was observed. Such results showed the influence of PDO on the global temperature, relative to the global warming hiatus. Changes in fractality between the ENSO and global temperature were very similar for 1970s and 2000s. More particularly, coherence between the ENSO and global temperature was strong for the periods 1965-1975 and 1990-2005, and the lead of the Niño3.4 index was observed. Meehl et al. (2011) indicated that a hiatus period is a relatively common climatic phenome-non and may be linked to La Niña-like conditions. Kosaka and Xie (2013) show that the current hiatus is part of natural climate variability, tied specifically to La Niña-like decadal cooling. The La Niña of 1998 may be able to push the ocean into a cool phase of the PDO (Tollefson, 2014).
mono-DOI: 10.4236/gep.2019.78008 116 Journal of Geoscience and Environment Protection fractality and stability.
For 1998, the AMO increased and PDO decreased, with an accompanying lit-tle increase in global temperature and the multifractality of PDO, and Niño3.4 was weak, which corresponded to the change from multifractality to monofrac-tality in 1976. Our wavelet analysis showed the leads of PDO and Niño3.4 indic-es compared with global temperature, which manifindic-ested their large influence on global temperature and global warming hiatus. Generally, the PDO was influ-enced largely by the ENSO. But, around 1960 and around 2000, whose periods corresponded to hiatus periods in global warming, the Niño3.4 index laged the PDO and the influence of the ENSO on the PDO was weak.
5. Conclusion
In the present study, we investigated two oceanic-atmospheric patterns, namely, AMO and PDO, relative to their influence on the global warming hiatus. Based on the point of view of multifractality, we examined the relationships that exist among the AMO, PDO, ENSO, and global temperature. To detect the changes in fractality, we examined the multifractal analysis using the wavelet transform. We showed the changes in fractality by plotting the τ-function and used the wavelet coherence. The main findings are summarized as follows:
1) For the periods 1950-1976 and 1998-2012, global temperature increased lit-tle, with positive AMO and negative PDO indices; subsequently, the rate of temperature increase weakened.
2) Global temperature increased again in 1976, with the reversal of the AMO and PDO indices from negative to positive. More specifically, AMO, PDO, and Niño3.4 (ENSO index) exhibited fractality change from multifractality to mono-fractality, providing them stability. Generally, the PDO was influenced largely by the ENSO. But, around 1960 and around 2000, whose periods corresponded to hiatus periods in global warming, the influence of the ENSO on the PDO was weak.
3) In 1998, the AMO increased and PDO decreased and global temperature increased little and the multifractality of PDO, and Niño3.4 was weak, which corresponded to the change from multifractality to monofractality in 1976. Wavelet analysis showed the leads of PDO and Niño3.4 indices with respect to global temperature. Consequently, the PDO and ENSO showed large influence on global temperature and, further, on the global warming hiatus.
These findings will contribute to further studies on climate change.
Conflicts of Interest
The author declares no conflicts of interest regarding the publication of this pa-per.
References
Turbu-DOI: 10.4236/gep.2019.78008 117 Journal of Geoscience and Environment Protection
lence. In M. Ghil, R. Benzi, & G. Parisi (Eds.), Turbulence and Predictability in Geo-physical Fluid Dynamics and Climate Dynamics (pp. 84-88). New York: North-Holland.
Goldenberg, S. B., Landsea, C. W., Mestas-Nuñez, A. M., & Gray, W. M. (2001). The Re-cent Increase in Atlantic Hurricane Activity: Causes and Implications. Science, 293,
474-479.https://doi.org/10.1126/science.1060040
Knight, J. R., Allan, R. J., Folland, C. K., Vellinga, M., & Mann, M. E. (2005). A Signature of Persistent Natural Thermohaline Circulation Cycles in Observed Climate. Geophys-ical Research Letters, 32, L20708.https://doi.org/10.1029/2005GL024233
Knight, J. R., Folland, C. K., & Scaife, A. A. (2006). Climate Impacts of the Atlantic Mul-tidecadal Oscillation. Geophysical Research Letters, 33, L17706.
https://doi.org/10.1029/2006GL026242
Kosaka, Y., & Xie, S. P. (2013). Recent Global-Warming Hiatustied to Equatorial Pacific Surface Cooling. Nature, 501, 403-407.https://doi.org/10.1038/nature12534
Maruyama, F. (2018). Relation between Niño3.4 and SOI by Wavelet-Based Multifractal Analysis. The International Journal of Engineering and Science, 7, 67-74.
Maruyama, F., Kai, K., & Morimoto, H. (2015). Wavelet-Based Multifractal Analysis on Climatic Regime Shifts. Journal of the Meteorological Society of Japan, 93, 331-341.
https://doi.org/10.2151/jmsj.2015-018
Medhang, I., Stolpe, M. B., Fischer, E. M., & Knutti, R. (2017). Reconciling Controversies about the “Global Warming Hiatus”. Nature, 545, 41-47.
https://doi.org/10.1038/nature22315
Meehl, G. A., Arblaster, J. M., Fasullo, J. T., Hu, A., & Trenberth, K. E. (2011). Mod-el-Based Evidence of Deep-Ocean Heat Uptake during Surface-Temperature Hiatus Periods. Nature Climate Change, 1, 360-364.https://doi.org/10.1038/nclimate1229
Muzy, J. F., Bacry, E., & Arneodo, A. (1991). Wavelets and Multifractal Formalism for Singular Signals: Application to Turbulence Data. Physical Review Letters, 67,
3515-3518.https://doi.org/10.1103/PhysRevLett.67.3515
Nye, J. A., Baker, M. R., Bell, R., Kenny, A., Kilbourne, K. H., Friedland, K. D., Martino, E., Stachura, M. M., Houtan, K. S. V., & Wood, R. (2014). Ecosystem Effects of the At-lantic Multidecadal Oscillation. Journal of Marine Systems, 133, 103-116.
https://doi.org/10.1016/j.jmarsys.2013.02.006
Seip, K. L., & Wang, H. (2018). The Hatus in Global Warming and Interactions between the El Nino and the Pacific Decadal Oscillation: Comparing Observations and Model-ing Results. Climate, 6, 72.https://doi.org/10.3390/cli6030072
Sutton, R. T., & Hodson, D. L. R. (2005). Atlantic Ocean forcing of North American and European Summer Climate. Science, 309, 115-118.
https://doi.org/10.1126/science.1109496
Svensson, C., Olsson, J., & Berndtsson, R. (1996). Multifractal Properties of Daily Rainfall in Two Different Climates. Water Resources Research, 32, 2463-2472.
https://doi.org/10.1029/96WR01099
Tang, C., Chen, D., Crosby, B. T., Piechota, T. C., & Wheaton, J. M. (2014). Is the PDO or AMO the Climate Driver of Soil Moisture in the Salmon River Basin, Idaho? Global and Planetary Change, 120, 16-23.https://doi.org/10.1016/j.gloplacha.2014.05.008